RSI Stratégie de négociation en divergence
Auteur:ChaoZhang est là., Date: 2024-01-22 11h45 et 25 minLes étiquettes:
Nom de la stratégie
RSI Stratégie de négociation de la divergence haussière/baissière
Résumé
Cette stratégie identifie des signaux de divergence RSI haussiers/baissiers réguliers et cachés pour déterminer les positions longues et courtes.
Principaux
Lorsque le prix atteint un nouveau sommet et que le RSI ne parvient pas à atteindre un nouveau sommet, il forme une divergence haussière, qui est traitée comme un signal de vente. Lorsque le prix atteint un nouveau sommet et que le RSI ne parvient pas à atteindre un nouveau sommet, il forme une divergence baissière, qui est traitée comme un signal d'achat.
Analyse des avantages
- Les signaux de divergence ont une fiabilité relativement élevée avec un taux de réussite plus élevé.
- L'identification des divergences haussières/baissières régulières et cachées fournit une couverture étendue.
- Les paramètres réglables de l'indice de rentabilité le rendent adaptable à différents environnements de marché.
Analyse des risques
- Les signaux de divergence cachés ont une probabilité plus élevée d'erreur de jugement.
- Une révision manuelle est nécessaire pour filtrer les signaux mal jugés.
- L'efficacité dépend des paramètres du RSI.
Directions d'optimisation
- Optimiser les paramètres RSI pour trouver les meilleures combinaisons de paramètres
- Ajouter des algorithmes d'apprentissage automatique pour l'identification automatique des vrais signaux.
- Incorporer plus d'indicateurs pour vérifier la fiabilité du signal.
Résumé
Cette stratégie identifie les signaux de trading de divergence RSI basés sur une divergence haussière/baissière régulière et cachée pour déterminer les positions longues ou courtes, ce qui fournit un taux de gain relativement plus élevé.
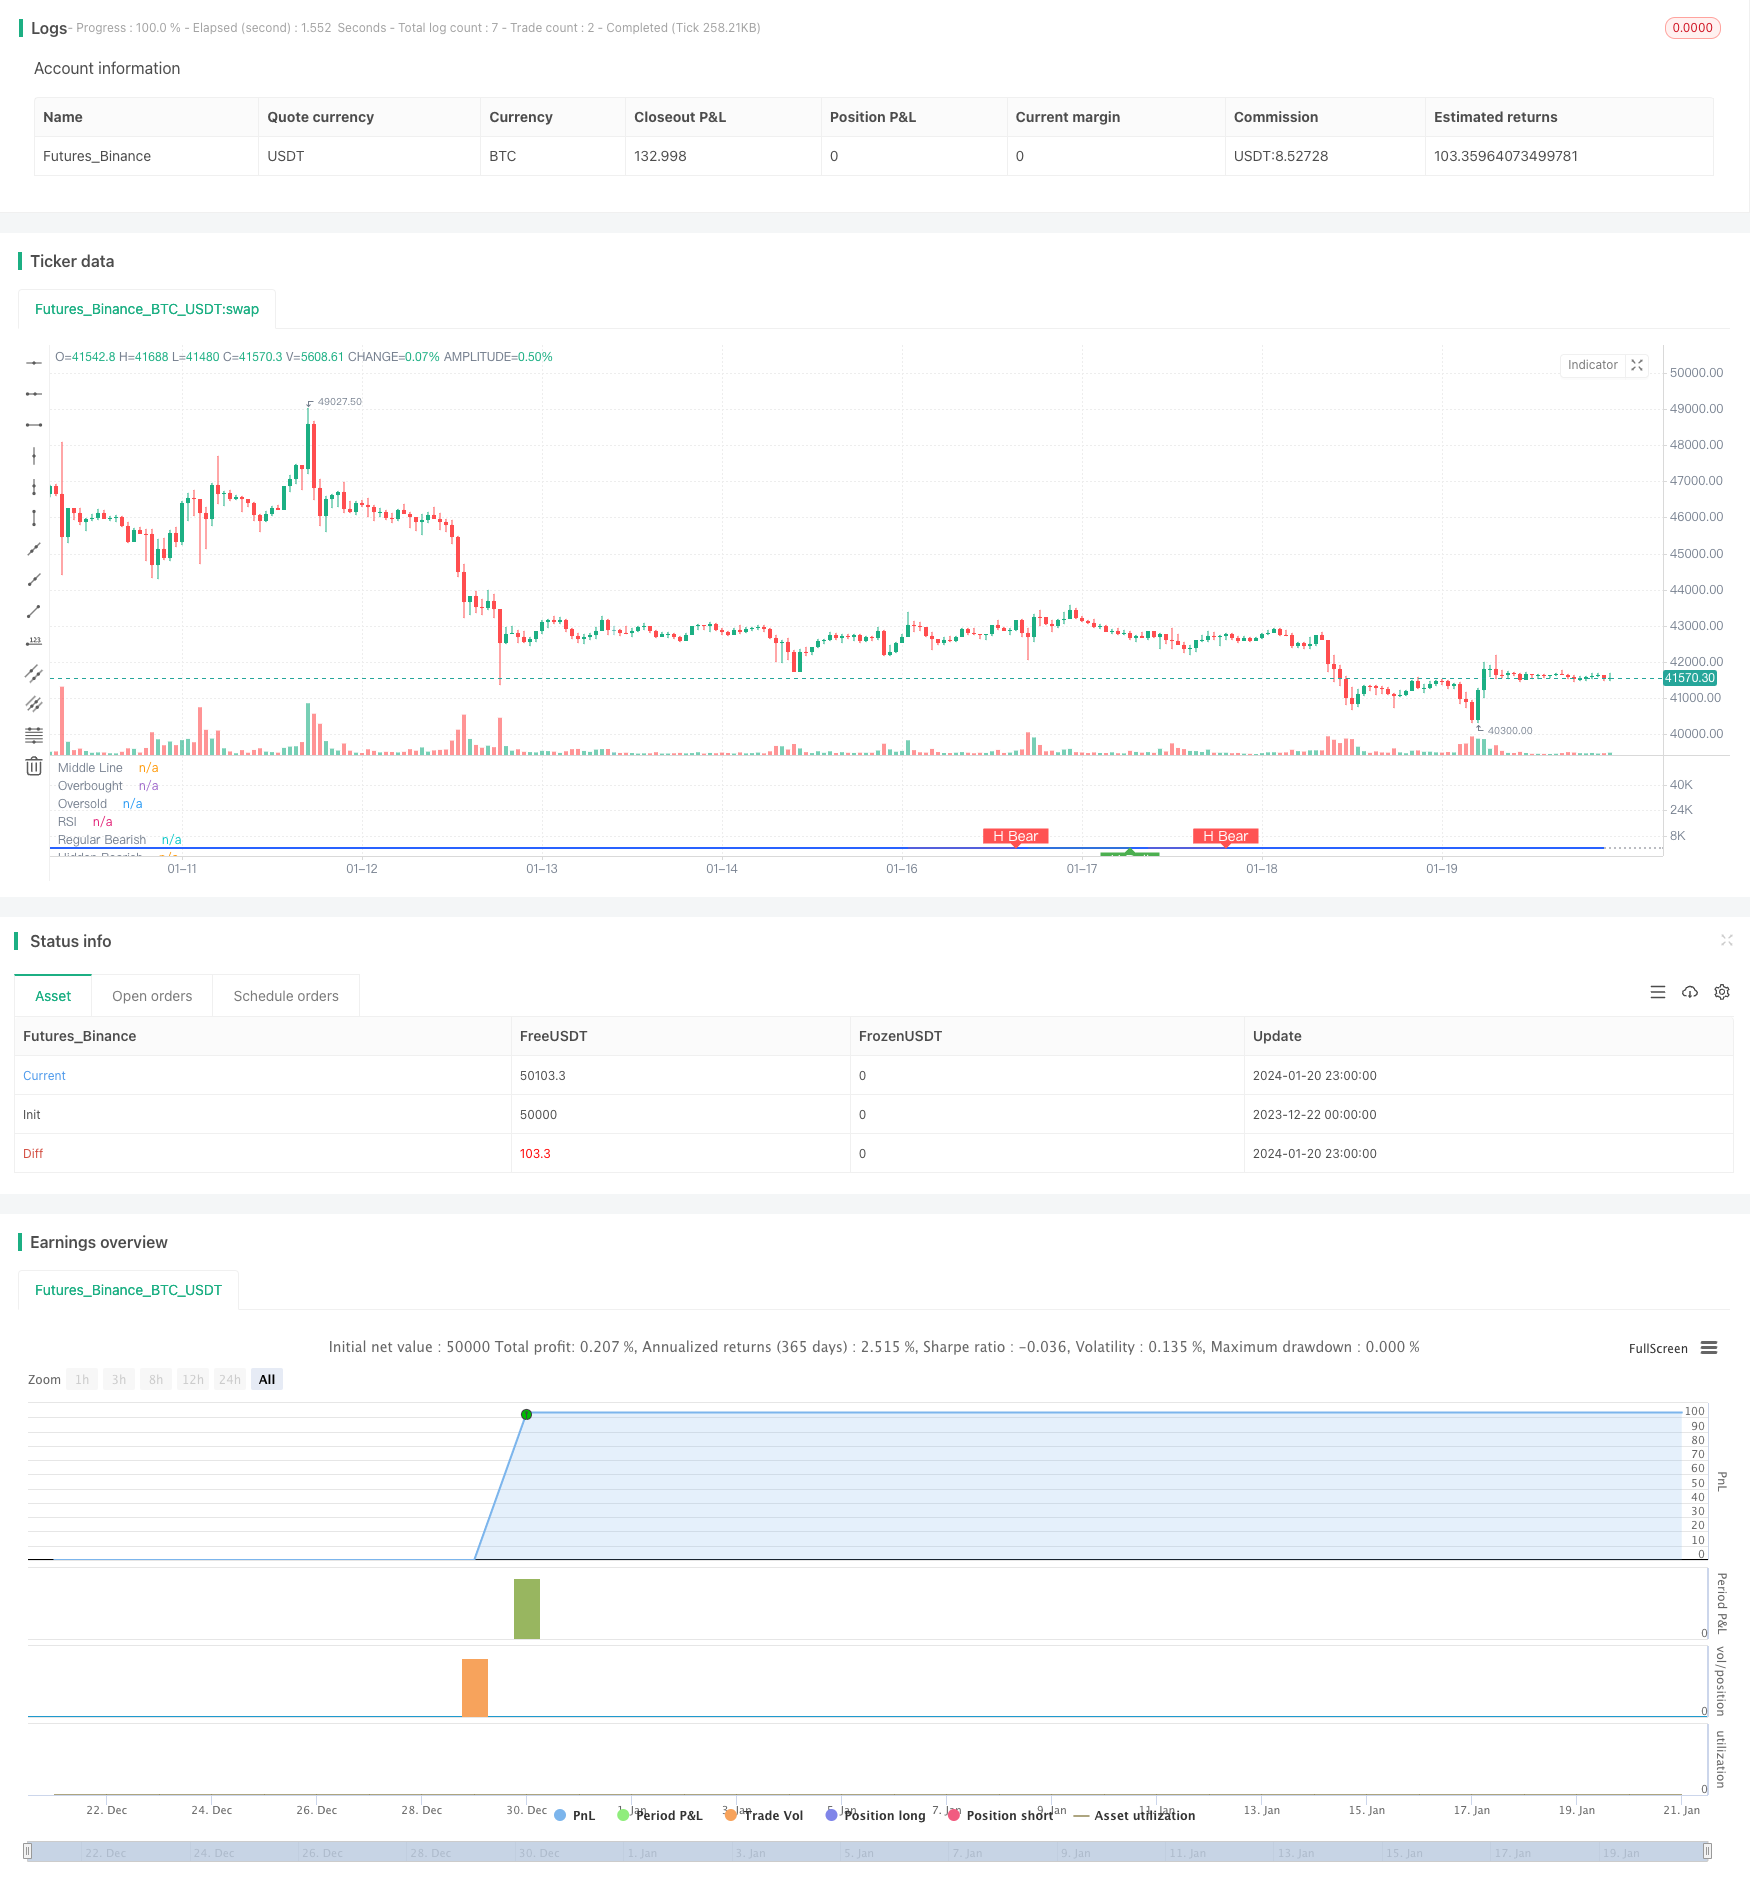
/*backtest
start: 2023-12-22 00:00:00
end: 2024-01-21 00:00:00
period: 1h
basePeriod: 15m
exchanges: [{"eid":"Futures_Binance","currency":"BTC_USDT"}]
*/

//@version=5
strategy(title="Divergence Indicator")
len = input.int(title="RSI Period", minval=1, defval=14)
src = input(title="RSI Source", defval=close)
lbR = input(title="Pivot Lookback Right", defval=5)
lbL = input(title="Pivot Lookback Left", defval=5)
rangeUpper = input(title="Max of Lookback Range", defval=60)
rangeLower = input(title="Min of Lookback Range", defval=5)
plotBull = input(title="Plot Bullish", defval=true)
plotHiddenBull = input(title="Plot Hidden Bullish", defval=true)
plotBear = input(title="Plot Bearish", defval=true)
plotHiddenBear = input(title="Plot Hidden Bearish", defval=true)
bearColor = color.red
bullColor = color.green
hiddenBullColor = color.new(color.green, 80)
hiddenBearColor = color.new(color.red, 80)
textColor = color.white
noneColor = color.new(color.white, 100)
osc = ta.rsi(src, len)

plot(osc, title="RSI", linewidth=2, color=#2962FF)
hline(50, title="Middle Line", color=#787B86, linestyle=hline.style_dotted)
obLevel = hline(70, title="Overbought", color=#787B86, linestyle=hline.style_dotted)
osLevel = hline(30, title="Oversold", color=#787B86, linestyle=hline.style_dotted)
fill(obLevel, osLevel, title="Background", color=color.rgb(33, 150, 243, 90))

plFound = na(ta.pivotlow(osc, lbL, lbR)) ? false : true
phFound = na(ta.pivothigh(osc, lbL, lbR)) ? false : true
_inRange(cond) =>
	bars = ta.barssince(cond == true)
	rangeLower <= bars and bars <= rangeUpper

//------------------------------------------------------------------------------
// Regular Bullish
// Osc: Higher Low

oscHL = osc[lbR] > ta.valuewhen(plFound, osc[lbR], 1) and _inRange(plFound[1])

// Price: Lower Low

priceLL = low[lbR] < ta.valuewhen(plFound, low[lbR], 1)
// bull : 상승 Condition : 조건
bullCond = plotBull and priceLL and oscHL and plFound // 상승다이버전스?
strategy.entry("상승 다이버전스 진입", strategy.long, when = bullCond)
strategy.close("상승 다이버전스 진입", when = ta.crossover(osc, 50))
plot(
     plFound ? osc[lbR] : na,
     offset=-lbR,
     title="Regular Bullish",
     linewidth=2,
     color=(bullCond ? bullColor : noneColor)
     )

plotshape(
	 bullCond ? osc[lbR] : na,
	 offset=-lbR,
	 title="Regular Bullish Label",
	 text=" Bull ",
	 style=shape.labelup,
	 location=location.absolute,
	 color=bullColor,
	 textcolor=textColor
	 )

//------------------------------------------------------------------------------
// Hidden Bullish
// Osc: Lower Low

oscLL = osc[lbR] < ta.valuewhen(plFound, osc[lbR], 1) and _inRange(plFound[1])

// Price: Higher Low

priceHL = low[lbR] > ta.valuewhen(plFound, low[lbR], 1)
hiddenBullCond = plotHiddenBull and priceHL and oscLL and plFound
// strategy.entry("히든 상승 다이버전스 진입", strategy.long, when = hiddenBullCond)
// strategy.close("히든 상승 다이버전스 진입", when = ta.crossover(osc, 50))
plot(
	 plFound ? osc[lbR] : na,
	 offset=-lbR,
	 title="Hidden Bullish",
	 linewidth=2,
	 color=(hiddenBullCond ? hiddenBullColor : noneColor)
	 )

plotshape(
	 hiddenBullCond ? osc[lbR] : na,
	 offset=-lbR,
	 title="Hidden Bullish Label",
	 text=" H Bull ",
	 style=shape.labelup,
	 location=location.absolute,
	 color=bullColor,
	 textcolor=textColor
	 )

//------------------------------------------------------------------------------
// Regular Bearish
// Osc: Lower High

oscLH = osc[lbR] < ta.valuewhen(phFound, osc[lbR], 1) and _inRange(phFound[1])

// Price: Higher High

priceHH = high[lbR] > ta.valuewhen(phFound, high[lbR], 1)
// bear : 하락
bearCond = plotBear and priceHH and oscLH and phFound
// strategy.entry("하락 다이버전스 진입", strategy.short, when = bearCond)
// strategy.close("하락 다이버전스 진입", when = ta.crossunder(osc, 50))
plot(
	 phFound ? osc[lbR] : na,
	 offset=-lbR,
	 title="Regular Bearish",
	 linewidth=2,
	 color=(bearCond ? bearColor : noneColor)
	 )

plotshape(
	 bearCond ? osc[lbR] : na,
	 offset=-lbR,
	 title="Regular Bearish Label",
	 text=" Bear ",
	 style=shape.labeldown,
	 location=location.absolute,
	 color=bearColor,
	 textcolor=textColor
	 )

//------------------------------------------------------------------------------
// Hidden Bearish
// Osc: Higher High

oscHH = osc[lbR] > ta.valuewhen(phFound, osc[lbR], 1) and _inRange(phFound[1])

// Price: Lower High

priceLH = high[lbR] < ta.valuewhen(phFound, high[lbR], 1)

hiddenBearCond = plotHiddenBear and priceLH and oscHH and phFound
// strategy.entry("히든 하락 다이버전스 진입", strategy.short, when = hiddenBearCond)
// strategy.close("히든 하락 다이버전스 진입", when = ta.crossunder(osc, 50))
plot(
	 phFound ? osc[lbR] : na,
	 offset=-lbR,
	 title="Hidden Bearish",
	 linewidth=2,
	 color=(hiddenBearCond ? hiddenBearColor : noneColor)
	 )

plotshape(
	 hiddenBearCond ? osc[lbR] : na,
	 offset=-lbR,
	 title="Hidden Bearish Label",
	 text=" H Bear ",
	 style=shape.labeldown,
	 location=location.absolute,
	 color=bearColor,
	 textcolor=textColor
	 )
- Stratégie dynamique de soutien et de résistance à la CCI
- Stratégie de négociation sur le momentum de QQE
- Stratégie de prévision des ondes de Gauss
- Stratégie quantitative de combinaison des EMA dynamiques mobiles
- La tendance du canal de Donchian à la suite d'une stratégie
- Stratégie du ruban de l'EMA
- Stratégie croisée précise d'inversion de tendance de la moyenne mobile
- Stratégie de tendance haussière multi-EMA
- Stratégie de négociation saisonnière hybride du S&P500
- Stratégie de suivi des tendances basée sur les écarts
- Stratégie d'arbre de décision à indicateurs multiples: IMACD, EMA et Ichimoku
- Stratégie de négociation de la double optimisation MACD
- Stratégie à double croix d'or de l'EMA
- Stratégie de négociation de l'indice de résistance à la hausse sur plusieurs délais et moyenne mobile
- Stratégie de négociation hebdomadaire
- Stratégie de négociation MACD basée sur EVWMA
- Stratégie d'inversion moyenne des bandes de Bollinger pour la rupture du canal
- Stratégie quantitative de suivi des tendances basée sur plusieurs indicateurs techniques
- Stratégie de négociation quantitative combinée RSI et CCI
- Stratégie de négociation de tendance en DCA à faible risque