Stratégie de double écart Bitcoin et or
Auteur:ChaoZhang est là., Date: 2024-01-23 15h28 et 56 minLes étiquettes:

Résumé
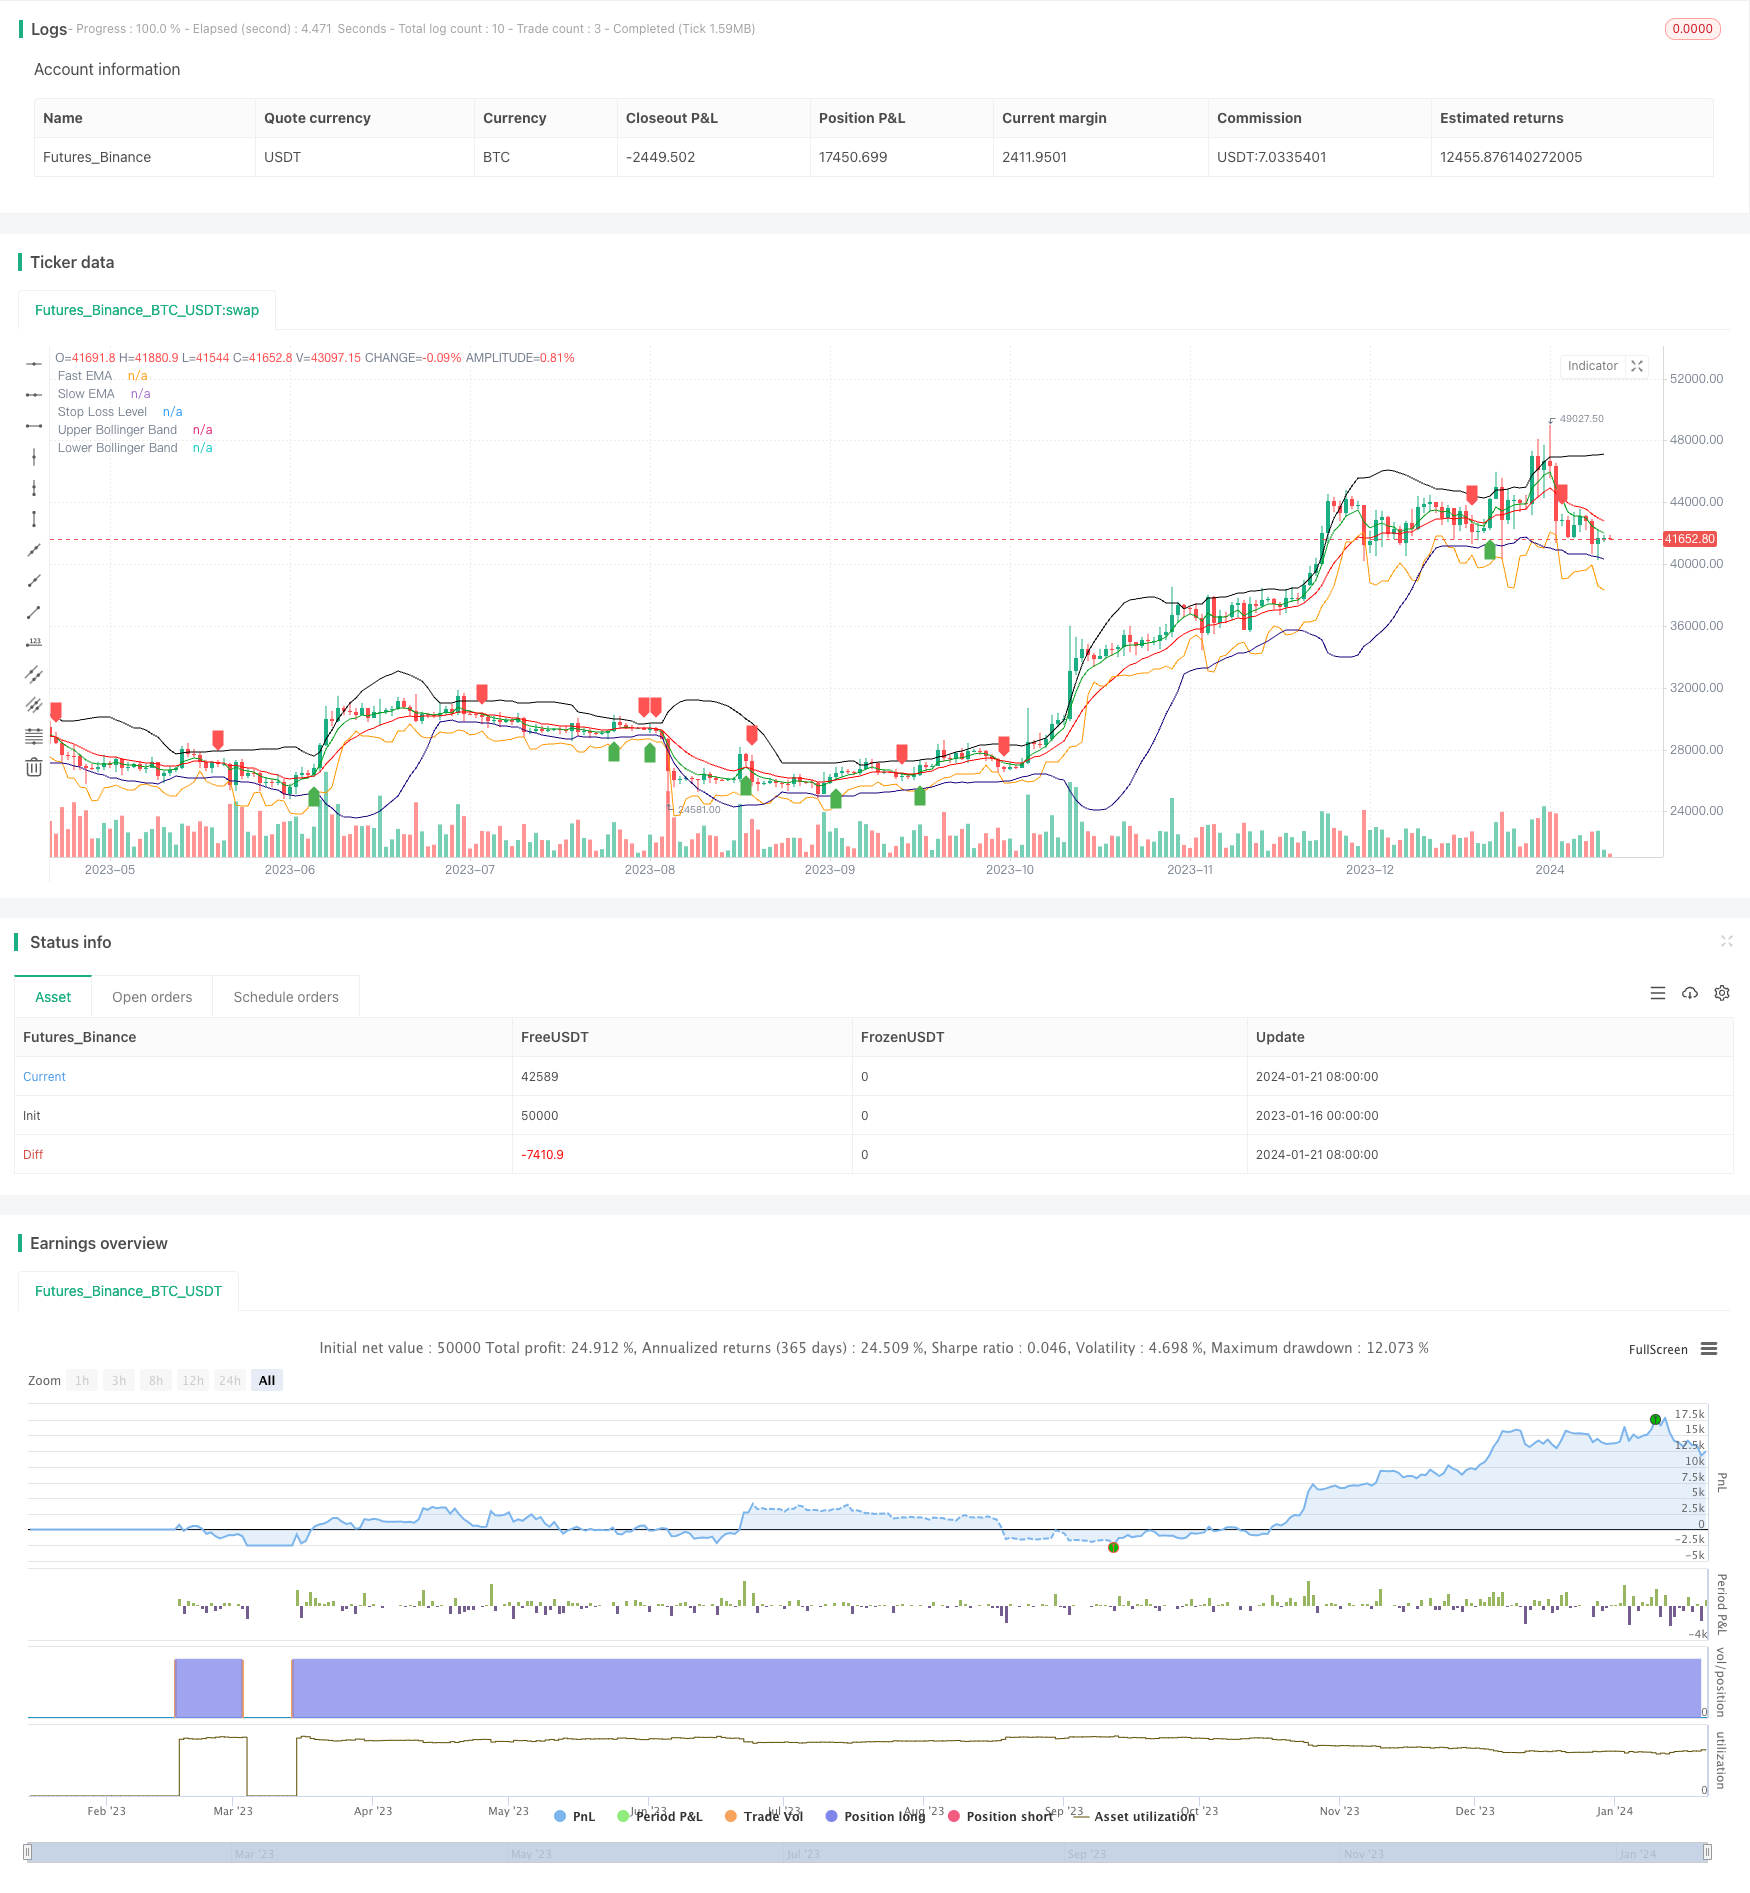
La stratégie Double Gap est une stratégie quantitative utilisée pour le trading à court terme de Bitcoin et d'or. Elle combine des moyennes mobiles, des bandes de Bollinger et des arrêts ATR pour identifier les signaux de rupture et gérer les risques.
La logique de la stratégie
La stratégie Double Gap utilise une EMA rapide et des croisements de EMA lents pour déterminer la direction de la tendance. Un signal d'achat est généré lorsque l'EMA rapide traverse au-dessus de l'EMA lente, et un signal de vente est généré lorsque l'EMA rapide traverse au-dessous de l'EMA lente.
En particulier, pour déterminer un signal d'achat, les deux conditions suivantes doivent être remplies: 1) L'EMA rapide traverse au-dessus de l'EMA lente; 2) Le prix de clôture est proche ou en dessous des bandes de Bollinger supérieures ou moyennes.
En outre, la stratégie Double Gap utilise l'indicateur ATR pour calculer un stop loss dynamique afin de contrôler le risque de chaque transaction.
Les avantages
- Identifie les événements à forte probabilité à l'aide de deux filtres
- Le croisement rapide de la EMA juge la tendance principale, les bandes de Bollinger filtrent les fausses ruptures
- L'arrêt ATR dynamique permet de contrôler efficacement les risques commerciaux uniques
- Convient à la négociation à court terme de produits à forte volatilité tels que le BTC
Les risques
- Les paramètres EMA rapides et lents inappropriés peuvent produire des faux signaux excessifs
- Les paramètres inappropriés des bandes de Bollinger réduiront également considérablement l'efficacité du filtre.
- Le stop-loss trop serré augmente la probabilité qu'il soit déclenché
- Nécessité d'une fréquence de négociation élevée, non adaptée aux petits comptes
Optimisation
La stratégie Double Gap peut être optimisée par les aspects suivants:
- Optimiser les paramètres des moyennes mobiles pour trouver les meilleures combinaisons d'EMA rapides et lents
- Optimiser les paramètres des bandes de Bollinger pour réduire les taux de faux écarts
- Ajuster le multiplicateur d'arrêt ATR en fonction des différents produits et régimes du marché
- Ajoutez le signal de rentrée après l'arrêt.
- Combinez avec d'autres indicateurs tels que RSI, KD, etc. comme confirmation
Conclusion
La stratégie Double Gap identifie efficacement les opportunités à court terme en utilisant à la fois le suivi des tendances et le filtrage des ruptures.
/*backtest
start: 2023-01-16 00:00:00
end: 2024-01-22 00:00:00
period: 1d
basePeriod: 1h
exchanges: [{"eid":"Futures_Binance","currency":"BTC_USDT"}]
*/

// This source code is subject to the terms of the Mozilla Public License 2.0 at https://mozilla.org/MPL/2.0/
// © singhak8757

//@version=5
strategy("Bitcoin and Gold 5min Scalping Strategy2.0", overlay=true)


// Input parameters
fastLength = input(5, title="Fast EMA Length")
slowLength = input(13, title="Slow EMA Length")
bollingerLength = input(20, title="Bollinger Band Length")
bollingerMultiplier = input(2, title="Bollinger Band Multiplier")
stopLossMultiplier = input(1, title="Stop Loss Multiplier")

// Calculate EMAs
fastEMA = ta.ema(close, fastLength)
slowEMA = ta.ema(close, slowLength)

// Calculate Bollinger Bands
basis = ta.sma(close, bollingerLength)
upperBand = basis + bollingerMultiplier * ta.stdev(close, bollingerLength)
lowerBand = basis - bollingerMultiplier * ta.stdev(close, bollingerLength)

// Buy condition
buyCondition = ta.crossover(fastEMA, slowEMA) and (close <= upperBand or close <= basis)

// Sell condition
sellCondition = ta.crossunder(fastEMA, slowEMA) and (close >= lowerBand or close >= basis)

// Calculate stop loss level
stopLossLevel = ta.lowest(low, 2)[1] - stopLossMultiplier * ta.atr(14)

// Plot EMAs
plot(fastEMA, color=color.rgb(0, 156, 21), title="Fast EMA")
plot(slowEMA, color=color.rgb(255, 0, 0), title="Slow EMA")

// Plot Bollinger Bands
plot(upperBand, color=color.new(#000000, 0), title="Upper Bollinger Band")
plot(lowerBand, color=color.new(#1b007e, 0), title="Lower Bollinger Band")

// Plot Buy and Sell signals
plotshape(series=buyCondition, title="Buy Signal", color=color.green, style=shape.labelup, location=location.belowbar)
plotshape(series=sellCondition, title="Sell Signal", color=color.red, style=shape.labeldown, location=location.abovebar)

// Plot Stop Loss level
plot(stopLossLevel, color=color.orange, title="Stop Loss Level")

// Strategy logic
strategy.entry("Buy", strategy.long, when = buyCondition)
strategy.exit("Stop Loss/Close", from_entry="Buy", loss=stopLossLevel)
strategy.close("Sell", when = sellCondition)
- RSI CCI Williams%R Stratégie de négociation quantitative
- Stratégie de négociation dynamique ajustée au risque et à l'élan
- Stratégie de négociation croisée de la moyenne mobile de l'élan
- Stratégie de créateur de marché à bande de Bollinger
- Stratégie Renko pour la moyenne mobile à long terme
- La surveillance de la mise en ligne de nouveaux échanges
- Stratégie de négociation Renko pour suivre les tendances dans les deux sens
- Stratégie combinée de ligne de réponse à impulsion à moyenne mobile et à impulsion infinie
- Stratégie de suivi des super tendances
- Stratégie de négociation de renversement de tendance multi-indicateur
- Stratégie de croisement MACD et RSI
- Stratégie de reprise de l' élan
- Stratégie de croisement des moyennes mobiles
- Stratégie de grille de profit avec oscillation
- Stratégie de percée d'oscillation basée sur la moyenne mobile
- Stratégie de négociation à court terme pour la reconnaissance des schémas ZigZag
- Stratégie de suivi de la volatilité et de la tendance à travers les délais basée sur Williams VIX et DEMA
- Stratégie de rupture de l'élan basée sur le jugement du cycle avec des moyennes mobiles
- Indice des flux monétaires 5 minutes de stratégie à travers le temps et l'espace
- Stratégie de négociation à double EMA