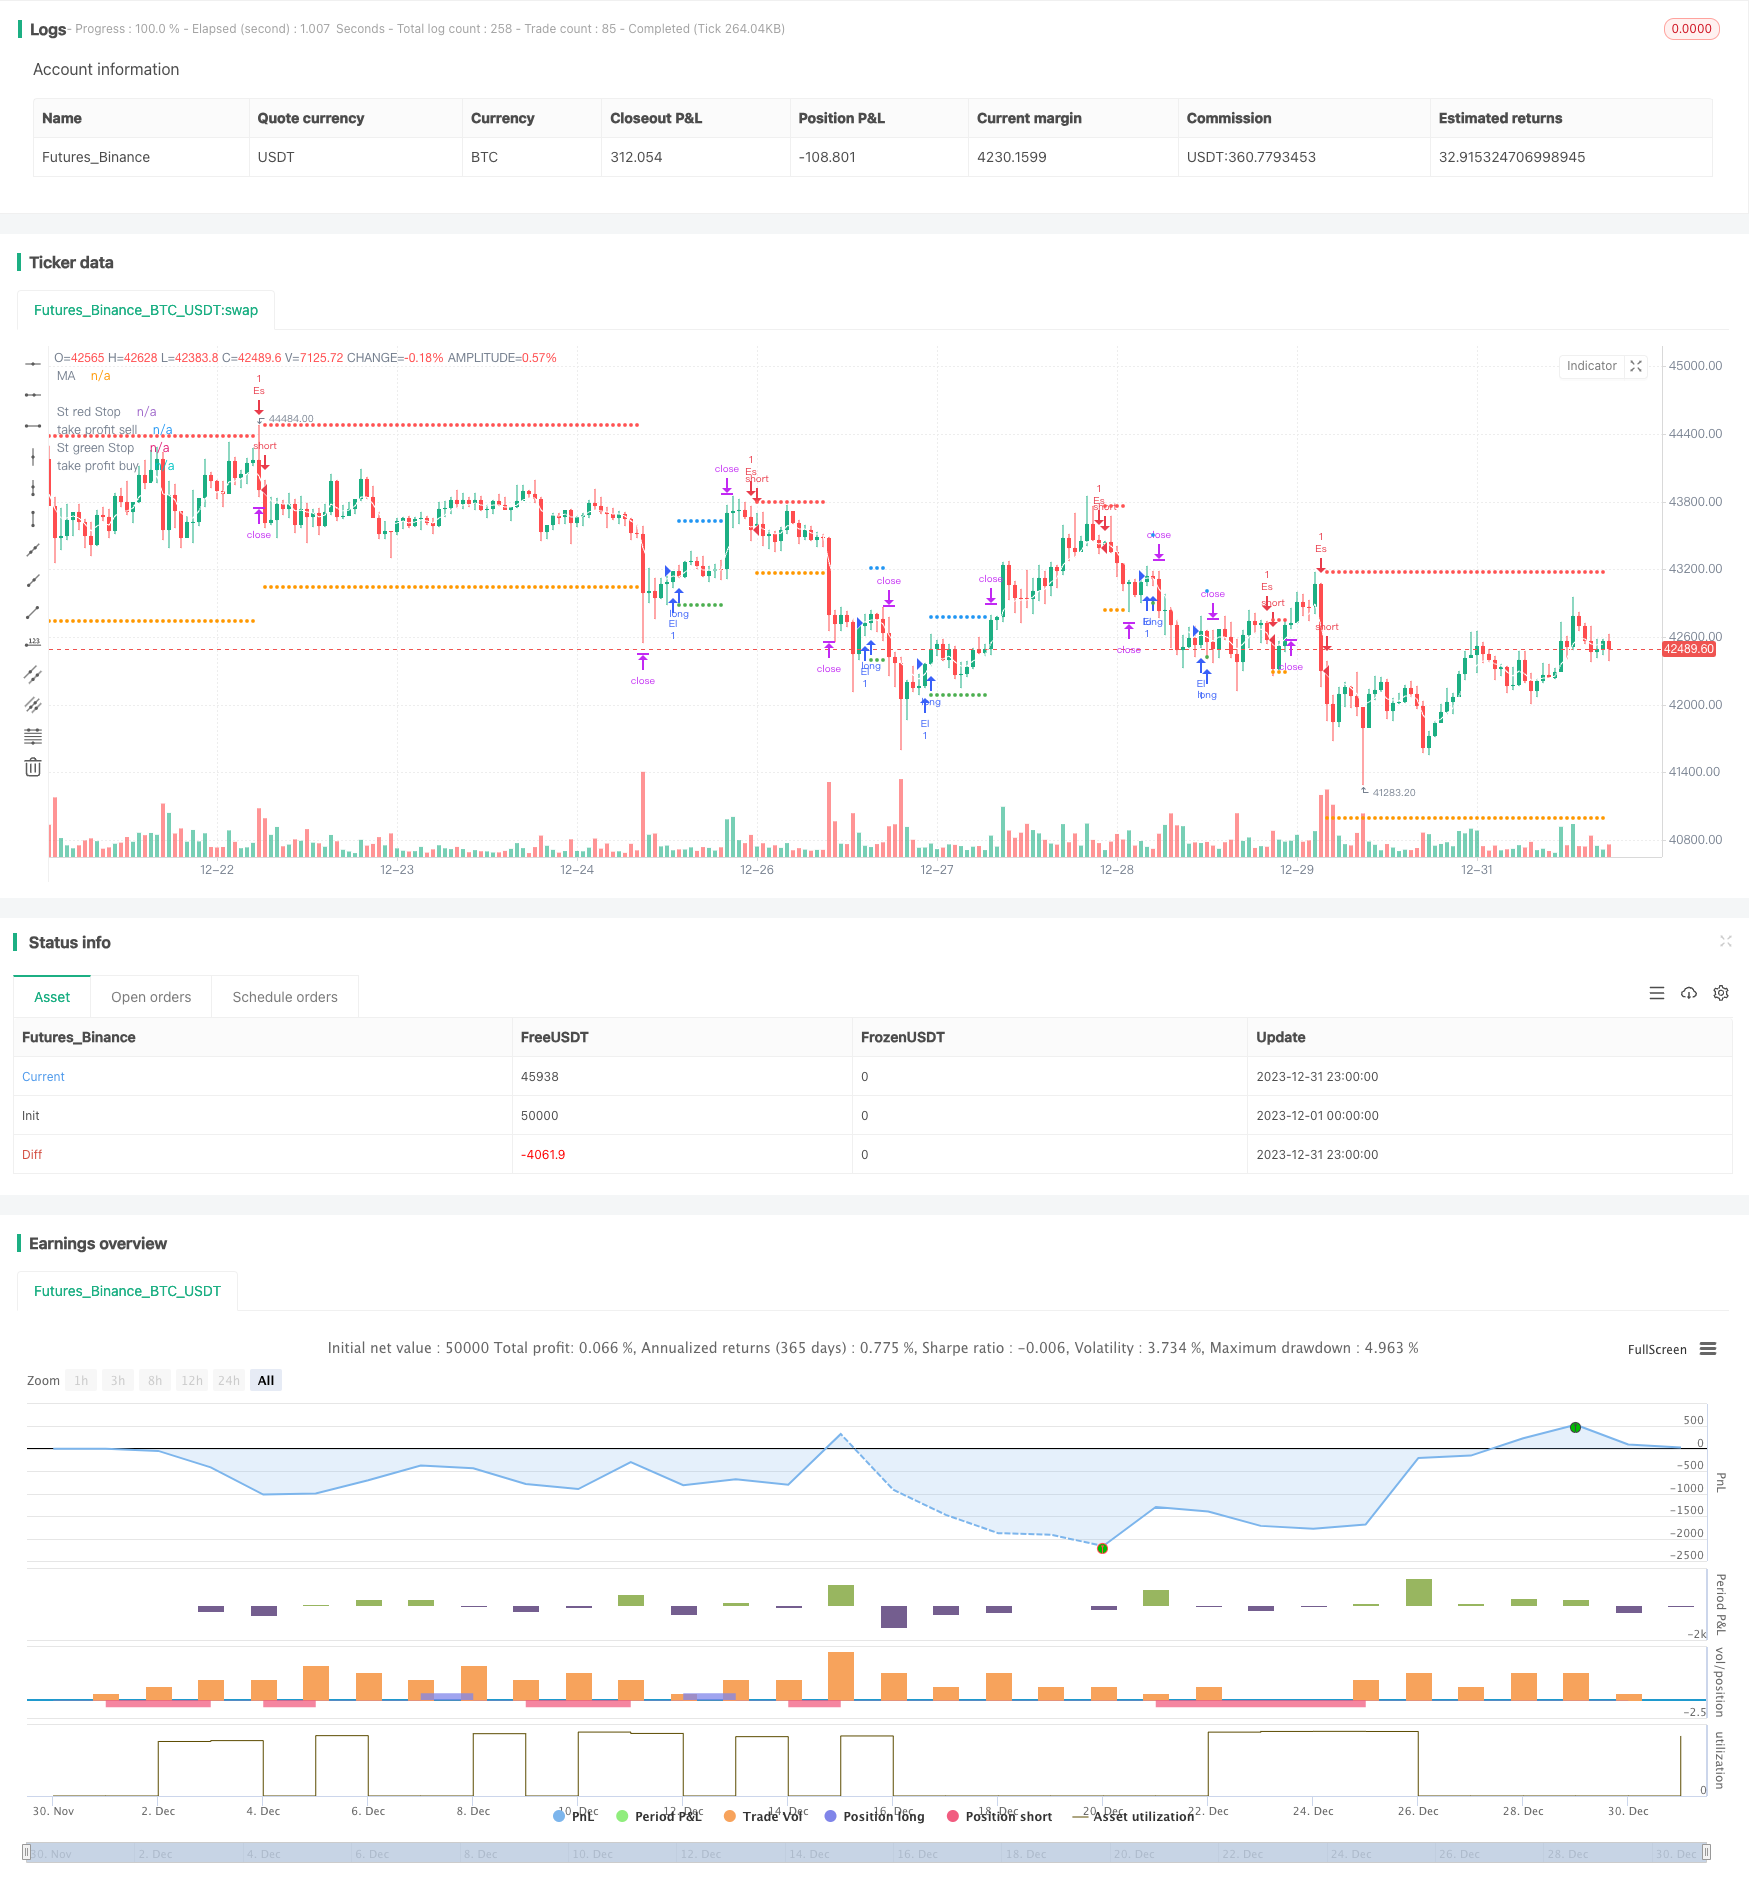
Stratégie 5EMA pour l'inversion de la percée à court terme transfrontalière
Auteur:ChaoZhang est là., Date: 2024-01-30 15h30 et 19hLes étiquettes:

Cet article présentera une stratégie de trading d'inversion à court terme basée sur l'indicateur 5EMA.
Vue d'ensemble de la stratégie
Il s'agit d'une stratégie quantitative à court terme, principalement utilisée pour le trading à haute fréquence. La stratégie jugera simultanément les signaux haussiers et baissiers et peut être négociée dans les deux sens. Les signaux de trading sont générés lorsque les prix franchissent l'indicateur 5EMA et des positions longues ou courtes sont entrées en fonction de la direction de la percée.
L'avantage de la stratégie est de saisir les opportunités d'inversion de prix à court terme et d'entrer rapidement sur le marché. Le risque principal provient des pertes causées par de fausses ruptures. Le risque peut être réduit en optimisant les paramètres.
Principe de stratégie
-
Utiliser l'indicateur EMA à 5 périodes pour déterminer l'évolution des prix à court terme
-
Jugez si le prix dépasse l'indicateur EMA
-
Lorsque le prix traverse l'EMA de haut en bas, un signal de vente est généré.
-
Lorsque le prix franchit l'EMA de bas en haut, un signal d'achat est généré.
-
Définir un stop loss et un profit pour limiter les pertes uniques
Comme l'indicateur EMA peut déterminer efficacement les tendances à court terme, il peut rapidement saisir les opportunités de négociation lorsque les prix montrent des renversements significatifs.
Les avantages de la stratégie
- Réponse rapide, adaptée à la capture à haute fréquence des opportunités de négociation à court terme
- Les échanges bidirectionnels peuvent être à la fois longs et courts.
- Résultats de l'analyse de risque
- Des paramètres simples, des stratégies faciles à optimiser
Risques et solutions des stratégies
- Résultats de l'analyse de risque
- Optimiser les paramètres du cycle EMA pour assurer la stabilité de l'indicateur
- Une fréquence de trading excessive peut facilement entraîner des hauts et des bas.
- Limiter le nombre maximal de transactions par jour
Optimisation des stratégies
- Optimiser les paramètres de l'indicateur EMA pour trouver le meilleur portefeuille de cycle
- Augmenter le filtre pour réduire la probabilité de fausse rupture
- Limiter le nombre maximal de transactions par jour
- Combiner d'autres indicateurs pour déterminer la direction de la tendance
Résumé
En général, il s'agit d'une stratégie de rupture à court terme très pratique. L'utilisation d'indicateurs EMA pour déterminer les renversements de prix est très simple et efficace, et un outil important pour le trading quantitatif.
/*backtest
start: 2023-12-01 00:00:00
end: 2023-12-31 23:59:59
period: 1h
basePeriod: 15m
exchanges: [{"eid":"Futures_Binance","currency":"BTC_USDT"}]
*/

// This Pine Script™ code is subject to the terms of the Mozilla Public License 2.0 at https://mozilla.org/MPL/2.0/
// © samscripter

//@version=5
strategy("5 ema strategy",overlay = true,process_orders_on_close = true)

// Choose trade direction

t_dir = input.string("Both", title="Trade Direction",options=["Long", "Short", "Both"],group = 'Trade Direction Set')

long_side  = t_dir == "Long" or t_dir == "Both"
short_side = t_dir == "Short" or t_dir == "Both"

// number of trade
mx_num =input.int(4,title = 'number Of trade',group = 'Maximum Number Of Trade')
var hi =0.0
var lo =0.0

var group_ma1="Ema Set"

//Ema 1
on_ma=input.bool(true,"Enable EMa 1 Plot On/Off"  ,group =group_ma1)
ma_len= input.int(5, minval=1, title="Ema Length",group =group_ma1)
ma_src = input.source(close, title="Ema Source"   ,group = group_ma1)
ma_out = ta.ema(ma_src, ma_len)

// buy and sell ema condition
plot(on_ma?ma_out:na, color=color.white, title="MA")


if close>ma_out and open>ma_out and low>ma_out and high>ma_out
    lo:=low

if close<ma_out and open<ma_out and low<ma_out and high<ma_out
    hi:=high

// condition when price is crossunder lo take sell and when price crossoing hi take buy
var buyp_sl =float(na)
var sellp_sl =float(na)

//count number trade since day stra
var count_buysell=0

if  close>hi[1]
    if strategy.position_size==0 and count_buysell<mx_num and long_side
        strategy.entry('El',strategy.long,comment = 'Long')
        count_buysell:=count_buysell+1
        buyp_sl:=math.min(low,low[1])
    hi:=na
if  close<lo[1]
    if strategy.position_size==0 and count_buysell<mx_num and short_side
        strategy.entry('Es',strategy.short,comment = 'short')
        count_buysell:=count_buysell+1
        sellp_sl:=math.max(high,high[1])
    lo:=na

//take profit multiply

tpnew = input.float(title="take profit", step=0.1, defval=1.5, group='Tp/SL')


//stop loss previous candle high and previous candle low
buy_sl = ta.valuewhen(strategy.position_size != 0 and strategy.position_size[1] == 0,buyp_sl , 0)
sell_sl= ta.valuewhen(strategy.position_size != 0 and strategy.position_size[1] == 0,sellp_sl, 0)

//take profit
takeProfit_buy = strategy.position_avg_price - ((buy_sl - strategy.position_avg_price) *tpnew)
takeProfit_sell = strategy.position_avg_price - ((sell_sl - strategy.position_avg_price) *tpnew)


//  Submit exit orders
if strategy.position_size > 0
    strategy.exit(id='XL', stop=buy_sl,limit=takeProfit_buy,comment_loss = 'Long Sl',comment_profit = 'Long Tp')

if strategy.position_size < 0
    strategy.exit(id='XS', stop=sell_sl,limit=takeProfit_sell,comment_loss = 'Short Sl',comment_profit = 'Short Tp')

//plot data
plot(series=strategy.position_size < 0 ?sell_sl : na, style=plot.style_circles, color=color.red, linewidth=2, title="St red Stop")
plot(series=strategy.position_size > 0 ?buy_sl  : na, style=plot.style_circles, color=color.green, linewidth=2, title="St green Stop")


// plot take profit
plot(series=strategy.position_size < 0 ? takeProfit_sell : na, style=plot.style_circles, color=color.orange, linewidth=2, title="take profit sell")
plot(series=strategy.position_size > 0 ? takeProfit_buy: na, style=plot.style_circles, color=color.blue, linewidth=2, title="take profit buy")

if ta.change(time('D'))
    count_buysell:=0
- Stratégie de croisement des moyennes mobiles à bande de Bollinger
- Scalping Dips dans la stratégie du marché haussier
- Tendance suivant une stratégie basée sur une moyenne mobile adaptative
- Stratégie de moyenne mobile relative réelle
- Stratégie de négociation à 5 minutes basée sur le MACD et le RSI
- Stratégie de rupture fractale double
- Noro a modifié sa stratégie de stop loss.
- Stratégie de négociation du RSI à moyenne mobile exponentielle double
- Stratégie de croisement de moyenne mobile simple
- Stratégie de scalping basée sur la liquidité et la tendance du marché
- Stratégie de pyramide de négociation d'actions basée sur l'indicateur RSI
- Tout sur la stratégie de négociation des canaux de l'EMA
- Stratégie de négociation RSI à deux étages
- Les bandes de Bollinger et la stratégie de combinaison RSI
- Stratégie de double barre intérieure et tendance
- Une stratégie étonnante de rupture de prix
- Stratégie de poursuite de la tendance solide
- Stratégie de suivi des tendances pour les moyennes mobiles
- Modèle d'inversion de la rupture basé sur la stratégie de négociation de la tortue
- Stratégie de tendance à la dynamique