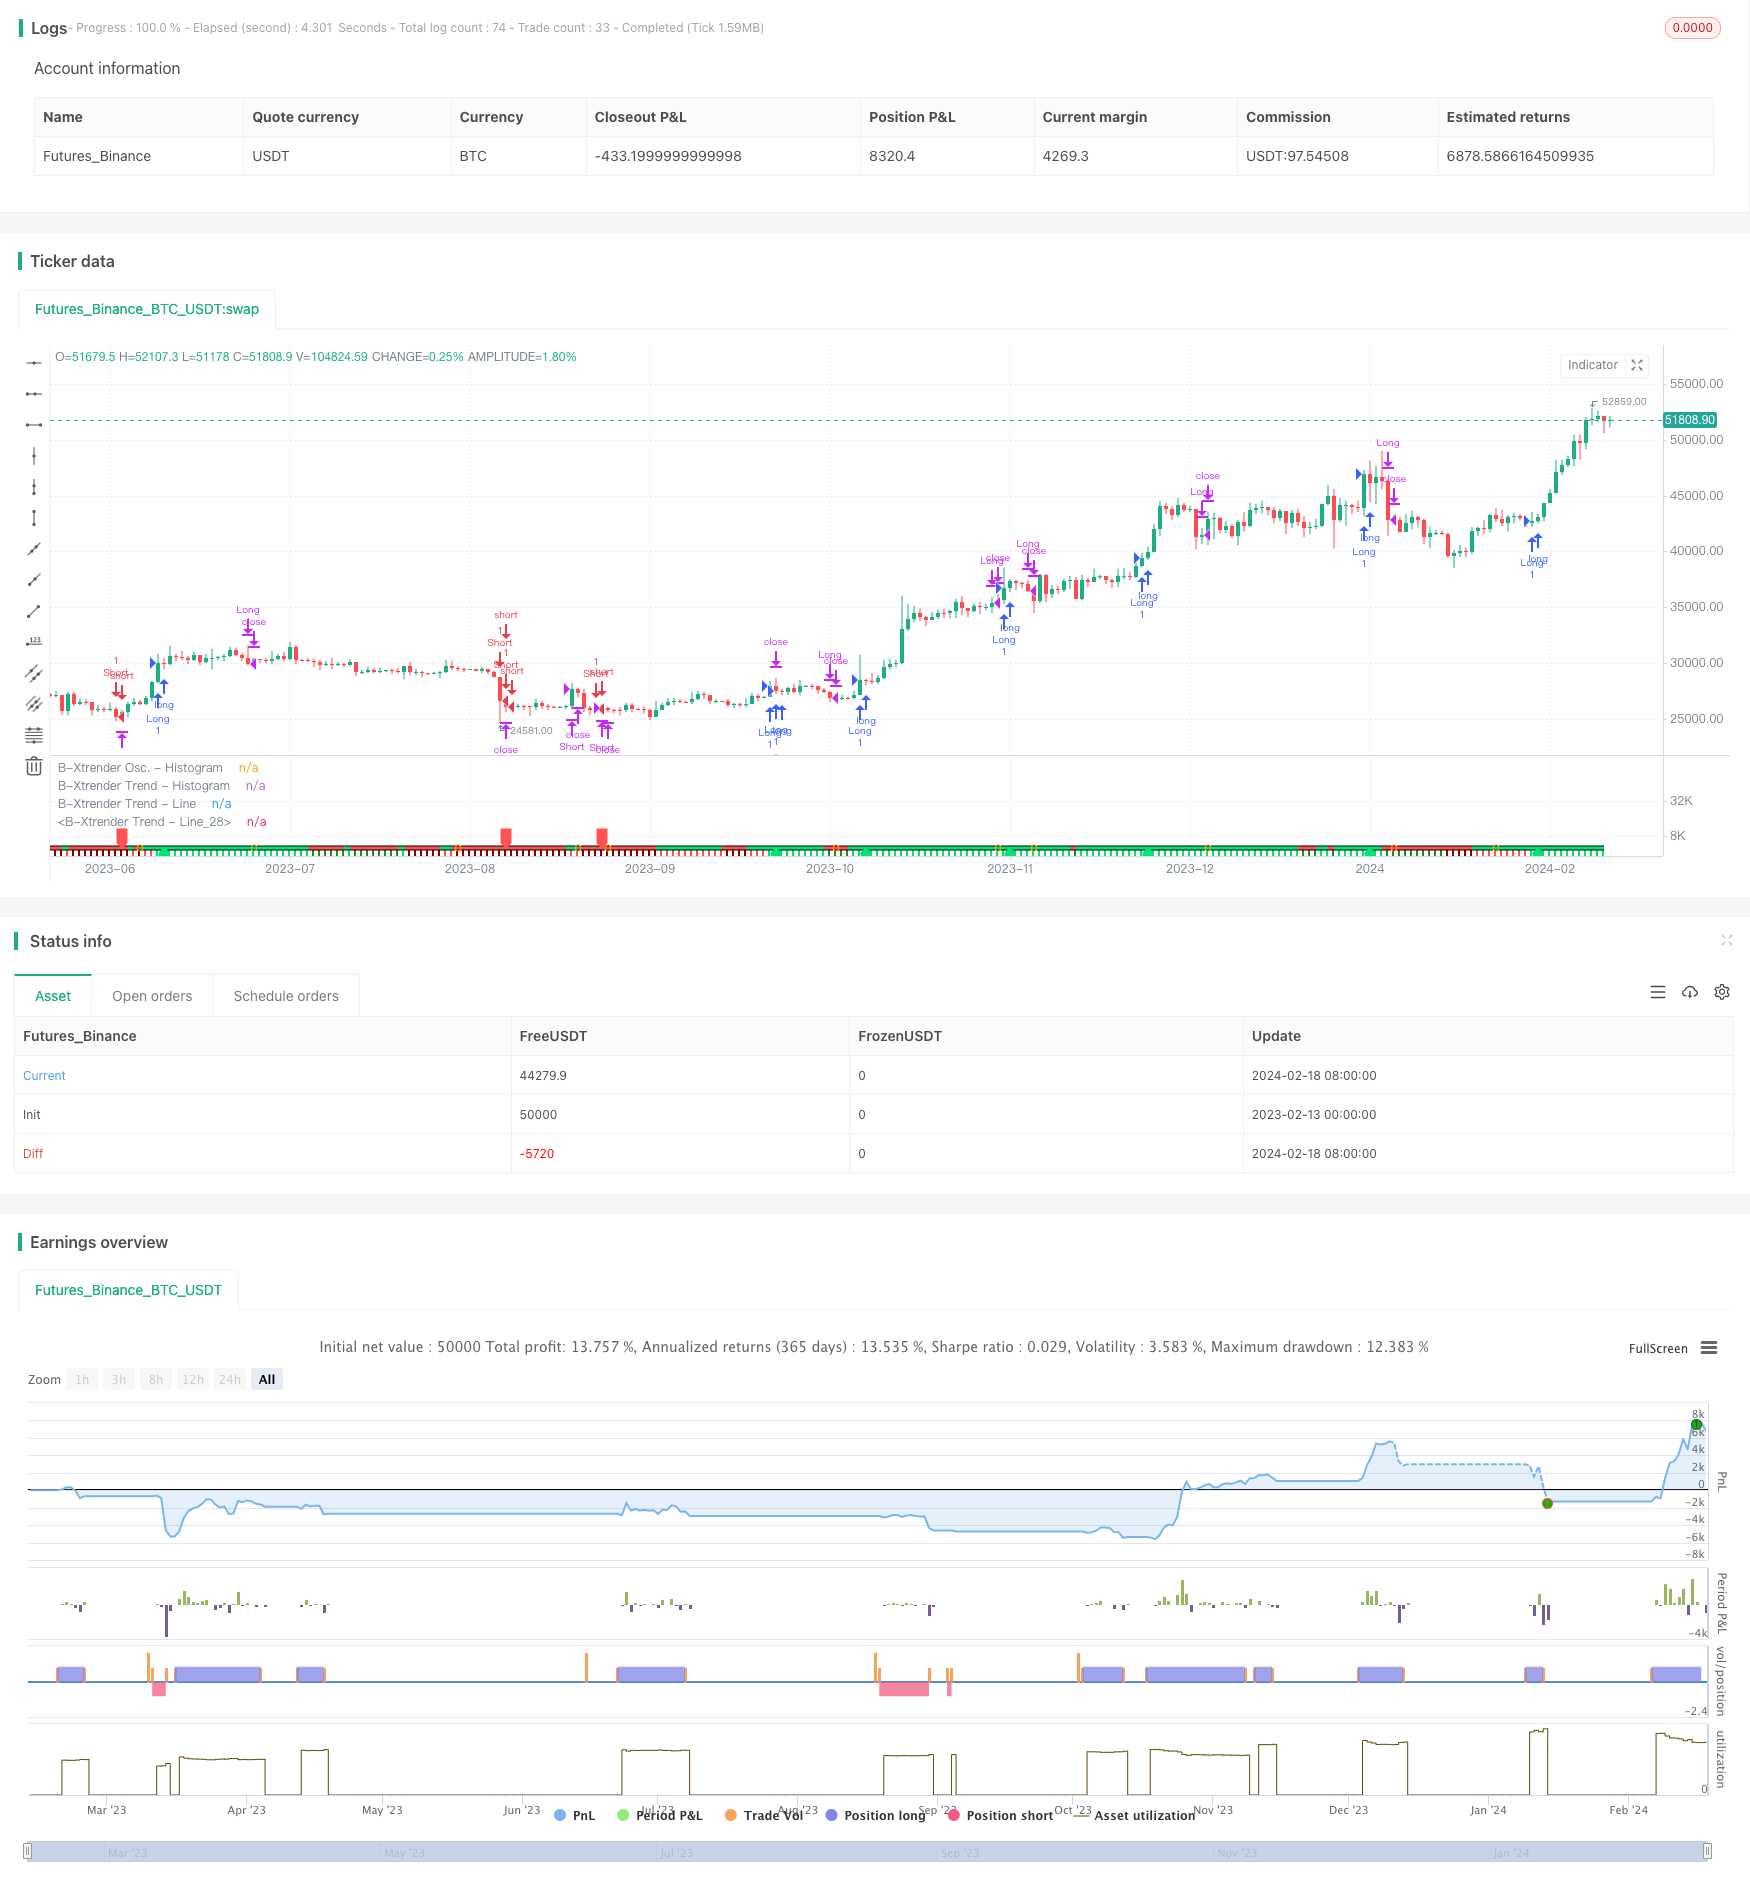
Stratégie B-Xtrender de croisement de moyenne mobile exponentielle
Date de création:
2024-02-20 14:45:17
Dernière modification:
2024-02-20 14:45:17
Copier:
0
Nombre de clics:
1697
1
Suivre
1629
Abonnés

Aperçu
Cette stratégie est une stratégie de trading basée sur le principe de la croisée des lignes des indices. Elle combine à la fois l’indicateur RSI et le filtre des lignes des indices, pour former un système de suivi des tendances et de retournement de tendance plus complet.
Principe de stratégie
- Les signaux de négociation sont formés par des croisements rapides et lents des moyennes mobiles des indices. Les paramètres des lignes rapides sont les croisements EMA des lignes 5 et 20 et les paramètres des lignes lentes sont les croisements EMA des lignes 20 et 15.
- Il y a une double vérification avec l’indicateur RSI, qui confirme l’efficacité du signal de négociation uniquement si le RSI est également en croisement.
- L’ajout d’une moyenne mobile à 200 jours comme filtre permet d’émettre un signal de transaction uniquement lorsque le prix dépasse cette moyenne, évitant ainsi de multiples faux-crossings dans des conditions de choc.
Avantages stratégiques
- Le croisement des deux EMA avec l’indicateur RSI améliore considérablement la fiabilité du signal et réduit le taux de faux signaux.
- La combinaison des paramètres EMA rapide et lent prend en compte la sensibilité du signal de transaction et assure la stabilité du signal.
- L’ajout d’un filtre homogène permet de filtrer efficacement le bruit des vibrations et d’éviter les transactions inutiles.
Risque stratégique
- L’EMA est un indicateur de décalage, qui se traduit par un décalage significatif lorsque les prix évoluent fortement, ce qui entraîne un risque d’augmentation des pertes ou de signal manqué.
- Une mauvaise configuration des paramètres RSI peut également entraîner un retard de signal.
- Le filtrage linéaire permet d’éviter les chocs, mais peut également filtrer les opportunités d’entrée précoce au début d’une tendance.
Orientation de l’optimisation de la stratégie
- Adaptez dynamiquement les paramètres EMA, en choisissant la combinaison optimale de paramètres à différents cycles.
- Essayez de combiner le RSI avec d’autres indicateurs comme le MACD.
- Optimiser les paramètres de filtrage homogène pour trouver un équilibre entre la réduction du bruit et l’accès aux opportunités.
Résumer
Cette stratégie est généralement un système de trading d’indices mobiles plus complet. Elle est basée sur l’obtention de signaux de négociation, avec l’introduction d’un indicateur RSI supplémentaire pour une vérification à plusieurs niveaux. Cela peut sans aucun doute améliorer considérablement la qualité du signal, une stratégie qui vaut la peine d’être apprise et optimisée.
Code source de la stratégie
/*backtest
start: 2023-02-13 00:00:00
end: 2024-02-19 00:00:00
period: 1d
basePeriod: 1h
exchanges: [{"eid":"Futures_Binance","currency":"BTC_USDT"}]
*/

// This source code is subject to the terms of the Mozilla Public License 2.0 at https://mozilla.org/MPL/2.0/
// © QuantTherapy
//@version=4
strategy("B-Xtrender [Backtest Edition] @QuantTherapy")

i_short_l1  = input(5 , title="[Short] L1")
i_short_l2  = input(20, title="[Short] L2")
i_short_l3  = input(15, title="[Short] L3")

i_long_l1   = input(20, title="[Long] L1")
i_long_l2   = input(15, title="[Long] L2")

i_ma_use    = input(true , title="[MA Filter] Yes/No" )
i_ma_len    = input(200  , title="[MA Filter] length" )
i_ma_type   = input("EMA", title="[MA Filter] type", options = ["SMA", "EMA"])

shortTermXtrender = rsi( ema(close, i_short_l1) - ema(close, i_short_l2), i_short_l3 ) - 50
longTermXtrender  = rsi( ema(close, i_long_l1), i_long_l2 ) - 50

shortXtrenderCol = shortTermXtrender > 0 ? shortTermXtrender > shortTermXtrender[1] ? color.lime : #228B22 : shortTermXtrender > shortTermXtrender[1] ? color.red : #8B0000
plot(shortTermXtrender, color=shortXtrenderCol, style=plot.style_columns, linewidth=1, title="B-Xtrender Osc. - Histogram", transp = 40)

longXtrenderCol   = longTermXtrender> 0 ? longTermXtrender > longTermXtrender[1] ? color.lime : #228B22 : longTermXtrender > longTermXtrender[1] ? color.red : #8B0000
macollongXtrenderCol =  longTermXtrender > longTermXtrender[1] ? color.lime : color.red
plot(longTermXtrender , color=longXtrenderCol, style=plot.style_columns, linewidth=2, title="B-Xtrender Trend - Histogram", transp = 90)

plot(longTermXtrender , color=#000000             , style=plot.style_line, linewidth=5, title="B-Xtrender Trend - Line", transp = 100)
plot(longTermXtrender , color=macollongXtrenderCol, style=plot.style_line, linewidth=3, title="B-Xtrender Trend - Line", transp = 100)

// --- Initialize MA Filter
ma = i_ma_type == "EMA" ? ema(close, i_ma_len) : sma(close, i_ma_len)
maFilterLong = true
maFilterShort = true
if i_ma_use
    maFilterLong  := close > ma ? true : false
    maFilterShort := close < ma ? true : false

long  = shortTermXtrender > 0 and longTermXtrender > 0 and maFilterLong
closeLong = shortTermXtrender < 0 or longTermXtrender < 0
short = shortTermXtrender < 0 and longTermXtrender < 0 and maFilterShort
closeShort = shortTermXtrender > 0 or longTermXtrender > 0

plotshape(long[1]==true  and long[2]==false  ? 0 : na , location=location.absolute, style=shape.labelup  , color=color.lime, size=size.small, transp=10)
plotshape(short[1]==true and short[2]==false ? 0 : na, location=location.absolute, style=shape.labeldown, color=color.red , size=size.small, transp=10)
plotshape(closeLong[1]==true and closeLong[2]==false
 or closeShort[1]==true and closeShort[2]==false ? 0 : na, location=location.absolute, style=shape.circle, color=color.orange , size=size.small)

i_perc     = input(defval = 20.0, title = "[TSL-%] Percent"  , minval = 0.1 )
i_src = close // constant for calculation
sl_val = i_src * i_perc / 100

strategy.entry("Long", strategy.long, when = long )
strategy.close("Long", when = closeLong)

strategy.entry("Short", strategy.short, when = short)
strategy.close("Short", when = closeShort)

// Calculate SL
longStopPrice = 0.0, shortStopPrice = 0.0
longStopPrice := if (strategy.position_size > 0)
    stopValue = close - sl_val
    max(stopValue, longStopPrice[1])
else
    0

shortStopPrice := if (strategy.position_size < 0)
    stopValue = close + sl_val
    min(stopValue, shortStopPrice[1])
else
    syminfo.mintick*1000000

// For TSL Visualisation on Chart
// plot(series=(strategy.position_size > 0) ? longStopPrice : na,
//      color=color.fuchsia, style = plot.style_circles,
//      linewidth=1, title="Long Trail Stop")

// plot(series=(strategy.position_size < 0) ? shortStopPrice : na,
//      color=color.fuchsia, style = plot.style_circles,
//      linewidth=1, title="Short Trail Stop")

if (strategy.position_size > 0)
    strategy.exit(id="TSL Long", stop=longStopPrice)

if (strategy.position_size < 0)
    strategy.exit(id="TSL Short", stop=shortStopPrice)