आरएसआई एमटीएफ ओबी+ओ
लेखक:आविष्कारक मात्रा, दिनांकः 2022-05-09 15:35:09टैगःआरएसआई
हैलो व्यापारियों,
यह संकेतक मेरे पिछले संकेतक
यह एक सरल
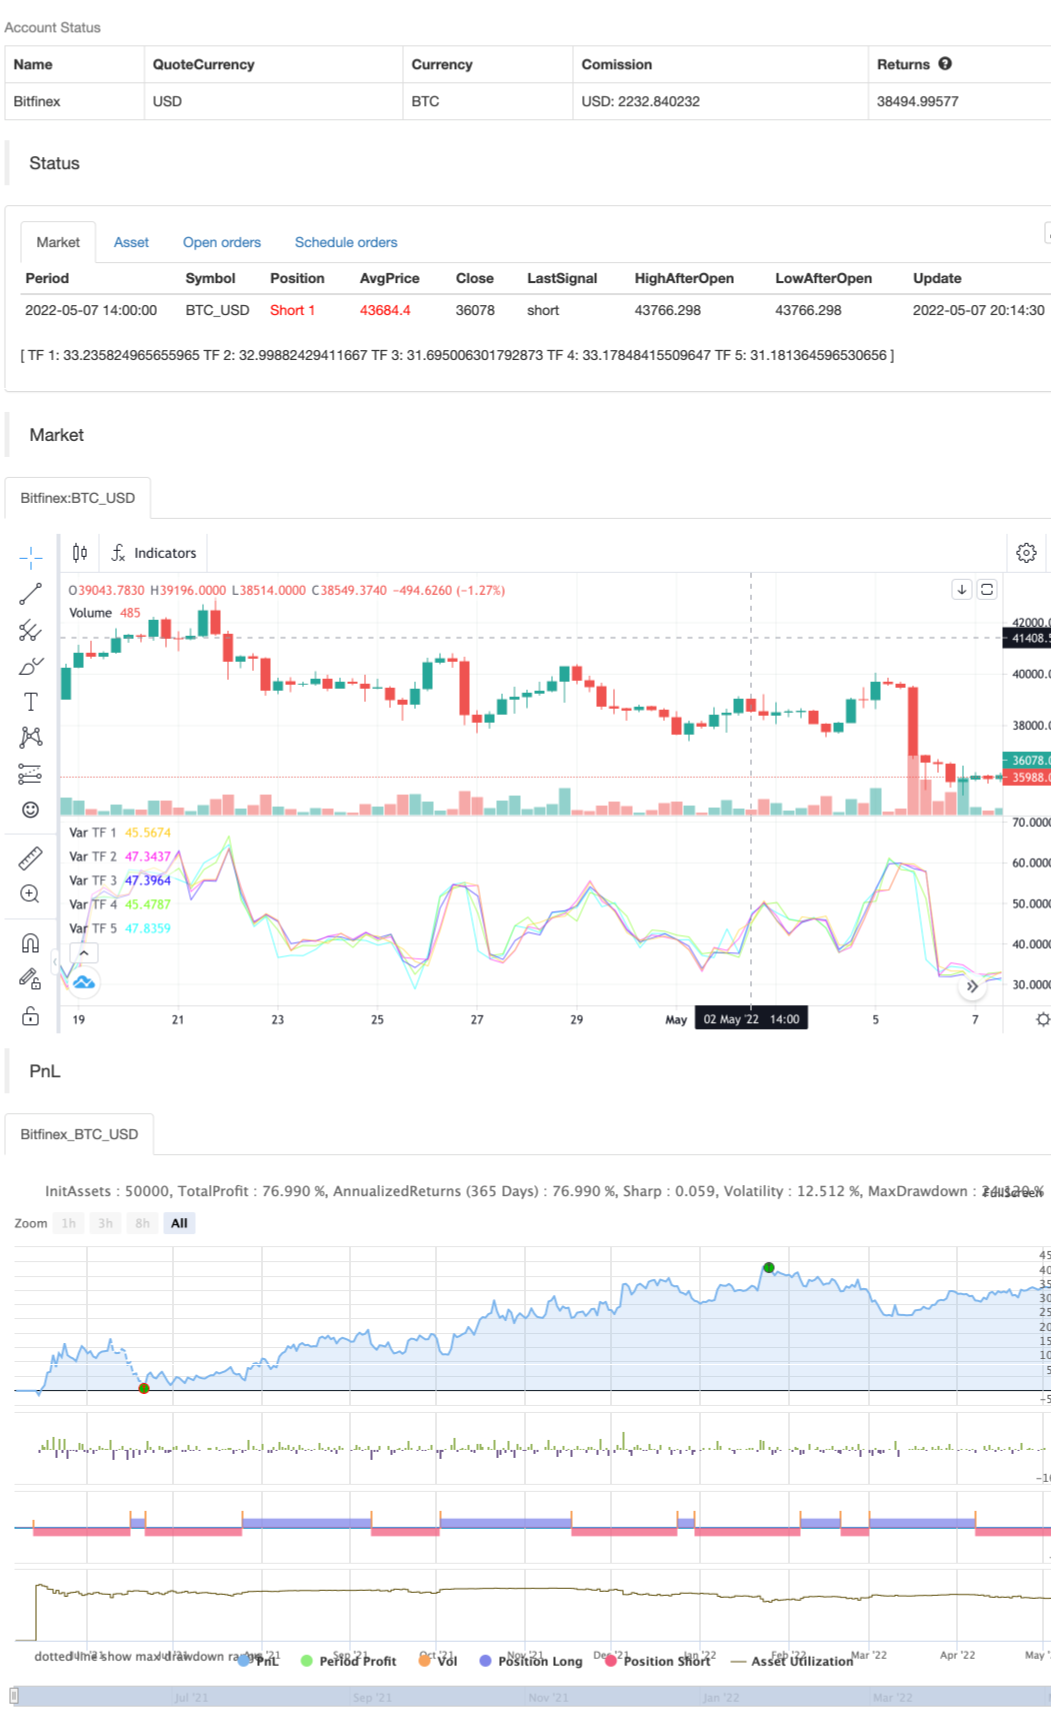
यह 5 समय सीमाओं तक ओवरबॉट और ओवरसोल्ड स्तर का पता लगा सकता है, जो व्यापारियों को संभावित उलट बिंदु को अधिक आसानी से खोजने में मदद करता है।
ओवरबॉट और ओवरसोल्ड का पता लगाने के लिए 1-5 टाइमफ्रेम चुनने के विकल्प हैं।
एक्वा बैकग्राउंड
मज़े करो :)

/*backtest
start: 2021-05-08 00:00:00
end: 2022-05-07 23:59:00
period: 6h
basePeriod: 15m
exchanges: [{"eid":"Bitfinex","currency":"BTC_USD"}]
*/

// This source code is subject to the terms of the Mozilla Public License 2.0 at https://mozilla.org/MPL/2.0/

// © thakon33

//    __  __        __             ____ ____

//   / /_/ /  ___ _/ /_____  ___  |_  /|_  /

//  / __/ _ \/ _ `/  '_/ _ \/ _ \_/_ <_/_ <

//  \__/_//_/\_,_/_/\_\\___/_//_/____/____/


//@version=5

indicator("RSI MTF Ob+Os")


//------------------------------------------------------------------------------

// Input

var g_rsi       = "[ RSI SETTING ]"

rsiSrc          = input    (title="Source",     defval=close,                                group=g_rsi)

rsiLength       = input.int(title="Length",     defval=14,     minval=1,                     group=g_rsi)

rsiOverbought   = input.int(title="Overbought", defval=65,     minval=50, maxval=99, step=1, group=g_rsi)

rsiOversold     = input.int(title="Oversold",   defval=35,     minval=1,  maxval=50, step=1, group=g_rsi)


var g_tf        = "[ SELECT TIMEFRAME ]"

rsiTf1          = input.timeframe(title="Timeframe 1", defval="15",  group=g_tf, inline="tf1")

rsiTf2          = input.timeframe(title="Timeframe 2", defval="30",  group=g_tf, inline="tf2")

rsiTf3          = input.timeframe(title="Timeframe 3", defval="60",  group=g_tf, inline="tf3")

rsiTf4          = input.timeframe(title="Timeframe 4", defval="120", group=g_tf, inline="tf4")

rsiTf5          = input.timeframe(title="Timeframe 5", defval="240", group=g_tf, inline="tf5")

rsiTf1_E        = input.bool(title="", defval=true, group=g_tf, inline="tf1")

rsiTf2_E        = input.bool(title="", defval=true, group=g_tf, inline="tf2")

rsiTf3_E        = input.bool(title="", defval=true, group=g_tf, inline="tf3")

rsiTf4_E        = input.bool(title="", defval=true, group=g_tf, inline="tf4")

rsiTf5_E        = input.bool(title="", defval=true, group=g_tf, inline="tf5")


//------------------------------------------------------------------------------

// Calculate RSI


Fsec(Sym, Tf, Exp) =>

    request.security(Sym, Tf, Exp[barstate.isrealtime ? 1 : 0], barmerge.gaps_off, barmerge.lookahead_off) [barstate.isrealtime ? 0 : 1]


rsi1            = Fsec(syminfo.tickerid, rsiTf1, ta.rsi(rsiSrc, rsiLength))

rsi2            = Fsec(syminfo.tickerid, rsiTf2, ta.rsi(rsiSrc, rsiLength))

rsi3            = Fsec(syminfo.tickerid, rsiTf3, ta.rsi(rsiSrc, rsiLength))

rsi4            = Fsec(syminfo.tickerid, rsiTf4, ta.rsi(rsiSrc, rsiLength))

rsi5            = Fsec(syminfo.tickerid, rsiTf5, ta.rsi(rsiSrc, rsiLength))


//------------------------------------------------------------------------------

// RSI Overbought and Oversold detect


rsi1_Ob         = not rsiTf1_E or rsi1 >= rsiOverbought

rsi2_Ob         = not rsiTf2_E or rsi2 >= rsiOverbought

rsi3_Ob         = not rsiTf3_E or rsi3 >= rsiOverbought

rsi4_Ob         = not rsiTf4_E or rsi4 >= rsiOverbought

rsi5_Ob         = not rsiTf5_E or rsi5 >= rsiOverbought


rsi1_Os         = not rsiTf1_E or rsi1 <= rsiOversold

rsi2_Os         = not rsiTf2_E or rsi2 <= rsiOversold

rsi3_Os         = not rsiTf3_E or rsi3 <= rsiOversold

rsi4_Os         = not rsiTf4_E or rsi4 <= rsiOversold

rsi5_Os         = not rsiTf5_E or rsi5 <= rsiOversold


rsiOb           = rsi1_Ob and rsi2_Ob and rsi3_Ob and rsi4_Ob and rsi5_Ob

rsiOs           = rsi1_Os and rsi2_Os and rsi3_Os and rsi4_Os and rsi5_Os


//------------------------------------------------------------------------------

// Drawing on chart

plot    (rsiTf1_E ? rsi1 : na, title="TF 1",            color=color.rgb(255, 205, 22, 20),                                linewidth=1)

plot    (rsiTf2_E ? rsi2 : na, title="TF 2",            color=color.rgb(255, 22, 239, 20),                                linewidth=1)

plot    (rsiTf3_E ? rsi3 : na, title="TF 3",            color=color.rgb(38, 22, 255, 0),                                  linewidth=1)

plot    (rsiTf4_E ? rsi4 : na, title="TF 4",            color=color.rgb(123, 253, 22, 20),                                linewidth=1)

plot    (rsiTf5_E ? rsi5 : na, title="TF 5",            color=color.rgb(0, 255, 255, 50),                               linewidth=1)


strategy.entry("BUY", strategy.long, when=rsiOb)
strategy.entry("SELL", strategy.short, when=rsiOs)


//==============================================================================

//==============================================================================
संबंधित सामग्री
- द्वि-संकेतक गतिशीलता के रुझानों को मापने के लिए रणनीतिक प्रणाली
- द्वि-समान रेखा-आरएसआई मल्टी सिग्नल ट्रेंड ट्रेडिंग रणनीति
- गतिशील समोच्च प्रणाली के साथ आरएसआई गतिशीलता सूचकांक के साथ दिन के भीतर व्यापार अनुकूलन रणनीति
- बहु तकनीकी संकेतक क्रॉस गतिशीलता ट्रेंड ट्रैकिंग रणनीति
- डायनेमिक समायोजन स्टॉप लॉस हाथी के स्तंभ के आकार की ट्रेंड ट्रैकिंग रणनीति
- द्विचक्रीय आरएसआई ट्रेंड गतिशीलता की तीव्रता रणनीति पिरामिड स्थिति प्रबंधन प्रणाली के साथ संयुक्त
- बहु-समान रेखा पार सहायक आरएसआई गतिशील पैरामीटर परिमाणित व्यापार रणनीति
- गतिशील रुझान आरएसआई संकेतकों के क्रॉसिंग रणनीति को निर्धारित करते हैं
- बहु-आयामी K निकटवर्ती एल्गोरिदम और कैलिफोर्निया के आकार के साथ मात्रा मूल्य विश्लेषण व्यापार रणनीति
- अनुकूलन बहु-रणनीति गतिशील स्विचिंग प्रणालीः एकीकरण प्रवृत्ति ट्रैकिंग और सीमा में उतार-चढ़ाव के लिए परिमाणात्मक व्यापार रणनीति
- बहु-संकेतक बहु-आयामी रुझानों को पार करने के लिए उन्नत मात्रात्मक रणनीति
अधिक जानकारी
- ईएचएमए रेंज रणनीति
- चलती औसत खरीद-बेच
- मिडास एमके. II - अंतिम क्रिप्टो स्विंग
- टीएमए-लेगेसी
- टीवी उच्च और निम्न रणनीति
- सर्वश्रेष्ठ ट्रेडिंग व्यू रणनीति
- बड़े स्नैपर अलर्ट R3.0 + चाइकिंग अस्थिरता की स्थिति + TP RSI
- चंदे क्रॉल स्टॉप
- आरएसआई क्रॉस रणनीति के साथ सीसीआई + ईएमए
- ईएमए बैंड + लेलेडसी + बोलिंगर बैंड ट्रेंड कैचिंग रणनीति
- एमएसीडी विली रणनीति
- आरएसआई - खरीदें बेचें संकेत
- हेकिन-अशी प्रवृत्ति
- एचए बाजार पूर्वाग्रह
- इचिमोकू क्लाउड स्मूथ ऑसिलेटर
- विलियम्स %R - चिकनी
- क्यूक्यूई एमओडी + एसएसएल हाइब्रिड + वाद्दाह अट्टार विस्फोट
- स्ट्रैट खरीदें/बेचें
- ईएमए और एडीएक्स के साथ ट्रिपल सुपरट्रेंड
- टॉम डेमार्क अनुक्रमिक ताप मानचित्र