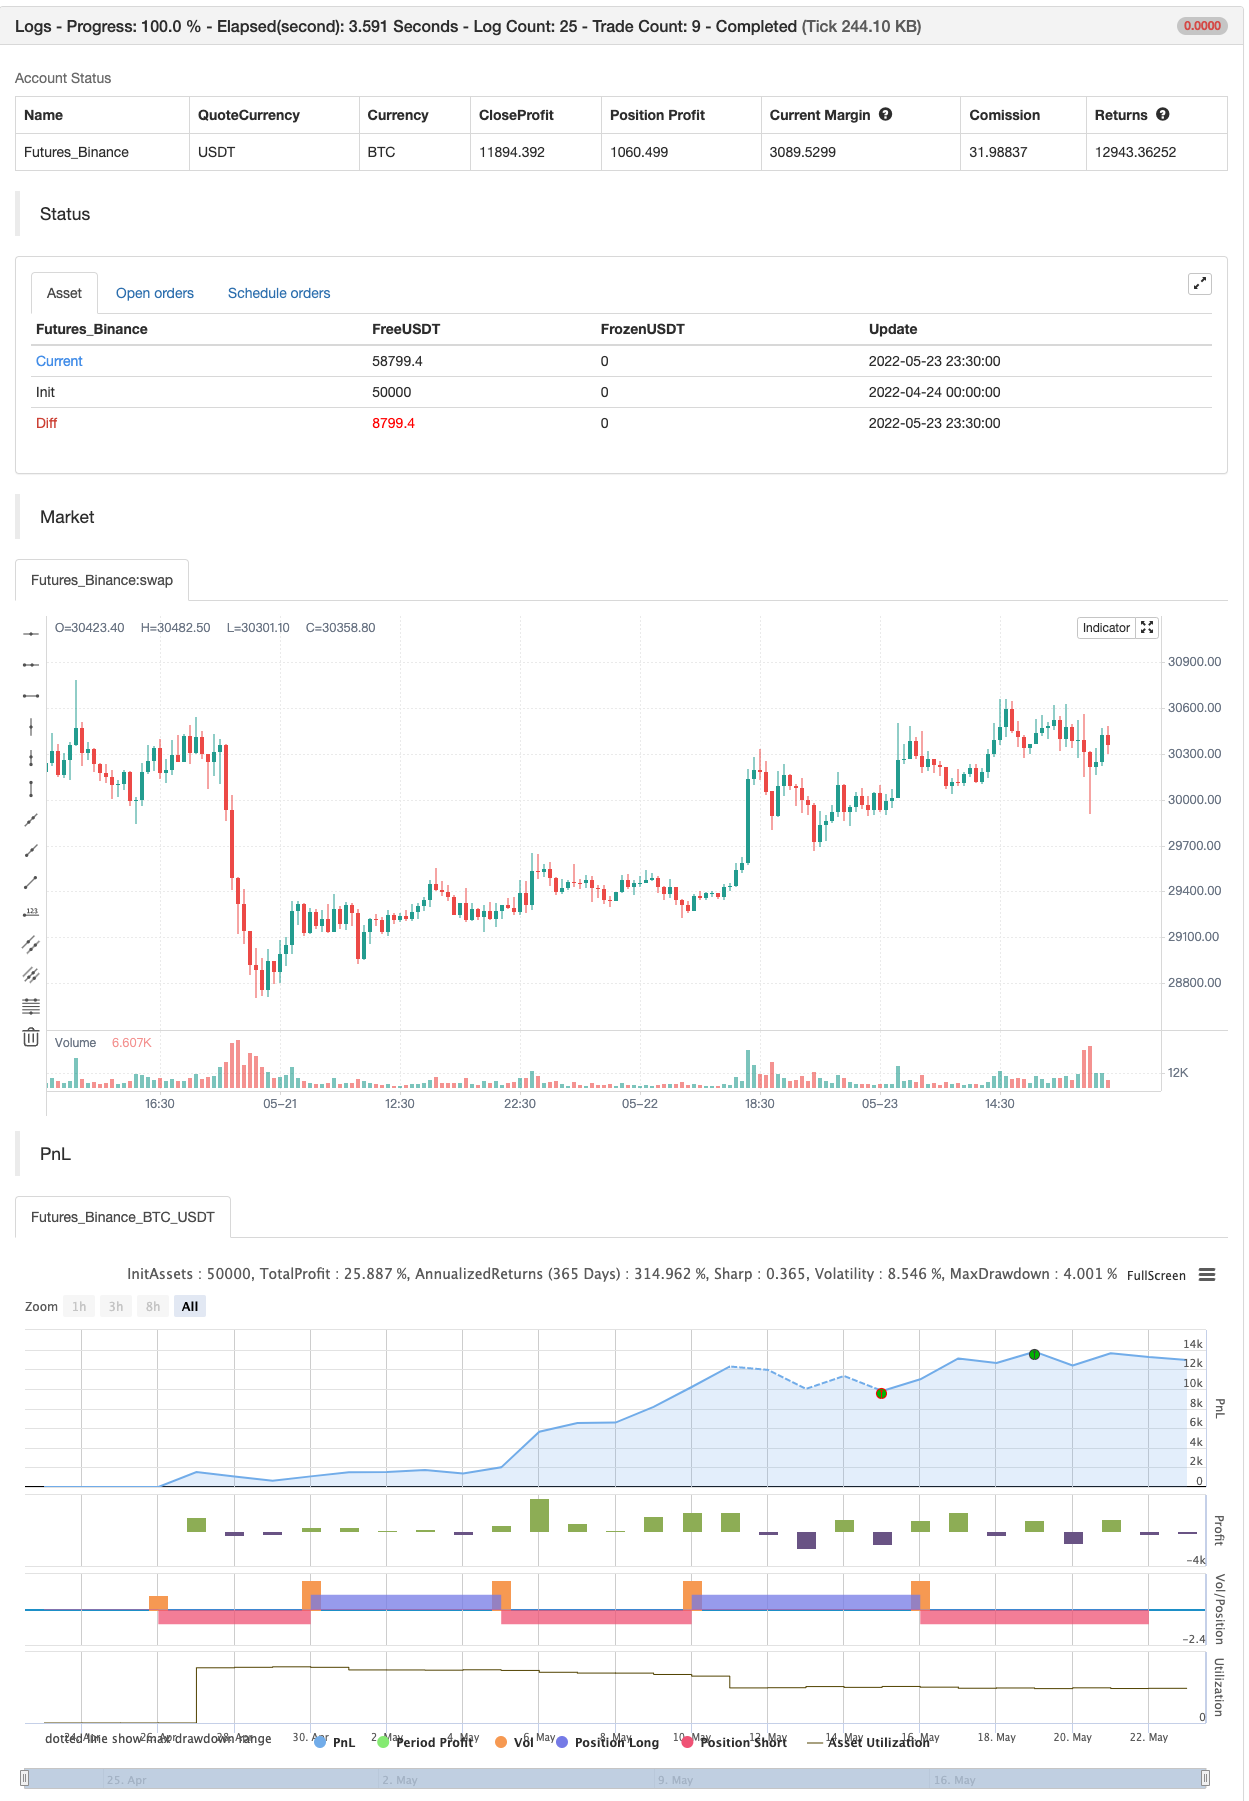
स्टोकैस्टिक + आरएसआई, डबल रणनीति
लेखक:चाओझांग, दिनांकः 2022-05-25 16:12:14टैगःस्टोचआरएसआई
यह रणनीति क्लासिक आरएसआई रणनीति को जोड़ती है जब आरएसआई 70 से ऊपर बढ़ता है (या 30 से नीचे गिरने पर खरीदता है), जब स्टोकेस्टिक ऑसिलेटर 80 के मूल्य से अधिक होता है (और जब यह मूल्य 20 से कम होता है) तो बेचने के लिए क्लासिक स्टोकेस्टिक स्लो रणनीति के साथ।
यह सरल रणनीति केवल तभी सक्रिय होती है जब आरएसआई और स्टोकैस्टिक दोनों एक साथ ओवरबॉट या ओवरसोल्ड स्थिति में होते हैं। एस एंड पी 500 का एक घंटे का चार्ट हाल ही में इस दोहरी रणनीति के साथ काफी अच्छी तरह से काम किया।
वैसे इस रणनीति को
सभी ट्रेडिंग में उच्च जोखिम शामिल होता है; अतीत का प्रदर्शन जरूरी नहीं कि भविष्य के परिणामों का संकेत हो।
बैकटेस्ट

/*backtest
start: 2022-04-24 00:00:00
end: 2022-05-23 23:59:00
period: 30m
basePeriod: 15m
exchanges: [{"eid":"Futures_Binance","currency":"BTC_USDT"}]
*/

//@version=2
strategy("Stochastic + RSI, Double Strategy (by ChartArt)", shorttitle="CA_-_RSI_Stoch_Strat", overlay=true)

// ChartArt's Stochastic Slow + Relative Strength Index, Double Strategy
//
// Version 1.0
// Idea by ChartArt on October 23, 2015.
//
// This strategy combines the classic RSI
// strategy to sell when the RSI increases
// over 70 (or to buy when it falls below 30),
// with the classic Stochastic Slow strategy
// to sell when the Stochastic oscillator
// exceeds the value of 80 (and to buy when
// this value is below 20).
//
// This simple strategy only triggers when
// both the RSI and the Stochastic are together
// in overbought or oversold conditions.
//
// List of my work:
// https://www.tradingview.com/u/ChartArt/


///////////// Stochastic Slow
Stochlength = input(14, minval=1, title="lookback length of Stochastic")
StochOverBought = input(80, title="Stochastic overbought condition")
StochOverSold = input(20, title="Stochastic oversold condition")
smoothK = input(3, title="smoothing of Stochastic %K ")
smoothD = input(3, title="moving average of Stochastic %K")
k = sma(stoch(close, high, low, Stochlength), smoothK)
d = sma(k, smoothD)


///////////// RSI
RSIlength = input( 14, minval=1 , title="lookback length of RSI")
RSIOverBought = input( 70  , title="RSI overbought condition")
RSIOverSold = input( 30  , title="RSI oversold condition")
RSIprice = close
vrsi = rsi(RSIprice, RSIlength)


///////////// Double strategy: RSI strategy + Stochastic strategy

if (not na(k) and not na(d))
    if (crossover(k,d) and k < StochOverSold)
        if (not na(vrsi)) and (crossover(vrsi, RSIOverSold))
            strategy.entry("LONG", strategy.long, comment="StochLE + RsiLE")


if (crossunder(k,d) and k > StochOverBought)
    if (crossunder(vrsi, RSIOverBought))
        strategy.entry("SHORT", strategy.short, comment="StochSE + RsiSE")


//plot(strategy.equity, title="equity", color=red, linewidth=2, style=areabr)
संबंधित
- बहु-सूचक बुद्धिमान पिरामिडिंग रणनीति
- खरीद और बिक्री रणनीति AO+Stoch+RSI+ATR पर निर्भर करती है
- बोलिंगर बैंड्स स्टोकैस्टिक आरएसआई चरम संकेत रणनीति
- बीबीएसआर चरम रणनीति
- बहु-कारक संलयन रणनीति
- ईएमए/एसएमए मल्टी इंडिकेटर व्यापक रुझान रणनीति के बाद
- क्रिप्टो बिग मूव स्टोकैस्टिक आरएसआई रणनीति
- RSI सांख्यिकीय सूट रणनीति
- टीएमए-लेगेसी
अधिक
- एसएसएल चैनल
- हुल सुइट रणनीति
- पैराबोलिक एसएआर खरीदें और बेचें
- पिवोट आधारित अनुवर्ती अधिकतम और न्यूनतम
- निक राइपॉक ट्रैलिंग रिवर्स (एनआरटीआर)
- ज़िगज़ैग पीए रणनीति V4.1
- दिन के भीतर खरीद/बिक्री
- टूटा हुआ फ्रैक्टल: किसी के टूटे हुए सपने से आपका लाभ होता है!
- मुनाफा अधिकतम करनेवाला PMax
- निर्दोष विजय रणनीति
- स्विंग हॉल/आरएसआई/ईएमए रणनीति
- स्केलिंग स्विंग ट्रेडिंग टूल R1-4
- बेस्ट एग्लोविंग + ब्रेकआउट रणनीति
- Bollinger भयानक चेतावनी R1
- बहु-विनिमय प्लगइन
- त्रिभुज लाभ (छोटी मुद्राओं के बाजार मूल्य में अंतर)
- बाइट रिवर्स कॉन्ट्रैक्ट डायनेमिक ग्रिड (विशेष ग्रिड)
- MT4 MT5 + गतिशील चर के लिए ट्रेडिंगव्यू अलर्ट
- मैट्रिक्स श्रृंखला
- सुपर स्केलर - 5 मिनट 15 मिनट