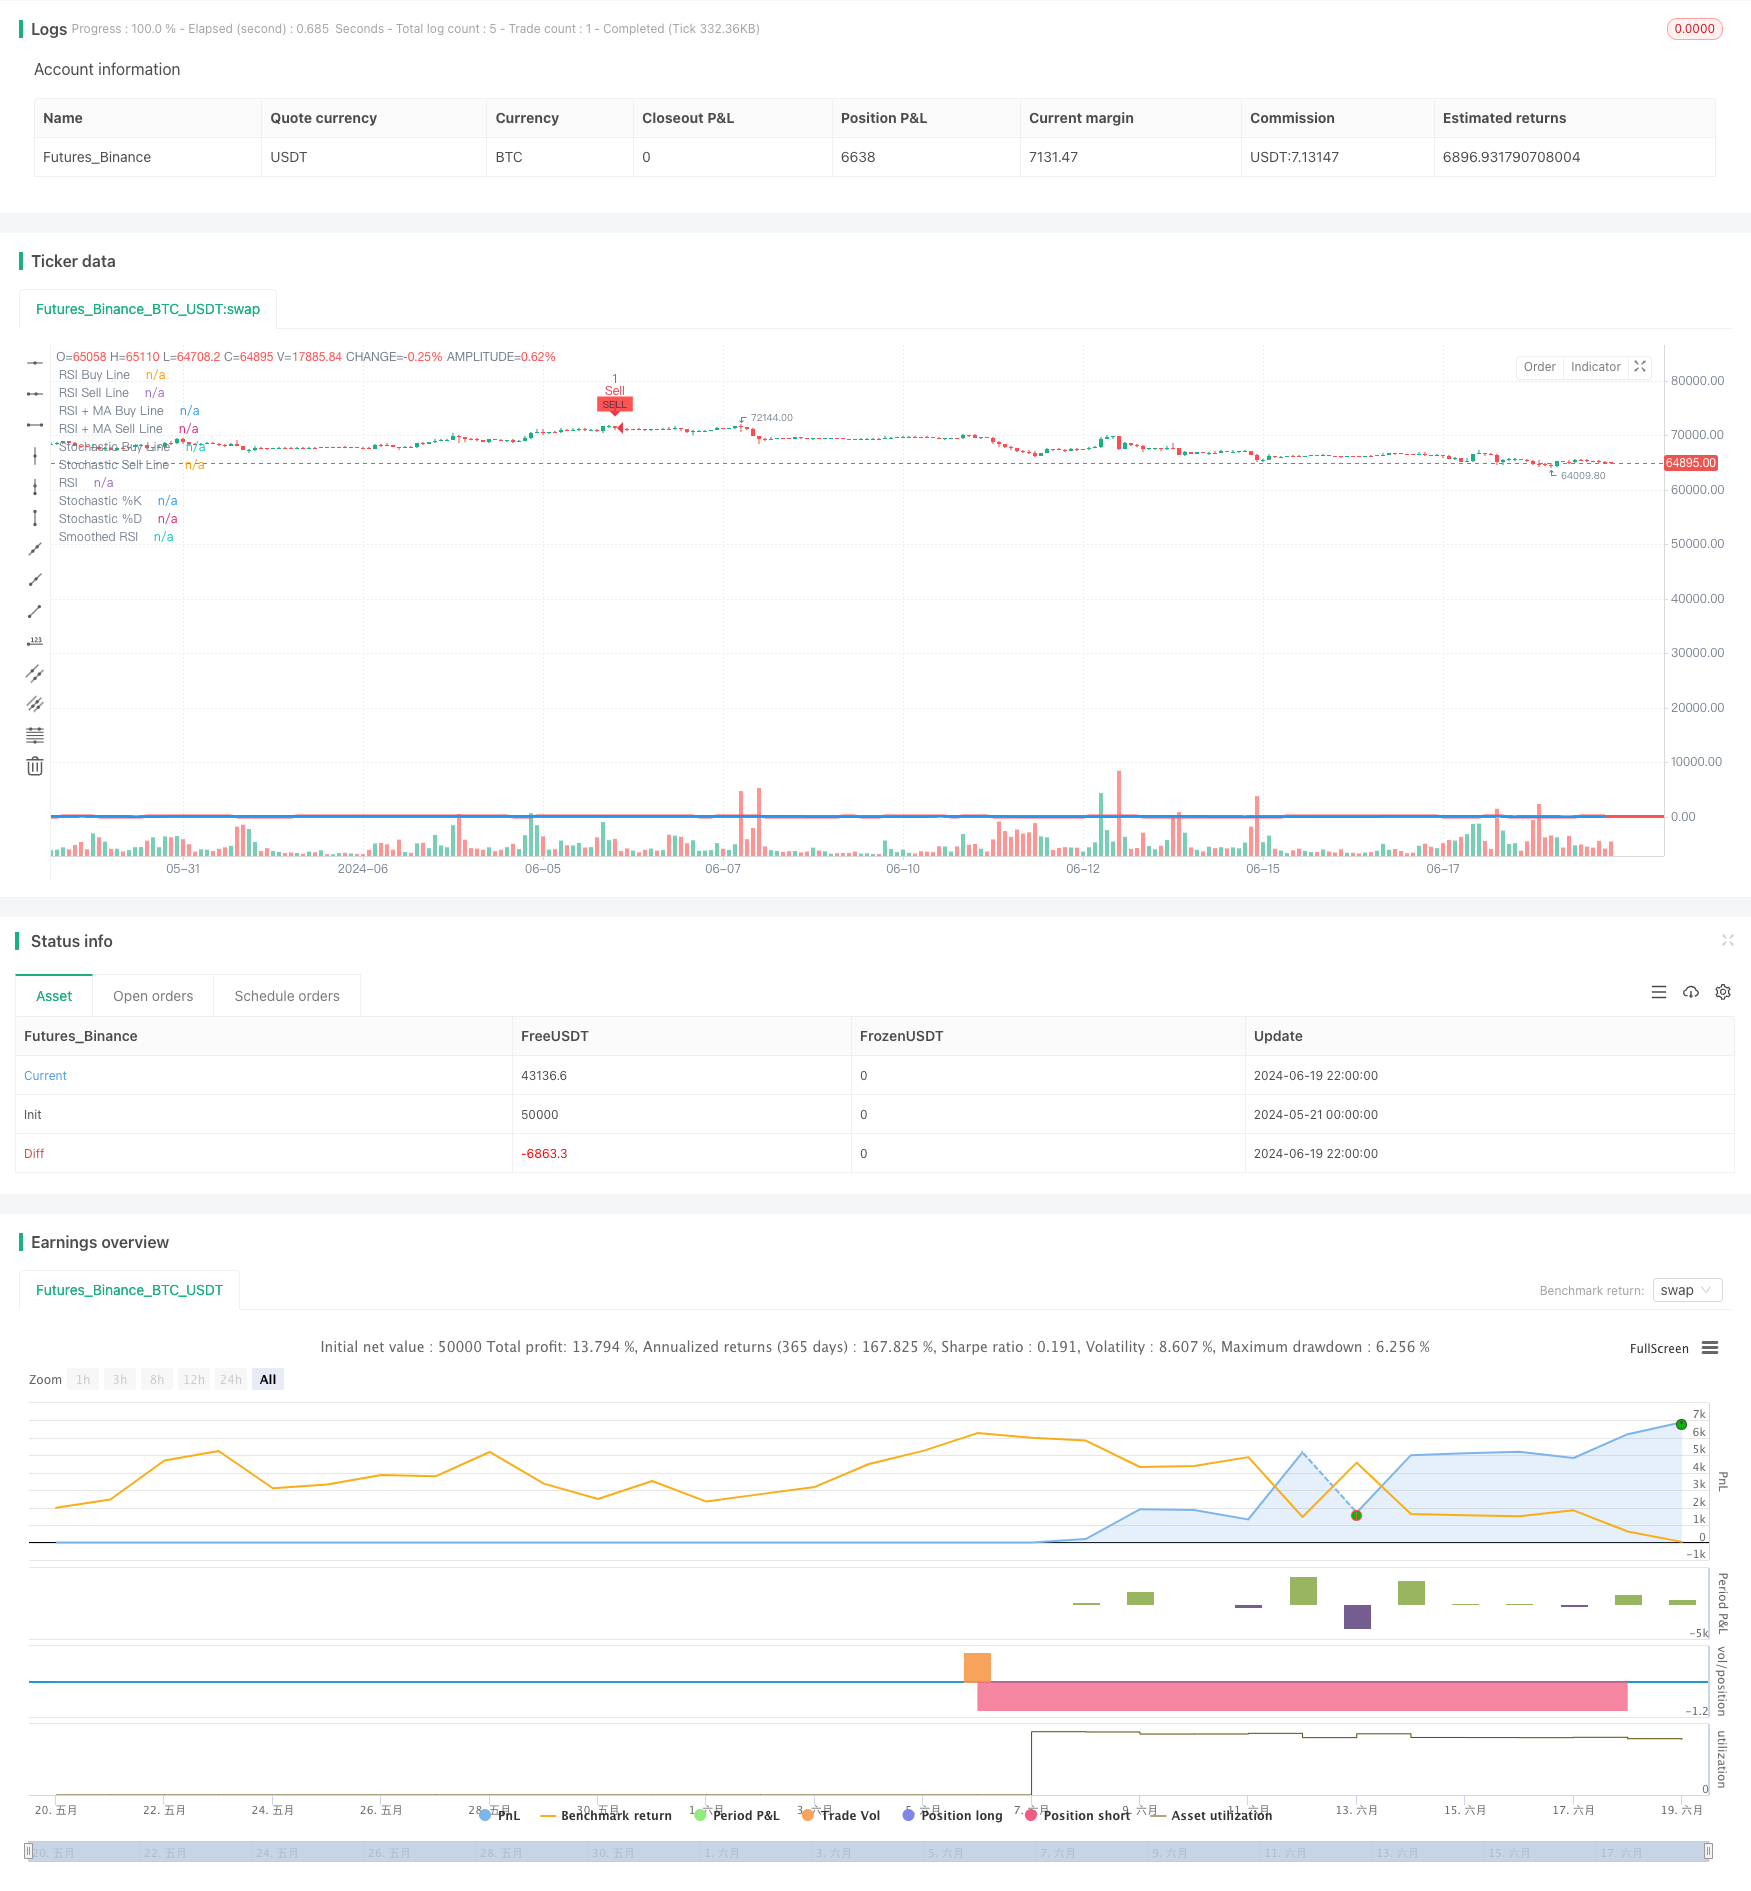
概述
该策略是一个综合性的技术分析系统,主要结合了相对强弱指标(RSI)和随机指标(Stochastic)的特性,同时融入了移动平均线(MA)的概念。策略的核心思想是通过多个动量指标的交叉和阈值判断来捕捉市场的转折点,从而产生买入和卖出信号。这种多维度的分析方法旨在提高交易决策的准确性和可靠性。
策略原理
RSI分析:
- 使用标准的14周期RSI。
- 设定了买入(37)和卖出(49)阈值。
- RSI上升且低于买入阈值视为看涨信号之一。
- RSI下降且高于卖出阈值视为看跌信号之一。
平滑RSI:
- 对RSI进行移动平均处理,可选SMA、EMA、WMA、SMMA或VMMA。
- RSI与其平滑线的交叉被用作额外的信号确认。
随机指标分析:
- 使用标准的随机指标设置(14,3,3)。
- 设定了超买(80)和超卖(20)阈值。
- K线与D线的金叉和死叉作为交易信号的重要组成部分。
综合信号生成:
- 买入信号:RSI上升且低于买入阈值,随机指标K值低于超卖线且金叉,RSI上穿平滑RSI且在RSI+MA买入线以下。
- 卖出信号:RSI下降且高于卖出阈值,随机指标K值高于超买线且死叉,RSI下穿平滑RSI且在RSI+MA卖出线以上。
策略优势
多指标融合:通过结合RSI、随机指标和移动平均线,策略能够从多个角度分析市场动量,减少假信号。
动态适应性:使用RSI和随机指标的交叉信号,能够更好地适应不同市场环境。
趋势确认:RSI与其平滑线的交叉提供了额外的趋势确认,有助于过滤掉一些不可靠的信号。
灵活性:策略允许用户自定义多个参数,如RSI长度、买卖阈值等,可以根据不同市场和个人偏好进行调整。
视觉反馈:策略提供了丰富的图表绘制功能,有助于交易者直观地理解市场状况和信号生成过程。
策略风险
过度交易:多重条件可能导致信号频繁生成,增加交易成本。
滞后性:使用多个移动平均和平滑处理可能导致信号滞后,在快速变化的市场中错过机会。
参数敏感性:策略依赖多个可调参数,不当的参数设置可能导致策略表现不佳。
市场环境依赖:在趋势不明显或横盘市场中,策略可能产生大量假信号。
过度依赖技术指标:忽视基本面和市场情绪等其他重要因素可能导致判断失误。
策略优化方向
动态参数调整:引入自适应机制,根据市场波动性自动调整RSI和随机指标的参数。
增加趋势过滤器:结合长期移动平均线或ADX指标,以确保在强趋势中才进行交易。
引入成交量分析:将成交量指标纳入决策过程,提高信号的可靠性。
优化出场策略:开发更精细的止盈止损机制,如使用跟踪止损或基于ATR的动态止损。
时间框架协调:在多个时间框架上验证信号,以减少假信号和提高准确性。
机器学习整合:使用机器学习算法优化参数选择和信号生成过程。
总结
RSI与随机指标融合交叉策略是一个全面的技术分析系统,通过结合多个动量指标和移动平均线,旨在捕捉市场的重要转折点。该策略的优势在于其多维度分析方法和灵活的参数设置,使其能够适应不同的市场环境。然而,策略也面临过度交易和参数敏感性等风险。未来的优化方向应focus on提高策略的自适应能力,引入更多的市场信息,以及优化风险管理机制。通过持续改进和测试,这个策略有潜力成为一个强大的交易决策辅助工具。
/*backtest
start: 2024-05-21 00:00:00
end: 2024-06-20 00:00:00
period: 2h
basePeriod: 15m
exchanges: [{"eid":"Futures_Binance","currency":"BTC_USDT"}]
*/

//@version=5
strategy("-VrilyaSS-RSI&SToch-Cross+2xRSI+2xStoch-Lines+RSI-SMA-Cross-V4-", overlay=true)

// RSI settings
rsiLength = input.int(14, title="RSI Length")
rsiSource = input.source(ohlc4, title="RSI Source")
rsiBuyLine = input.int(37, title="RSI Buy Line", minval=0, maxval=100)
rsiSellLine = input.int(49, title="RSI Sell Line", minval=0, maxval=100)
rsi = ta.rsi(rsiSource, rsiLength)

// Smoothed RSI (Gleitender Durchschnitt von RSI)
smaLength = input.int(14, title="MA Length for RSI")
smaSource = input.source(ohlc4, title="MA Source for RSI")
maTypeRSI = input.string(title="MA Type for RSI", defval="SMA", options=["SMA", "EMA", "WMA", "SMMA (RMA)", "VMMA"])
f_get_ma_rsi(source, length, type) =>
    switch type
        "SMA" => ta.sma(source, length)
        "EMA" => ta.ema(source, length)
        "WMA" => ta.wma(source, length)
        "SMMA (RMA)" => ta.rma(source, length) // Smoothed Moving Average (Simple Moving Average)
        "VMMA" => ta.vwma(source, length) // Volume Weighted Moving Average (VMMA)
smoothedRsi = f_get_ma_rsi(ta.rsi(smaSource, rsiLength), smaLength, maTypeRSI)
rsiSmaBuyLine = input.int(40, title="RSI + MA Buy Line", minval=0, maxval=100)
rsiSmaSellLine = input.int(60, title="RSI + MA Sell Line", minval=0, maxval=100)

// Stochastic settings
kLength = input.int(14, title="Stochastic K Length")
kSmoothing = input.int(3, title="Stochastic K Smoothing")
dSmoothing = input.int(3, title="Stochastic D Smoothing")
stochBuyLine = input.int(20, title="Stochastic Buy Line", minval=0, maxval=100)
stochSellLine = input.int(80, title="Stochastic Sell Line", minval=0, maxval=100)
stochK = ta.sma(ta.stoch(close, high, low, kLength), kSmoothing)
stochD = ta.sma(stochK, dSmoothing)

// Stochastic Crosses
bullishCross = ta.crossover(stochK, stochD)
bearishCross = ta.crossunder(stochK, stochD)

// RSI Direction and Crosses
rsiUp = ta.change(rsi) > 0
rsiDown = ta.change(rsi) < 0
rsiCrossAboveSMA = ta.crossover(rsi, smoothedRsi) and rsi < rsiSmaBuyLine
rsiCrossBelowSMA = ta.crossunder(rsi, smoothedRsi) and rsi > rsiSmaSellLine

// Buy Signal (RSI geht hoch und ist unter der Buy-Line, Stochastic unter Buy-Line mit bullischem Cross, und RSI kreuzt über SMA unterhalb der RSI+SMA Buy Line)
buySignal = rsiUp and rsi < rsiBuyLine and bullishCross and stochK < stochBuyLine and rsiCrossAboveSMA

// Sell Signal (RSI geht runter und ist über der Sell-Line, Stochastic über Sell-Line mit bärischem Cross, und RSI kreuzt unter SMA oberhalb der RSI+SMA Sell Line)
sellSignal = rsiDown and rsi > rsiSellLine and bearishCross and stochK > stochSellLine and rsiCrossBelowSMA

// Plot RSI, Smoothed RSI, and Stochastic for reference with default visibility off
plot(rsi, title="RSI", color=color.yellow, linewidth=2, display=display.none)
plot(smoothedRsi, title="Smoothed RSI", color=color.blue, linewidth=2, display=display.none)
hline(rsiBuyLine, "RSI Buy Line", color=color.green, linewidth=2, linestyle=hline.style_solid, display=display.none)
hline(rsiSellLine, "RSI Sell Line", color=color.red, linewidth=2, linestyle=hline.style_solid, display=display.none)
hline(rsiSmaBuyLine, "RSI + MA Buy Line", color=color.purple, linewidth=2, linestyle=hline.style_solid, display=display.none)
hline(rsiSmaSellLine, "RSI + MA Sell Line", color=color.orange, linewidth=2, linestyle=hline.style_solid, display=display.none)
plot(stochK, title="Stochastic %K", color=color.aqua, linewidth=2, display=display.none)
plot(stochD, title="Stochastic %D", color=color.red, linewidth=3, display=display.none)
hline(stochBuyLine, "Stochastic Buy Line", color=color.green, linewidth=2, linestyle=hline.style_solid, display=display.none)
hline(stochSellLine, "Stochastic Sell Line", color=color.red, linewidth=2, linestyle=hline.style_solid, display=display.none)

// Alert conditions
alertcondition(buySignal, title="Buy Signal", message="Buy Signal: RSI and Stochastic conditions met.")
alertcondition(sellSignal, title="Sell Signal", message="Sell Signal: RSI and Stochastic conditions met.")

// Plot buy and sell signals for visual reference
plotshape(series=buySignal, location=location.belowbar, color=color.new(color.green, 0), style=shape.labelup, text="BUY", textcolor=color.black, size=size.tiny)
plotshape(series=sellSignal, location=location.abovebar, color=color.new(color.red, 0), style=shape.labeldown, text="SELL", textcolor=color.black, size=size.tiny)

// Strategy orders
if (buySignal)
    strategy.entry("Buy", strategy.long)
if (sellSignal)
    strategy.entry("Sell", strategy.short)