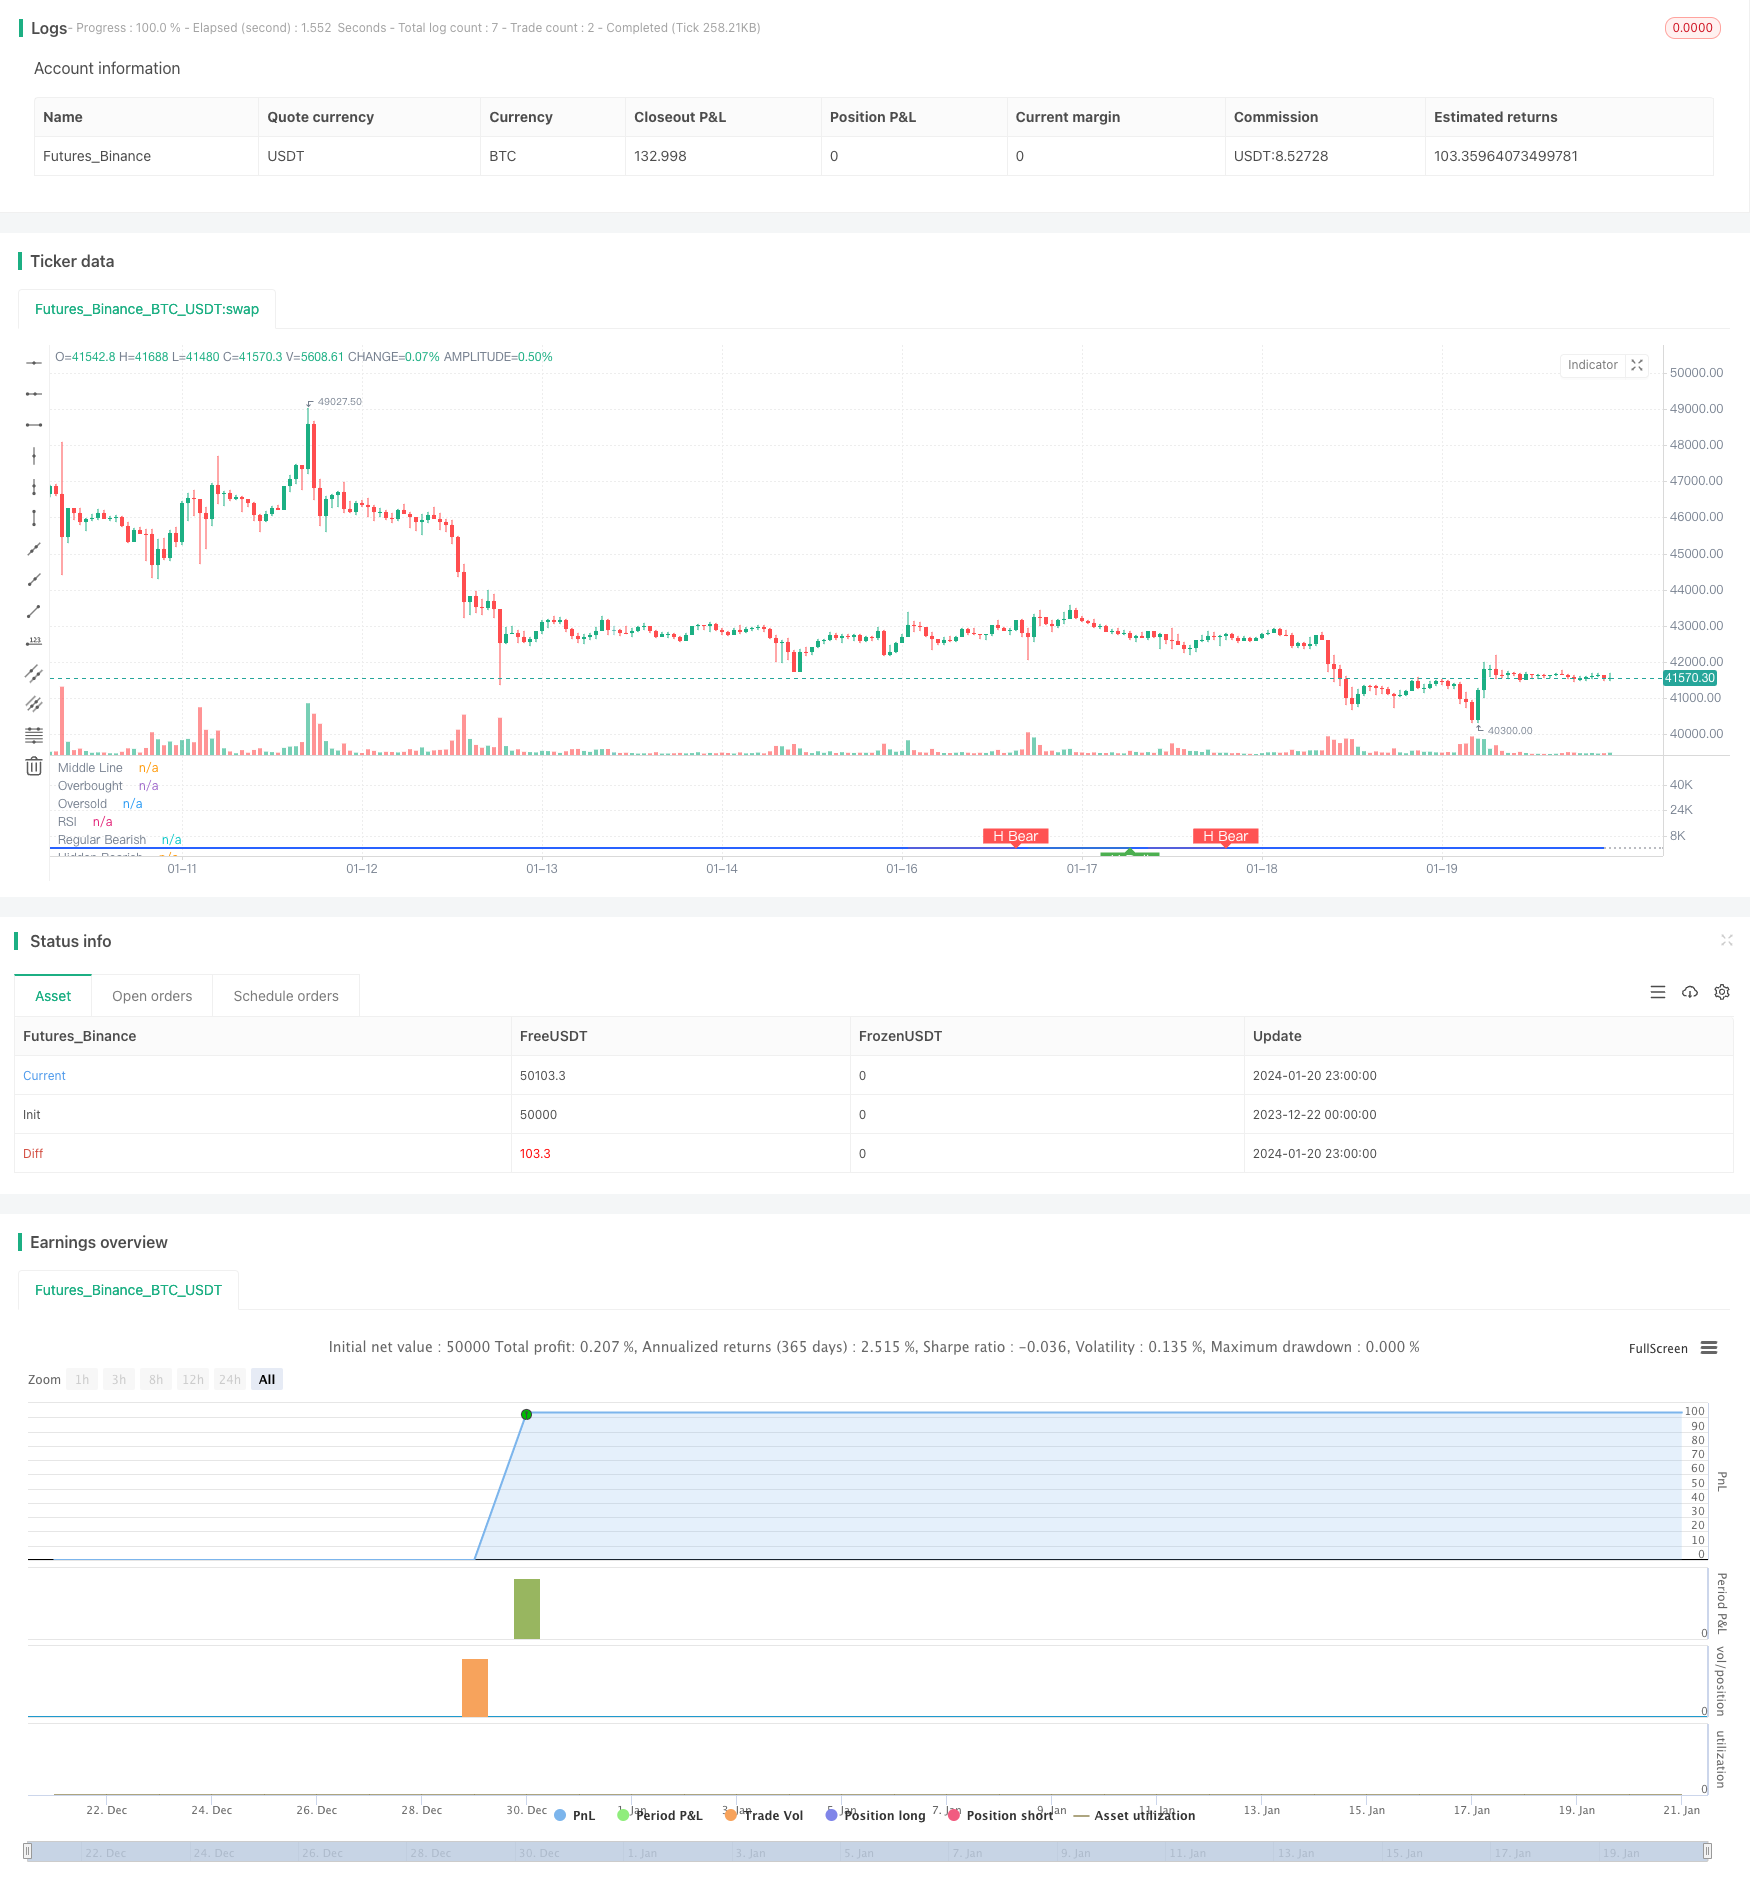
आरएसआई विभेदन व्यापार रणनीति
लेखक:चाओझांग, दिनांकः 2024-01-22 11:45:25टैगः

रणनीति का नाम
आरएसआई बुलिश/बियर डिवर्जेंस ट्रेडिंग रणनीति
अवलोकन
यह रणनीति लंबी और छोटी मुद्राओं को निर्धारित करने के लिए नियमित और छिपे हुए तेजी/बियर आरएसआई विचलन संकेतों की पहचान करती है।
सिद्धांत
जब कीमत एक नया उच्च बनाता है और आरएसआई एक नया उच्च बनाने में विफल रहता है, तो यह तेजी से विचलन बनाता है, जिसे बिक्री संकेत के रूप में माना जाता है। जब कीमत एक नया निम्न बनाता है और आरएसआई एक नया निम्न बनाने में विफल रहता है, तो यह मंदी विचलन बनाता है, जिसे खरीद संकेत के रूप में माना जाता है। नियमित विचलन मूल्य और आरएसआई के बीच स्पष्ट विचलन को संदर्भित करता है जबकि छिपे हुए विचलन का अर्थ है उनके बीच अपेक्षाकृत छिपा हुआ विचलन। लंबी या छोटी स्थिति नियमित रूप से पहचाने गए या छिपे हुए तेजी / मंदी विचलन संकेतों के आधार पर निर्धारित की जाती है।
लाभ विश्लेषण
- विचलन संकेतों में अपेक्षाकृत उच्च विश्वसनीयता और उच्च जीत दर होती है।
- नियमित और छिपे हुए तेजी/बैरिस विचलन दोनों की पहचान व्यापक कवरेज प्रदान करती है।
- समायोज्य आरएसआई पैरामीटर इसे विभिन्न बाजार वातावरणों के अनुकूल बनाते हैं।
जोखिम विश्लेषण
- छिपे हुए विचलन संकेतों में गलत आकलन की अधिक संभावना होती है।
- गलत आंकलन संकेतों को फ़िल्टर करने के लिए मैन्युअल समीक्षा की आवश्यकता है।
- प्रभावशीलता आरएसआई पैरामीटर सेटिंग्स पर निर्भर करती है।
अनुकूलन दिशाएँ
- सबसे अच्छा पैरामीटर संयोजन खोजने के लिए आरएसआई मापदंडों का अनुकूलन करें।
- वास्तविक संकेतों की स्वचालित पहचान के लिए मशीन लर्निंग एल्गोरिदम जोड़ें।
- सिग्नल की विश्वसनीयता को सत्यापित करने के लिए अधिक संकेतक शामिल करें।
सारांश
यह रणनीति लंबी या छोटी पदों को निर्धारित करने के लिए नियमित और छिपे हुए तेजी/बियरिश विचलन के आधार पर आरएसआई विचलन ट्रेडिंग संकेतों की पहचान करती है, जो अपेक्षाकृत उच्च जीत दर प्रदान करती है। आरएसआई मापदंडों को अनुकूलित करके, अन्य सत्यापन संकेतकों को जोड़कर रणनीति प्रभावशीलता में और सुधार हासिल किया जा सकता है।
/*backtest
start: 2023-12-22 00:00:00
end: 2024-01-21 00:00:00
period: 1h
basePeriod: 15m
exchanges: [{"eid":"Futures_Binance","currency":"BTC_USDT"}]
*/

//@version=5
strategy(title="Divergence Indicator")
len = input.int(title="RSI Period", minval=1, defval=14)
src = input(title="RSI Source", defval=close)
lbR = input(title="Pivot Lookback Right", defval=5)
lbL = input(title="Pivot Lookback Left", defval=5)
rangeUpper = input(title="Max of Lookback Range", defval=60)
rangeLower = input(title="Min of Lookback Range", defval=5)
plotBull = input(title="Plot Bullish", defval=true)
plotHiddenBull = input(title="Plot Hidden Bullish", defval=true)
plotBear = input(title="Plot Bearish", defval=true)
plotHiddenBear = input(title="Plot Hidden Bearish", defval=true)
bearColor = color.red
bullColor = color.green
hiddenBullColor = color.new(color.green, 80)
hiddenBearColor = color.new(color.red, 80)
textColor = color.white
noneColor = color.new(color.white, 100)
osc = ta.rsi(src, len)

plot(osc, title="RSI", linewidth=2, color=#2962FF)
hline(50, title="Middle Line", color=#787B86, linestyle=hline.style_dotted)
obLevel = hline(70, title="Overbought", color=#787B86, linestyle=hline.style_dotted)
osLevel = hline(30, title="Oversold", color=#787B86, linestyle=hline.style_dotted)
fill(obLevel, osLevel, title="Background", color=color.rgb(33, 150, 243, 90))

plFound = na(ta.pivotlow(osc, lbL, lbR)) ? false : true
phFound = na(ta.pivothigh(osc, lbL, lbR)) ? false : true
_inRange(cond) =>
	bars = ta.barssince(cond == true)
	rangeLower <= bars and bars <= rangeUpper

//------------------------------------------------------------------------------
// Regular Bullish
// Osc: Higher Low

oscHL = osc[lbR] > ta.valuewhen(plFound, osc[lbR], 1) and _inRange(plFound[1])

// Price: Lower Low

priceLL = low[lbR] < ta.valuewhen(plFound, low[lbR], 1)
// bull : 상승 Condition : 조건
bullCond = plotBull and priceLL and oscHL and plFound // 상승다이버전스?
strategy.entry("상승 다이버전스 진입", strategy.long, when = bullCond)
strategy.close("상승 다이버전스 진입", when = ta.crossover(osc, 50))
plot(
     plFound ? osc[lbR] : na,
     offset=-lbR,
     title="Regular Bullish",
     linewidth=2,
     color=(bullCond ? bullColor : noneColor)
     )

plotshape(
	 bullCond ? osc[lbR] : na,
	 offset=-lbR,
	 title="Regular Bullish Label",
	 text=" Bull ",
	 style=shape.labelup,
	 location=location.absolute,
	 color=bullColor,
	 textcolor=textColor
	 )

//------------------------------------------------------------------------------
// Hidden Bullish
// Osc: Lower Low

oscLL = osc[lbR] < ta.valuewhen(plFound, osc[lbR], 1) and _inRange(plFound[1])

// Price: Higher Low

priceHL = low[lbR] > ta.valuewhen(plFound, low[lbR], 1)
hiddenBullCond = plotHiddenBull and priceHL and oscLL and plFound
// strategy.entry("히든 상승 다이버전스 진입", strategy.long, when = hiddenBullCond)
// strategy.close("히든 상승 다이버전스 진입", when = ta.crossover(osc, 50))
plot(
	 plFound ? osc[lbR] : na,
	 offset=-lbR,
	 title="Hidden Bullish",
	 linewidth=2,
	 color=(hiddenBullCond ? hiddenBullColor : noneColor)
	 )

plotshape(
	 hiddenBullCond ? osc[lbR] : na,
	 offset=-lbR,
	 title="Hidden Bullish Label",
	 text=" H Bull ",
	 style=shape.labelup,
	 location=location.absolute,
	 color=bullColor,
	 textcolor=textColor
	 )

//------------------------------------------------------------------------------
// Regular Bearish
// Osc: Lower High

oscLH = osc[lbR] < ta.valuewhen(phFound, osc[lbR], 1) and _inRange(phFound[1])

// Price: Higher High

priceHH = high[lbR] > ta.valuewhen(phFound, high[lbR], 1)
// bear : 하락
bearCond = plotBear and priceHH and oscLH and phFound
// strategy.entry("하락 다이버전스 진입", strategy.short, when = bearCond)
// strategy.close("하락 다이버전스 진입", when = ta.crossunder(osc, 50))
plot(
	 phFound ? osc[lbR] : na,
	 offset=-lbR,
	 title="Regular Bearish",
	 linewidth=2,
	 color=(bearCond ? bearColor : noneColor)
	 )

plotshape(
	 bearCond ? osc[lbR] : na,
	 offset=-lbR,
	 title="Regular Bearish Label",
	 text=" Bear ",
	 style=shape.labeldown,
	 location=location.absolute,
	 color=bearColor,
	 textcolor=textColor
	 )

//------------------------------------------------------------------------------
// Hidden Bearish
// Osc: Higher High

oscHH = osc[lbR] > ta.valuewhen(phFound, osc[lbR], 1) and _inRange(phFound[1])

// Price: Lower High

priceLH = high[lbR] < ta.valuewhen(phFound, high[lbR], 1)

hiddenBearCond = plotHiddenBear and priceLH and oscHH and phFound
// strategy.entry("히든 하락 다이버전스 진입", strategy.short, when = hiddenBearCond)
// strategy.close("히든 하락 다이버전스 진입", when = ta.crossunder(osc, 50))
plot(
	 phFound ? osc[lbR] : na,
	 offset=-lbR,
	 title="Hidden Bearish",
	 linewidth=2,
	 color=(hiddenBearCond ? hiddenBearColor : noneColor)
	 )

plotshape(
	 hiddenBearCond ? osc[lbR] : na,
	 offset=-lbR,
	 title="Hidden Bearish Label",
	 text=" H Bear ",
	 style=shape.labeldown,
	 location=location.absolute,
	 color=bearColor,
	 textcolor=textColor
	 )
- गतिशील सीसीआई समर्थन और प्रतिरोध रणनीति
- QQE मोमेंटम ट्रेडिंग रणनीति
- गाउस तरंग पूर्वानुमान रणनीति
- गतिशील चलती ईएमए संयोजन मात्रा रणनीति
- डोंचियन चैनल ट्रेंड रणनीति का पालन करना
- ईएमए रिबन रणनीति
- ट्रेंड रिवर्स मूविंग एवरेज क्रॉसओवर रणनीति
- बहु-ईएमए तेजी की प्रवृत्ति रणनीति
- एस एंड पी 500 हाइब्रिड सीजनल ट्रेडिंग रणनीति
- विचलन आधारित रुझान ट्रैकिंग रणनीति
- बहु-निर्देशक निर्णय वृक्ष रणनीतिः आईएमएसीडी, ईएमए और इचिमोकू
- एमएसीडी डबल ऑप्टिमाइजेशन ट्रेडिंग रणनीति
- दोहरी ईएमए गोल्डन क्रॉस रणनीति
- बहु-समय-सीमा आरएसआई और चलती औसत ट्रेडिंग रणनीति
- साप्ताहिक स्विंग ट्रेडिंग रणनीति
- EVWMA आधारित एमएसीडी ट्रेडिंग रणनीति
- बोलिंगर बैंड्स चैनल ब्रेकआउट मीन्स रिवर्सन रणनीति
- कई तकनीकी संकेतकों पर आधारित मात्रात्मक रुझान ट्रैकिंग रणनीति
- आरएसआई और सीसीआई संयोजन मात्रात्मक ट्रेडिंग रणनीति
- कम जोखिम वाली डीसीए ट्रेंड ट्रेडिंग रणनीति