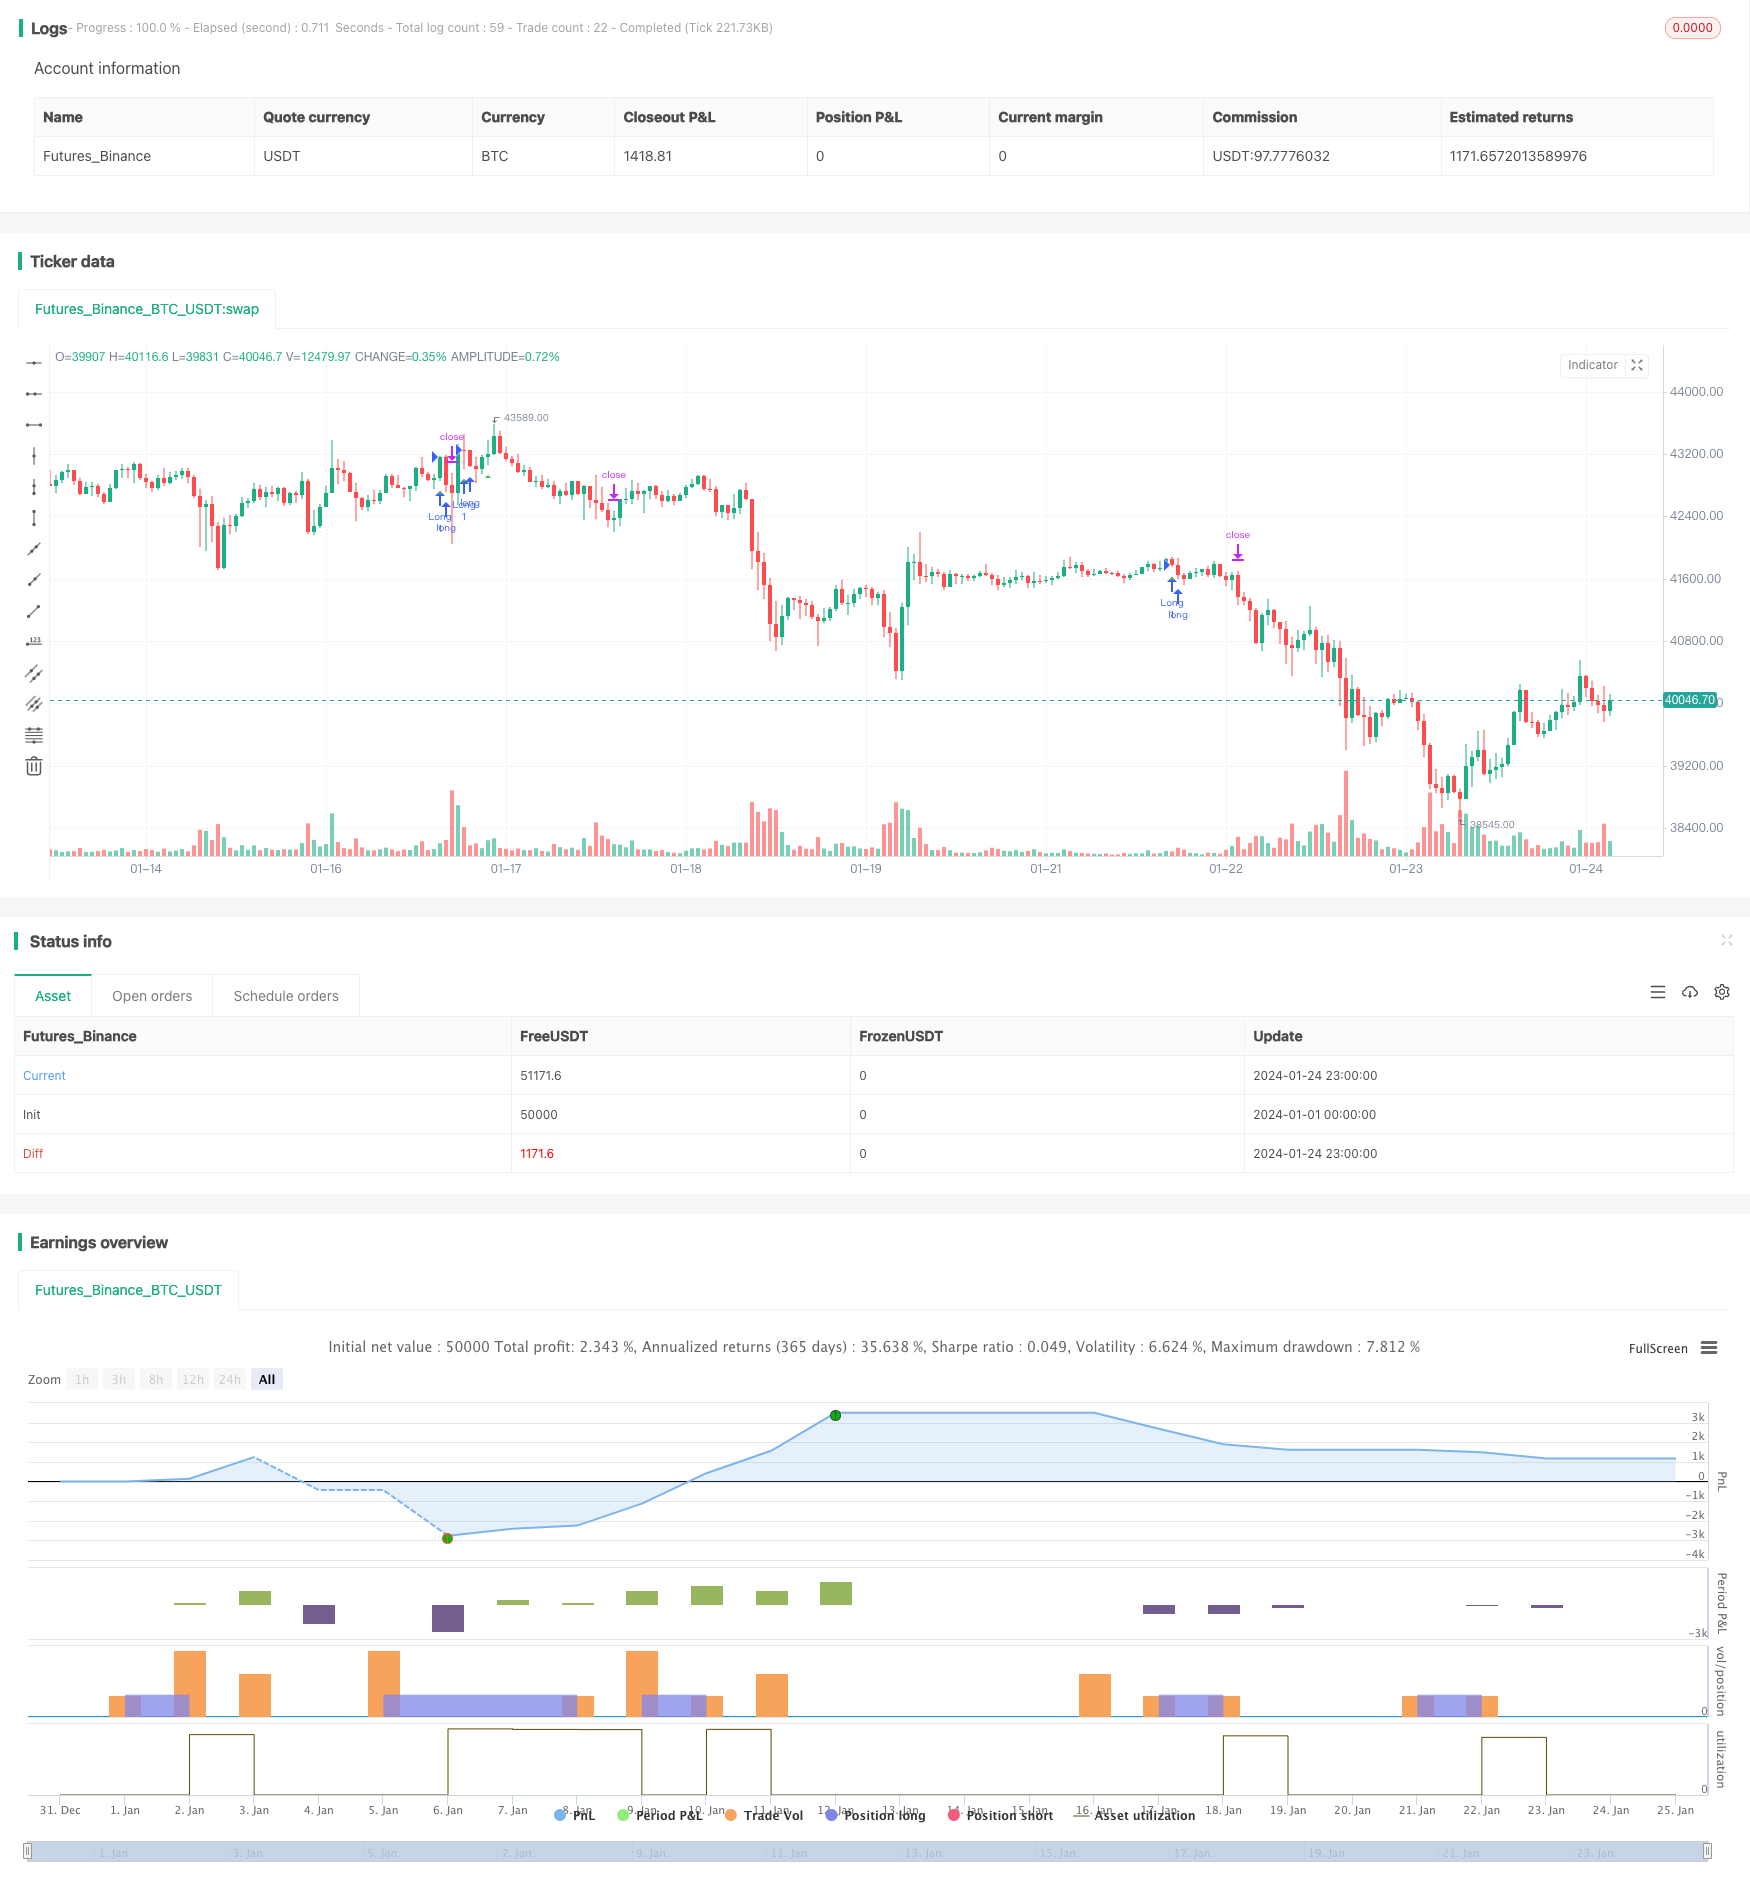
टैगः

अवलोकन
रणनीति तर्क
इस रणनीति का संकेत निर्धारण निम्नलिखित तर्क पर आधारित हैः
-
प्रवृत्ति निर्धारित करने के लिए तीन ईएमएः शीर्ष पर 8-दिवसीय ईएमए, मध्य में 14-दिवसीय ईएमए और नीचे पर 50-दिवसीय ईएमए एक अपट्रेंड बनाते हैं; इसके विपरीत एक डाउनट्रेंड बनाता है।
जब थ्री ईएमए ऊपर की ओर रुझान दिखाता है और स्टोकैस्टिक आरएसआई एक स्वर्ण क्रॉस उत्पन्न करता है, तो लंबा हो जाता है। लाभ को लॉक करने के लिए इसके आधार पर स्टॉप लॉस सेट करें और लाभ लें।
लाभ विश्लेषण
दोहरे संकेतक निर्धारण के साथ इस रणनीति के मुख्य लाभ निम्नलिखित हैंः
-
तीन ईएमए अल्पकालिक शोर को फ़िल्टर करते हैं और मध्यम-लंबी अवधि के रुझानों में लॉक करते हैं।
-
स्टोकैस्टिक आरएसआई गोल्डन क्रॉस मजबूत अपट्रेंड की पुष्टि करता है।
-
एटीआर स्मार्ट स्टॉप लॉस और ले लाभ लाभ में ताले।
-
सरल और स्पष्ट रणनीति तर्क, समझने और लागू करने में आसान।
जोखिम विश्लेषण
इस रणनीति के मुख्य जोखिम निम्नलिखित हैंः
अनुकूलन दिशाएँ
मुख्य अनुकूलन दिशाओं में निम्नलिखित शामिल हैंः
-
नीचे की ओर रुझान निर्धारित करने और लघु अवसरों को बढ़ाने के लिए एमएसीडी आदि जोड़ें।
-
स्टॉप और लिमिट को बेहतर बनाने के लिए एटीआर जैसे अस्थिरता संकेतक जोड़ें।
-
झूठे ब्रेकआउट से बचने के लिए वॉल्यूम को शामिल करें।
-
पैरामीटर अनुकूलन के लिए मशीन लर्निंग आदि का उपयोग करें।
निष्कर्ष
/*backtest
start: 2024-01-01 00:00:00
end: 2024-01-25 00:00:00
period: 1h
basePeriod: 15m
exchanges: [{"eid":"Futures_Binance","currency":"BTC_USDT"}]
*/

//@version=4

strategy(title="Stoch RSI Crossover Strat + EMA", shorttitle="Stoch RSI Cross + EMA Strat", overlay = true)

// Time Range
FromMonth=input(defval=1,title="FromMonth",minval=1,maxval=12)
FromDay=input(defval=1,title="FromDay",minval=1,maxval=31)
FromYear=input(defval=2020,title="FromYear",minval=2017)
ToMonth=input(defval=1,title="ToMonth",minval=1,maxval=12)
ToDay=input(defval=1,title="ToDay",minval=1,maxval=31)
ToYear=input(defval=9999,title="ToYear",minval=2017)
start=timestamp(FromYear,FromMonth,FromDay,00,00)
finish=timestamp(ToYear,ToMonth,ToDay,23,59)
window()=>true

// See if this bar's time happened on/after start date
afterStartDate = time >= start and time<=finish?true:false

//STOCH RSI
smoothK = input(3, minval=1)
smoothD = input(3, minval=1)
lengthRSI = input(14, minval=1)
lengthStoch = input(14, minval=1)
src = input(close, title="RSI Source")

rsi1 = rsi(src, lengthRSI)
k = sma(stoch(rsi1, rsi1, rsi1, lengthStoch), smoothK)
d = sma(k, smoothD)

//ATR
lengthATR = input(title="ATR Length", defval=14, minval=1)
atr = atr(lengthATR)

//MULTI EMA
emasrc = close,
len1 = input(8, minval=1, title="EMA 1")
len2 = input(14, minval=1, title="EMA 2")
len3 = input(50, minval=1, title="EMA 3")

ema1 = ema(emasrc, len1)
ema2 = ema(emasrc, len2)
ema3 = ema(emasrc, len3)

col1 = color.lime
col2 = color.blue
col3 = color.orange

//EMA Plots
//plot(ema1, title="EMA 1", linewidth=1, color=col1)
//plot(ema2, title="EMA 2", linewidth=1, color=col2)
//plot(ema3, title="EMA 3", linewidth=1, color=col3)

crossup = k[0] > d[0] and k[1] <= d[1]
emapos = ema1 > ema2 and ema2 > ema3 and close > ema1
barbuy = crossup and emapos

//plotshape(crossup, style=shape.triangleup, location=location.belowbar, color=color.white)
plotshape(barbuy, style=shape.triangleup, location=location.belowbar, color=color.green)

longloss = sma(open, 1)
//plot(longloss, color=color.red)

//Buy and Sell Factors
profitfactor = input(title="Profitfactor", type=input.float, step=0.1, defval=2)
stopfactor = input(title="Stopfactor", type=input.float, step=0.1, defval=3)
bought = strategy.position_size[1] < strategy.position_size
longcondition = barbuy

if (longcondition) and (afterStartDate) and strategy.opentrades < 1
    strategy.entry("Long", strategy.long)

if (afterStartDate) and strategy.opentrades > 0
    barsbought = barssince(bought)
    profit_level = strategy.position_avg_price + (atr*profitfactor)
    stop_level = strategy.position_avg_price - (atr*stopfactor)
    strategy.exit("Take Profit/ Stop Loss", "Long", stop=stop_level[barsbought], limit=profit_level[barsbought])
- दोहरे ईएमए क्रॉसओवर के गतिशील स्टॉप लॉस पर आधारित रणनीति के बाद की प्रवृत्ति
- बुल मार्केट ब्रेकआउट डार्वस बॉक्स खरीद रणनीति
- सापेक्ष गति रणनीति
- तरंग प्रवृत्ति और क्वांट रणनीति के बाद वीडब्ल्यूएमए आधारित प्रवृत्ति
- दोहरी चलती औसत और विलियम्स औसत संयोजन रणनीति
- अनुकूली त्रिगुट सुपरट्रेंड रणनीति
- चलती औसत क्रॉसओवर रणनीति
- बाज़ार साइफर तरंग बी स्वचालित व्यापार रणनीति
- महत्वपूर्ण रिवर्स बैकटेस्ट रणनीति
- गति के उलट व्यापार रणनीति
- अनुकूली रैखिक प्रतिगमन चैनल रणनीति
- चलती औसत अंतर शून्य क्रॉस रणनीति
- कई संकेतक रणनीति का पालन करते हैं
- रणनीति के बाद ठोस रुझान
- रणनीति का पालन करते हुए मूल्य क्रॉसिंग मूविंग एवरेज ट्रेंड
- दोहरी ईएमए गोल्डन क्रॉस ब्रेकआउट रणनीति