MTF RSI & Strategi STOCH
Penulis:ChaoZhang, Tanggal: 2022-05-10 10:41:43Tag:SMA
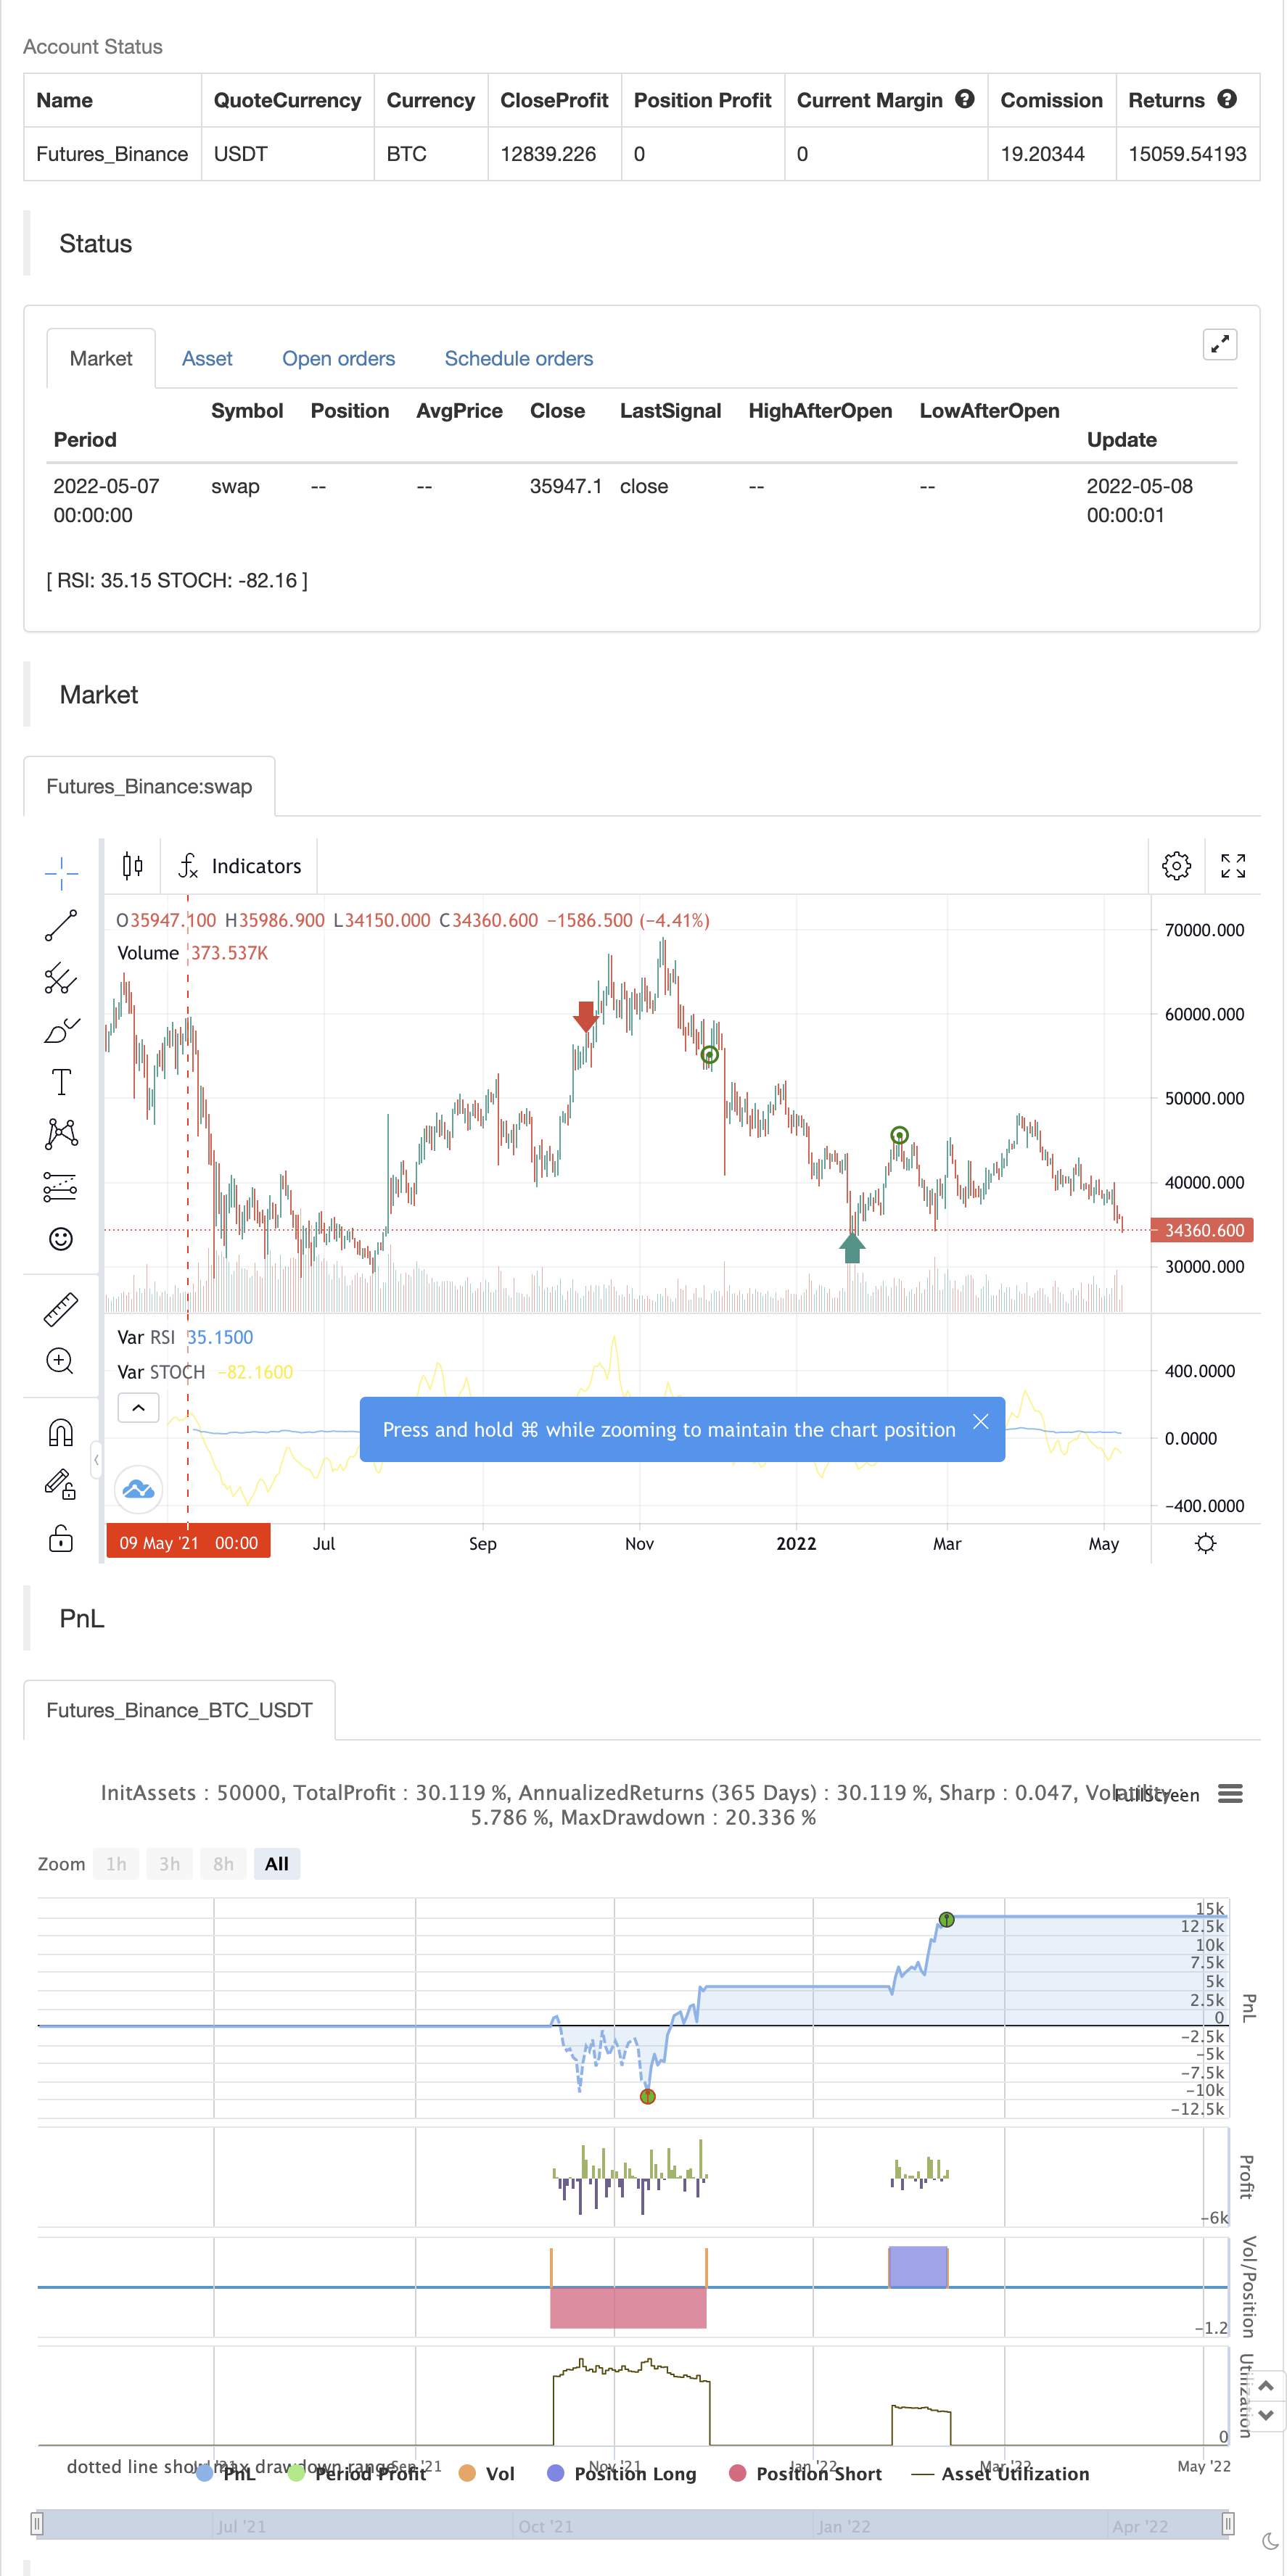
Berbagi ini adalah indikator di mana Anda dapat melihat rata-rata dari kerangka waktu yang berbeda.
RSI adalah garis biru Saham adalah garis kuning
Anda dapat mengelola kerangka waktu dalam parameter.
Strategi adalah mengambil posisi ketika kedua garis menjadi overbought atau oversold dan menutup ketika saham dan RSI pergi ke tengah.
backtest

/*backtest
start: 2021-05-09 00:00:00
end: 2022-05-08 23:59:00
period: 1d
basePeriod: 1h
exchanges: [{"eid":"Futures_Binance","currency":"BTC_USDT"}]
*/

////////////////////////////////////////// MTF Stochastic & RSI Strategy ©️ bykzis /////////////////////////////////////////
//

// *** Inspired by "Binance CHOP Dashboard" from @Cazimiro and "RSI MTF Table" from @mobester16 *** and LOT OF COPY of Indicator-Jones MTF Scanner
//
////////////////////////////////////////////////////////////////////////////////////////////////////////////////////////////

//@version=5
//strategy('MTF RSI & STOCH Strategy', overlay=false,initial_capital=100, currency=currency.USD, commission_value=0.01, commission_type=strategy.commission.percent)


// Pair list
var string GRP1       = '══════════    General    ══════════'
overbought = input.int(80, 'Overbought Level', minval=1, group=GRP1)
oversold = input.int(20, 'Oversold Level', minval=1, group=GRP1)


/// Timeframes
var string GRP2       = '══════════   Timeframes   ══════════'
timeframe1 = input.timeframe(title="Timeframe 1", defval="W", group=GRP2)
timeframe2 = input.timeframe(title="Timeframe 2", defval="D", group=GRP2)
timeframe3 = input.timeframe(title="Timeframe 3", defval="240", group=GRP2)
timeframe4 = input.timeframe(title="Timeframe 4", defval="60", group=GRP2)

// RSI settings
var string GRP3       = '══════════   RSI settings   ══════════'
rsiLength = input.int(14, minval=1, title='RSI length', group=GRP3)
rsiSource = input(close, 'RSI Source', group=GRP3)
rsioverbought = input.int(70, 'RSI Overbought Level', minval=1, group=GRP3)
rsioversold = input.int(30, 'RSI Oversold Level', minval=1, group=GRP3)


/// Get RSI values of each timeframe /////////////////////////////////////////////////////
rsi = ta.rsi(rsiSource, rsiLength)
callRSI(id,timeframe) =>
    rsiValue = request.security(id, str.tostring(timeframe), rsi, gaps=barmerge.gaps_off)
    rsiValue

RSI_TF1 = callRSI(syminfo.tickerid, timeframe1)
RSI_TF2 = callRSI(syminfo.tickerid, timeframe2)
RSI_TF3 = callRSI(syminfo.tickerid, timeframe3)
RSI_TF4 = callRSI(syminfo.tickerid, timeframe4)


/////// Calculate Averages /////////////////////////////////////////////////////////////////
calcAVG(valueTF1, valueTF2, valueTF3, valueTF4) =>
    math.round((valueTF1 + valueTF2 + valueTF3 + valueTF4) / 4, 2)

AVG=calcAVG(RSI_TF1, RSI_TF2, RSI_TF3, RSI_TF4)


// Stochastic settings
var string GRP4       = '══════════   Stochastic settings   ══════════'
periodK = input.int(14, '%K length', minval=1, group=GRP4)
smoothK = input.int(3, 'Smooth K', minval=1, group=GRP4)
stochSource = input(close, 'Stochastic Source', group=GRP4)
stochoverbought = input.int(70, 'Stochastic Overbought Level', minval=1, group=GRP4)
stochoversold = input.int(30, 'Stochastic Oversold Level', minval=1, group=GRP4)


/// Get Stochastic values of each timeframe ////////////////////////////////////////////////
stoch = ta.sma(ta.stoch(stochSource, high, low, periodK), smoothK)
getStochastic(id,timeframe) =>
    stochValue = request.security(id, str.tostring(timeframe), stoch, gaps=barmerge.gaps_off)
    stochValue

Stoch_TF1 = getStochastic(syminfo.tickerid, timeframe1)
Stoch_TF2 = getStochastic(syminfo.tickerid, timeframe2)
Stoch_TF3 = getStochastic(syminfo.tickerid, timeframe3)
Stoch_TF4 = getStochastic(syminfo.tickerid, timeframe4)


AVG_STOCH=calcAVG(Stoch_TF1, Stoch_TF2, Stoch_TF3, Stoch_TF4)


plot(AVG, color = color.blue, title='RSI')
plot(AVG_STOCH, color = color.yellow,title='STOCH')
hline(rsioverbought,color=color.red)
hline(rsioversold, color=color.lime)
hline(50, color=color.white)

//============ signal Generator ==================================//

if AVG <= rsioversold and AVG_STOCH <=stochoversold
    strategy.entry('Buy_Long', strategy.long)


strategy.close("Buy_Long",when=(AVG_STOCH >=70 and AVG >=50 and close >=strategy.position_avg_price),comment="Long_OK")

if AVG >=rsioverbought and AVG_STOCH >=stochoverbought
    strategy.entry('Buy_Short', strategy.short)


strategy.close("Buy_Short",when=(AVG_STOCH <=30 and AVG <=50 and close <=strategy.position_avg_price),comment="Short_OK")


///////////////////////////////////////////////////////////////////////////////////////////
Artikel terkait
- Pengertian Tren Multidimensional dan Strategi Stop Loss Dinamis ATR
- Strategi perdagangan kuantitatif untuk beradaptasi dengan tren reversing BRI
- Tren multi-indikator tinggi mengkonfirmasi strategi perdagangan
- Strategi perdagangan tren sinyal ganda rata-rata-RSI
- Strategi pelacakan tren adaptif dan konfirmasi transaksi ganda
- Strategi pelacakan tren bentuk pilar gajah
- Strategi perdagangan kuantitatif dengan RSI dinamis yang dibantu dengan cross-linear multi-uniform
- Algorithm K-Neighborhood Multidimensional dan Strategi Perdagangan Analisis Harga Kuantitatif
- Strategi stop loss pelacakan cerdas berdasarkan rata-rata bergerak dan pola harian
- Adaptive Multi-Strategy Dynamic Switching System: Strategi perdagangan kuantitatif untuk melacak tren konvergensi dan gesekan interval
- Tren multi-indikator multi-dimensi lintas strategi kuantifikasi tingkat lanjut
Informasi lebih lanjut
- Fraktal Lebih Kecil (+ Transparansi)
- Titik Masuk BB-RSI-ADX
- Hull-4ema
- Angka Serangan Ikuti Indikator Garis
- KijunSen Line dengan Cross
- AMACD - Divergensi semua rata-rata konvergensi bergerak
- MA HYBRID BY RAJ
- Tren Berlian
- Nik Stoch
- Stoch supertrd ATR 200ma
- EMA + AROON + ASH
- Momentum 2.0
- Strategi Jangkauan EHMA
- Moving Average Beli-Jual
- Midas Mk. II - Ultimate Crypto Swing
- TMA-Legacy
- Strategi TV Tinggi dan Rendah
- Strategi TradingView Terbaik
- Large Snapper Alerts R3.0 + Kondisi Volatilitas Chaiking + TP RSI
- Chande Kroll Berhenti