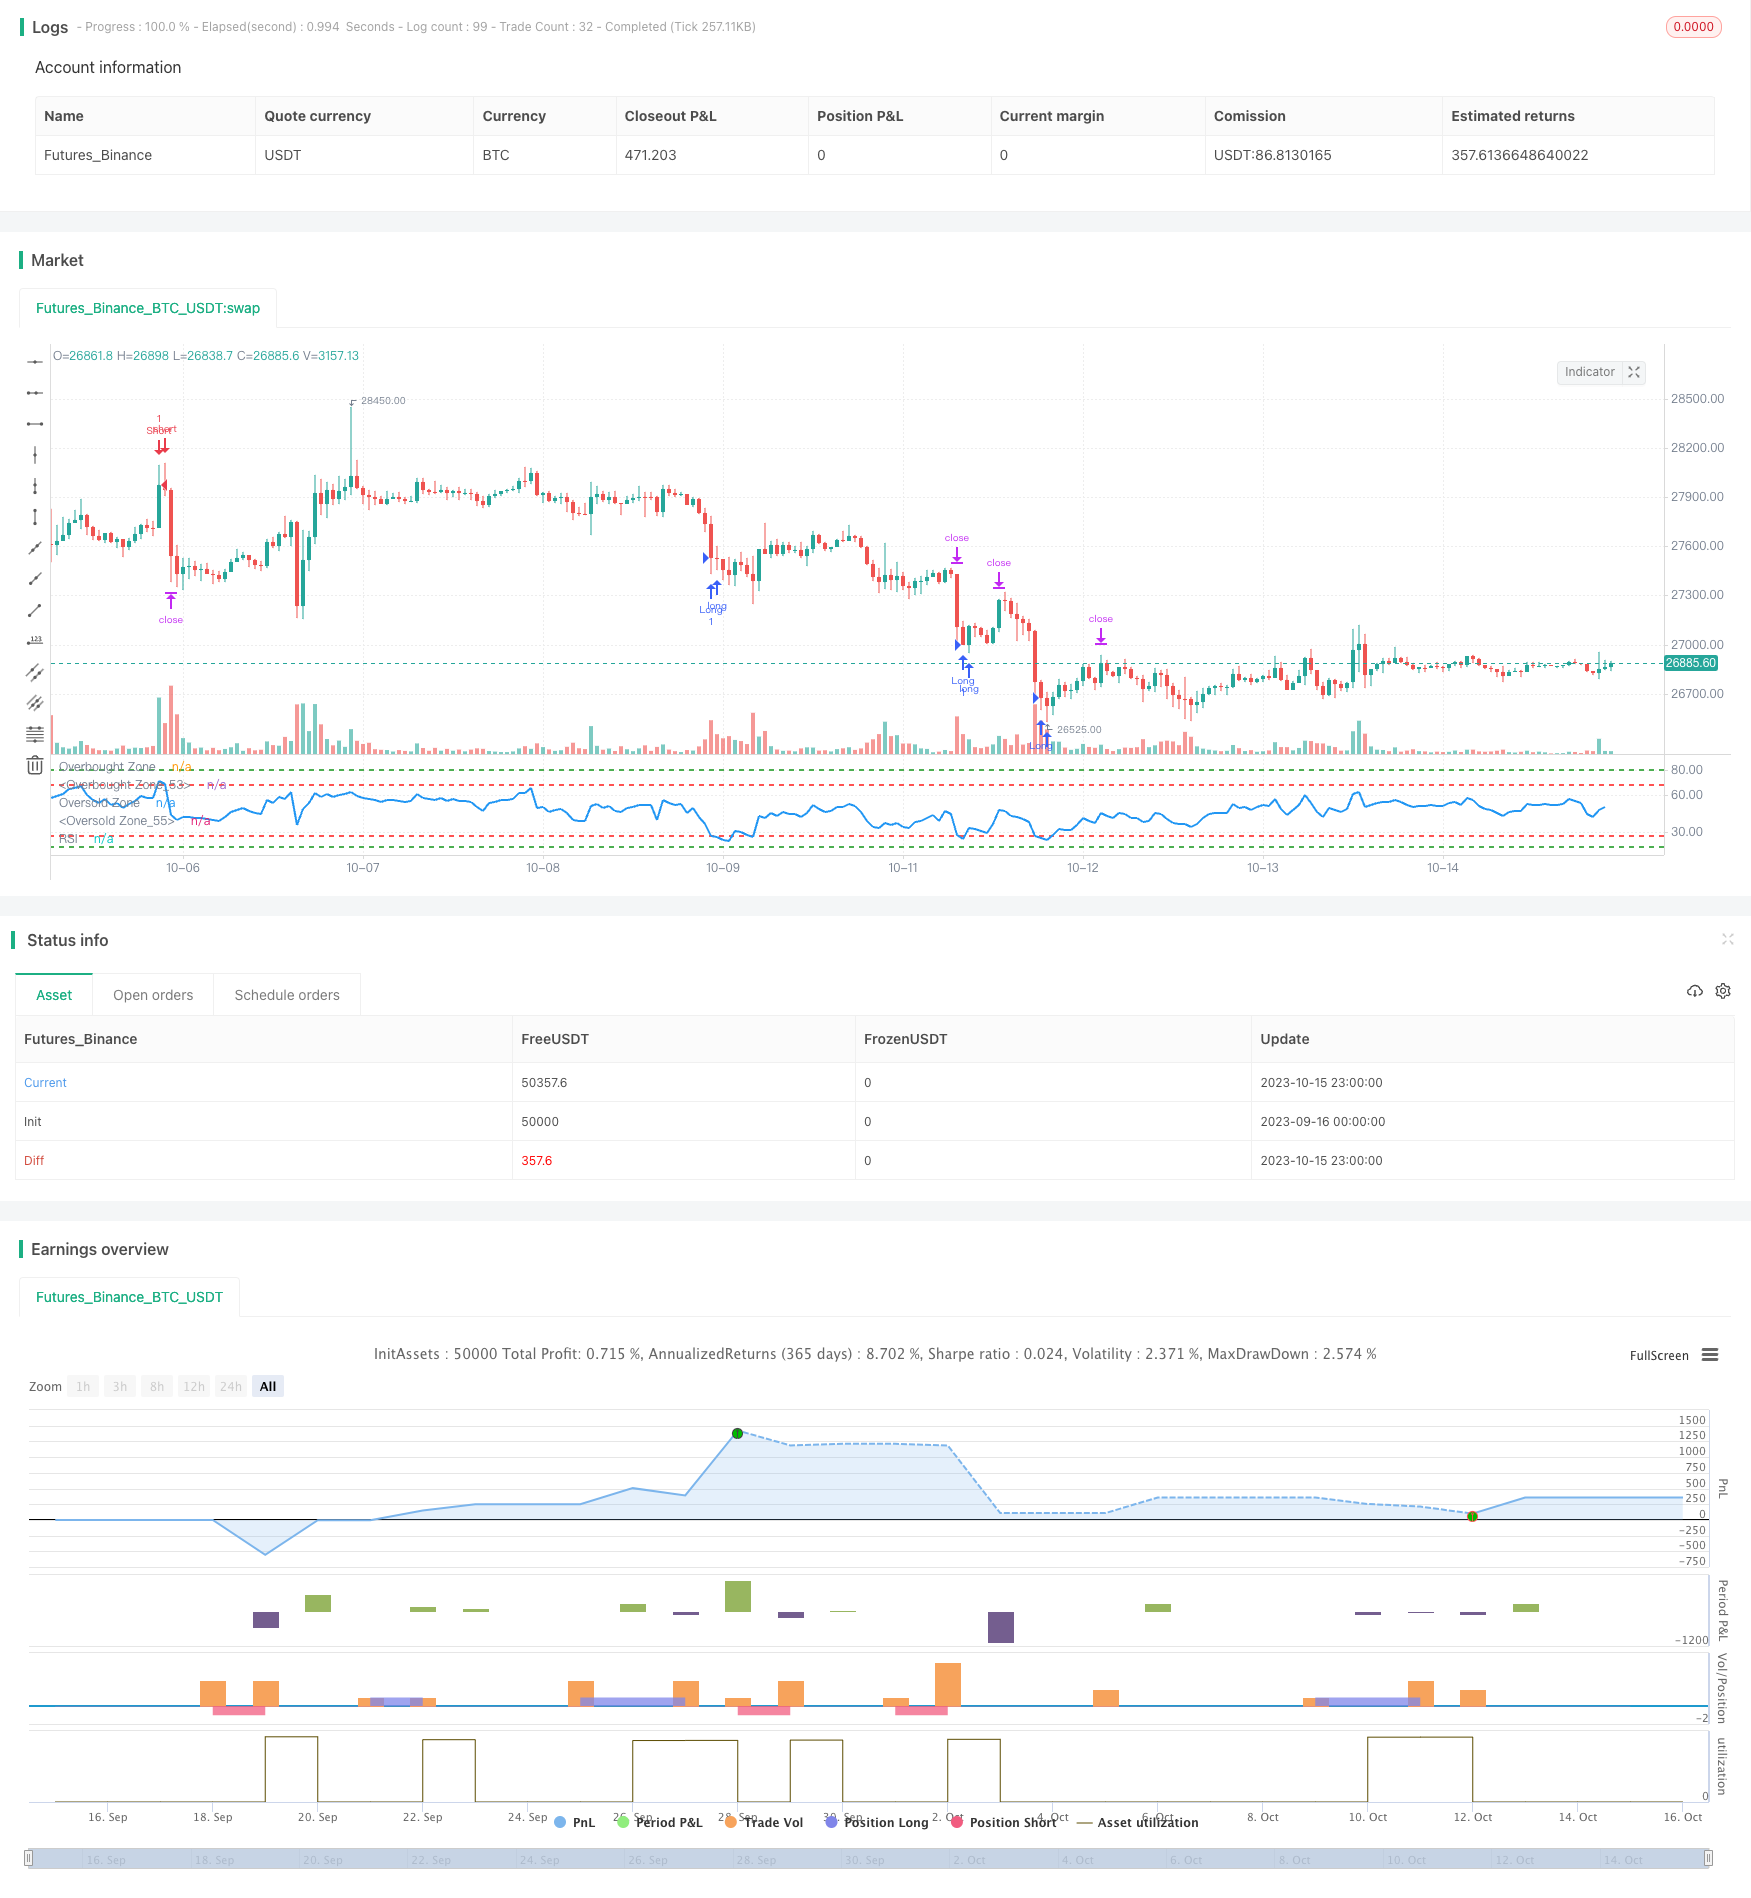
Algoritma RSI Range Breakout Strategi
Penulis:ChaoZhang, Tanggal: 2023-10-17 17:14:09Tag:

Gambaran umum
Strategi ini memantau penyebaran indikator RSI dalam kisaran yang berbeda untuk menerapkan membeli rendah dan menjual tinggi.
Logika Strategi
-
Tetapkan periode RSI menjadi 14
-
Tentukan rentang sinyal RSI:
- Rentang 1: RSI <= 27
- Jangkauan 2: RSI <= 18
-
Tentukan rentang sinyal jual RSI:
- Jangkauan 1: RSI >= 68
- Jangkauan 2: RSI >= 80
-
Ketika RSI memasuki rentang beli, pergi panjang:
- Jika RSI memasuki kisaran 1 (di bawah 27), pergi panjang 1 lot
- Jika RSI memasuki kisaran 2 (di bawah 18), pergi panjang tambahan 1 lot
-
Ketika RSI memasuki rentang jual, pergi pendek:
- Jika RSI memasuki kisaran 1 (di atas 68), pergi pendek 1 lot
- Jika RSI memasuki kisaran 2 (di atas 80), pergi lebih pendek 1 lot
-
Setel fixed take profit ke 2500 pips dan stop loss ke 5000 pips
-
Posisi tutup ketika RSI keluar dari kisaran sinyal
Analisis Keuntungan
-
Pengaturan rentang ganda membantu mengidentifikasi kondisi overbought dan oversold dengan lebih baik, menghindari kehilangan peluang pembalikan
-
Mengadopsi fixed take profit dan stop loss dalam pips mencegah mengejar tren terlalu banyak
-
RSI adalah osilator yang matang dalam mengidentifikasi tingkat overbought dan oversold dengan keuntungan dibandingkan indikator lain
-
Dengan penyesuaian parameter yang tepat, strategi ini dapat secara efektif menangkap titik pembalikan tren dan menghasilkan hasil yang berlebihan
Analisis Risiko
-
RSI divergensi dapat terjadi yang mengarah pada kerugian berturut-turut dari posisi pendek berkelanjutan
-
Fixed take profit dan stop loss mungkin tidak sesuai dengan volatilitas pasar, tidak dapat memperoleh keuntungan atau berhenti sebelum waktunya
-
Pengaturan rentang yang tidak tepat dapat menyebabkan perdagangan yang hilang atau perdagangan yang sering tidak menguntungkan
-
Strategi ini sangat bergantung pada optimasi parameter berdasarkan backtest.
Arahan Optimasi
-
Efektivitas pengujian RSI dengan panjang periode yang berbeda
-
Mengoptimalkan nilai rentang beli dan jual agar sesuai dengan karakteristik produk yang berbeda
-
Penelitian dinamis mengambil keuntungan dan menghentikan kerugian untuk meningkatkan profitabilitas dan kelayakan
-
Pertimbangkan untuk menggabungkan indikator lain untuk perdagangan bersama untuk meningkatkan ketahanan
-
Jelajahi teknik pembelajaran mesin untuk mengoptimalkan rentang parameter secara otomatis untuk ketahanan
Kesimpulan
Strategi ini didasarkan pada prinsip RSI
/*backtest
start: 2023-09-16 00:00:00
end: 2023-10-16 00:00:00
period: 1h
basePeriod: 15m
exchanges: [{"eid":"Futures_Binance","currency":"BTC_USDT"}]
*/

// This source code is subject to the terms of the Mozilla Public License 2.0 at https://mozilla.org/MPL/2.0/
// © Rawadabdo

// Ramy's Algorithm

//@version=5
strategy("BTC/USD - RSI", overlay=false, initial_capital = 5000)

// User input
length = input(title = "Length", defval=14, tooltip="RSI period")

first_buy_level = input(title = "Buy Level 1", defval=27, tooltip="Level where 1st buy triggers")
second_buy_level = input(title = "Buy Level 2", defval=18, tooltip="Level where 2nd buy triggers")

first_sell_level = input(title = "Sell Level 1", defval=68, tooltip="Level where 1st sell triggers")
second_sell_level = input(title = "Sell Level 2", defval=80, tooltip="Level where 2nd sell triggers")

takeProfit= input(title="target Pips", defval=2500, tooltip="Fixed pip stop loss distance")
stopLoss = input(title="Stop Pips", defval=5000, tooltip="Fixed pip stop loss distance")

lot = input(title = "Lot Size", defval = 1, tooltip="Trading Lot size")

// Get RSI
vrsi = ta.rsi(close, length)

// Entry Conditions
long1 = (vrsi <= first_buy_level and vrsi>second_buy_level)
long2 = (vrsi <= second_buy_level)

short1= (vrsi >= first_sell_level and vrsi<second_sell_level)
short2= (vrsi >= second_sell_level)


// Entry Orders
// Buy Orders
if (long1 and strategy.position_size == 0)
    strategy.entry("Long", strategy.long, qty=lot, comment="Buy")
    if (long2 and  strategy.position_size == 0)
        strategy.entry("Long", strategy.long, qty=lot, comment="Buy")

// Short Orders
if (short1 and strategy.position_size == 0)
    strategy.entry("Short", strategy.short,qty=lot, comment="Sell")
    if (short2 and strategy.position_size == 0)
        strategy.entry("Short", strategy.short,qty=lot, comment="Sell")

// Exit our trade if our stop loss or take profit is hit
strategy.exit(id="Long Exit", from_entry="Long",qty = lot, profit=takeProfit, loss=stopLoss)
strategy.exit(id="Short Exit", from_entry="Short", qty = lot, profit=takeProfit, loss=stopLoss)

// plot data to the chart
hline(first_sell_level, "Overbought Zone", color=color.red, linestyle=hline.style_dashed, linewidth = 2)
hline(second_sell_level, "Overbought Zone", color=color.green, linestyle=hline.style_dashed, linewidth = 2)
hline(first_buy_level, "Oversold Zone", color=color.red, linestyle=hline.style_dashed, linewidth = 2)
hline(second_buy_level, "Oversold Zone", color=color.green, linestyle=hline.style_dashed, linewidth = 2)
plot (vrsi, title = "RSI", color = color.blue, linewidth=2)
- Strategi Beli dan Jual Multi-Indikator
- Strategi trading open-high cross over
- Strategi Double K Crossbow
- Strategi Crossover Indeks Tubuh Relatif
- Strategi Perdagangan Robot Batch Take Profit BTC Berbagai Tingkat
- Strategi perdagangan pembalikan rata-rata bergerak ganda dan RSI
- Strategi Sistem Band Bollinger Dual Moving Average
- Strategi Backtesting Terobosan Arsitektur
- Strategi Breakout Berdasarkan Perdagangan Penyu
- Tren DEMA Mengikuti Strategi
- RSI Rising Crypto Trending Strategi
- EMA Slope Cross Trend Mengikuti Strategi
- Strategi perdagangan RSI intraday TAM
- Strategi Crossover Rata-rata Bergerak Eksponensial
- Strategi Crossover Rata-rata Bergerak
- Strategi Pelacakan
- Model Pemantauan Rata-rata Bergerak Ganda
- Strategi Reversi Rata-rata Berdasarkan ATR
- Tren Volume Relatif Setelah Strategi Perdagangan
- Strategi Pengimbangan Tren MACD