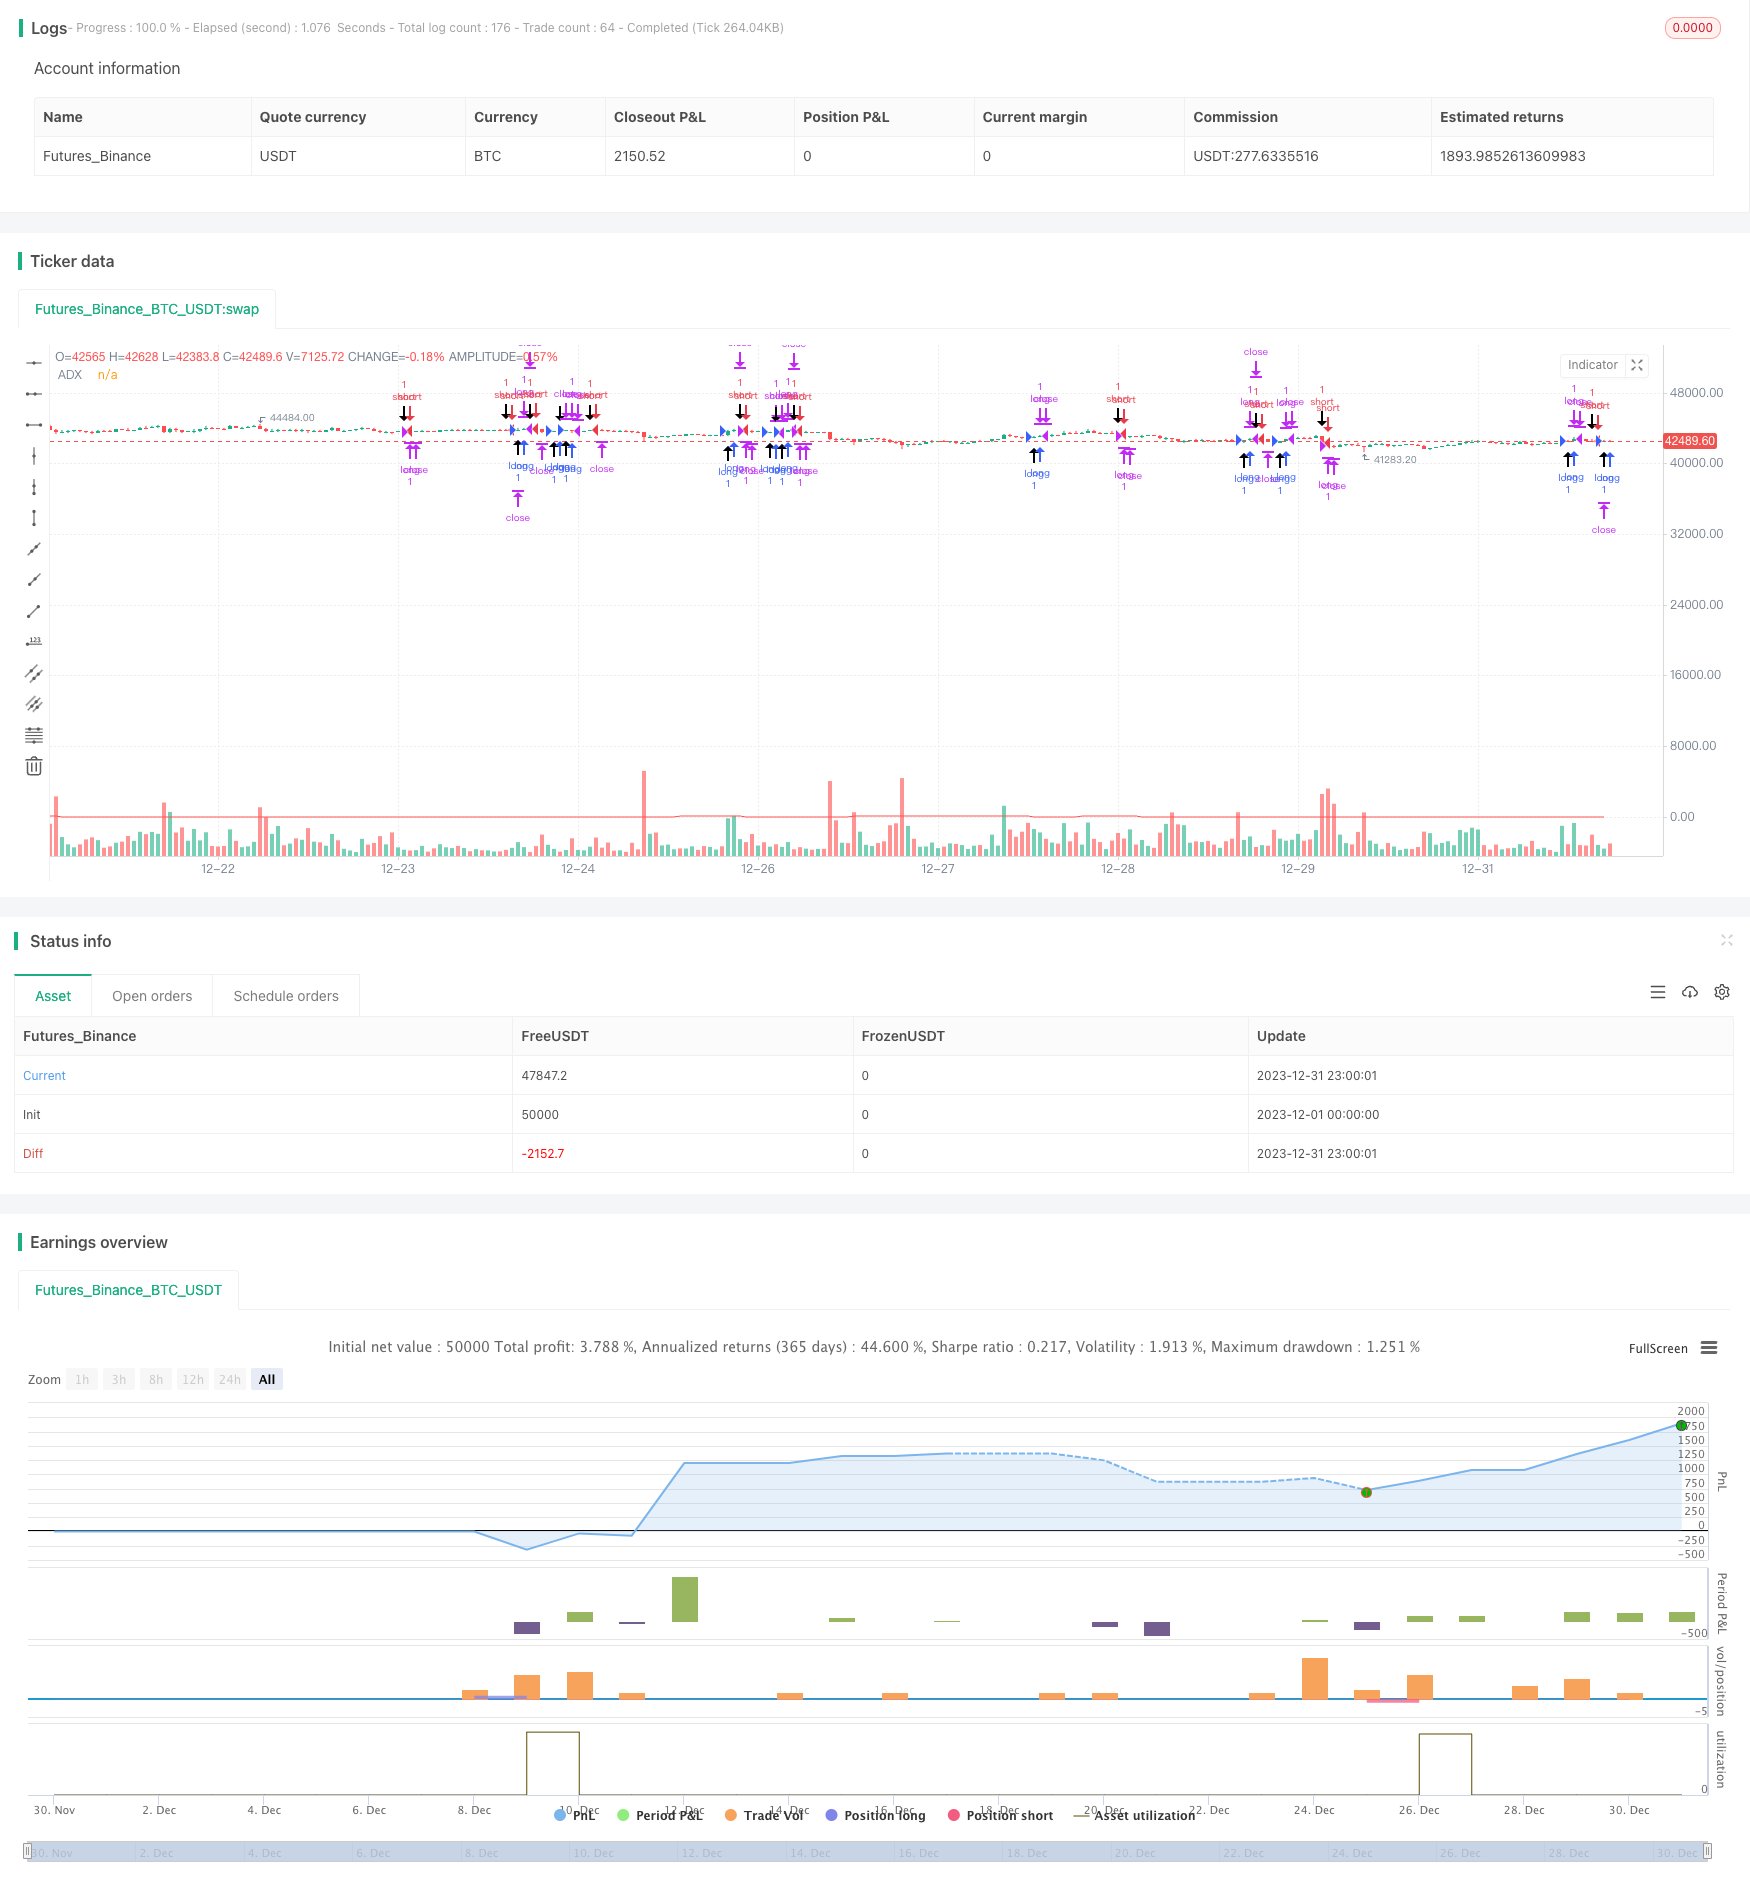
Strategi mengikuti tren minyak mentah berdasarkan indikator ADX

Ringkasan
Strategi ini didasarkan pada strategi perdagangan futures minyak mentah gratis oleh Kevin Davey. Strategi ini menggunakan indikator ADX untuk menilai tren pasar minyak mentah, yang dikombinasikan dengan prinsip terobosan harga, untuk mewujudkan strategi perdagangan otomatis minyak mentah yang sederhana dan praktis.
Prinsip Strategi
- Perhitungan indikator ADX 14 siklus
- Ketika ADX > 10, berarti ada tren
- Jika harga penutupan lebih tinggi dari harga penutupan sebelum 65 garis K, ini menunjukkan bahwa harga telah terobosan, yang merupakan sinyal untuk posisi panjang
- Jika harga penutupan lebih rendah dari harga penutupan sebelum 65 garis K, ini menunjukkan bahwa harga telah terobosan, yang merupakan sinyal untuk posisi pendek.
- Set Stop Loss dan Stop Stop Setelah Masuk
Strategi ini terutama bergantung pada indikator ADX untuk menilai tren dan menghasilkan sinyal perdagangan berdasarkan terobosan harga dalam siklus tetap dalam situasi tren. Seluruh logika strategi sangat sederhana dan jelas.
Analisis Keunggulan Strategi
- Menggunakan ADX untuk menilai tren, hindari kehilangan peluang tren
- Penembusan harga siklus tetap menghasilkan sinyal, pengukuran kembali lebih baik
- Kode intuitif, sederhana, mudah dipahami dan dimodifikasi
- Kevin Davey: Bertahun-tahun di laboratorium, tidak sesuai dengan kurva
Analisis Risiko Strategi
- ADX sebagai indikator utama, sensitif terhadap pengambilan parameter dan pengambilan siklus terobosan
- Penembusan siklus tetap mungkin melewatkan beberapa kesempatan
- Stop loss yang tidak tepat dapat meningkatkan kerugian
- Kemungkinan adanya perbedaan antara efek pada cakram dan pengukuran kembali
Arah optimasi strategi
- Optimalkan parameter ADX dan siklus terobosan
- Peningkatan perubahan dinamika kepemilikan
- Strategi yang terus diubah dan disempurnakan berdasarkan hasil pengujian dan verifikasi di lapangan
- Memperkenalkan teknologi pembelajaran mesin dan pembelajaran mendalam untuk optimasi strategi
Meringkaskan
Strategi ini secara keseluruhan adalah strategi perdagangan minyak mentah yang sangat praktis. Strategi ini menggunakan indikator ADX untuk menilai tren yang sangat masuk akal, prinsip terobosan harga sederhana dan efektif, dan pengembalian yang baik. Selain itu, sebagai strategi gratis terbuka dari Kevin Davey, ia memiliki keandalan praktis yang kuat.
/*backtest
start: 2023-12-01 00:00:00
end: 2023-12-31 23:59:59
period: 1h
basePeriod: 15m
exchanges: [{"eid":"Futures_Binance","currency":"BTC_USDT"}]
*/

// Strategy idea coded from EasyLanguage to Pinescript
//@version=5
strategy("Kevin Davey Crude free crude oil strategy", shorttitle="CO Fut", format=format.price, precision=2, overlay = true, calc_on_every_tick = true)
adxlen = input(14, title="ADX Smoothing")
dilen = input(14, title="DI Length")
dirmov(len) =>
	up = ta.change(high)
	down = -ta.change(low)
	plusDM = na(up) ? na : (up > down and up > 0 ? up : 0)
	minusDM = na(down) ? na : (down > up and down > 0 ? down : 0)
	truerange = ta.rma(ta.tr, len)
	plus = fixnan(100 * ta.rma(plusDM, len) / truerange)
	minus = fixnan(100 * ta.rma(minusDM, len) / truerange)
	[plus, minus]
adx(dilen, adxlen) =>
	[plus, minus] = dirmov(dilen)
	sum = plus + minus
	adx = 100 * ta.rma(math.abs(plus - minus) / (sum == 0 ? 1 : sum), adxlen)
sig = adx(dilen, adxlen)
plot(sig, color=color.red, title="ADX")

buy = sig > 10 and (close - close[65]) > 0 and (close - close[65])[1] < 0
sell = sig > 10 and (close - close[65]) < 0 and (close - close[65])[1] > 0

plotshape(buy, style = shape.arrowup, location = location.belowbar,size = size.huge)
plotshape(sell, style = shape.arrowdown, location = location.abovebar,size = size.huge)

if buy
	strategy.entry("long", strategy.long)
if sell
	strategy.entry("short", strategy.short)

if strategy.position_size != 0
	strategy.exit("long", profit = 450, loss = 300)
	strategy.exit("short", profit = 450, loss = 300)


// GetTickValue() returns the currency value of the instrument's
// smallest possible price movement.
GetTickValue() =>
    syminfo.mintick * syminfo.pointvalue

// On the last historical bar, make a label to display the
// instrument's tick value
if barstate.islastconfirmedhistory
    label.new(x=bar_index + 1, y=close, style=label.style_label_left,
         color=color.black, textcolor=color.white, size=size.large,
         text=syminfo.ticker + " has a tick value of:\n" +
             syminfo.currency + " " + str.tostring(GetTickValue()))