Triple Exponential Moving Average Profit Taking dan Stop Loss Strategy
Penulis:ChaoZhang, Tanggal: 2024-02-04 10:38:42Tag:

Gambaran umum
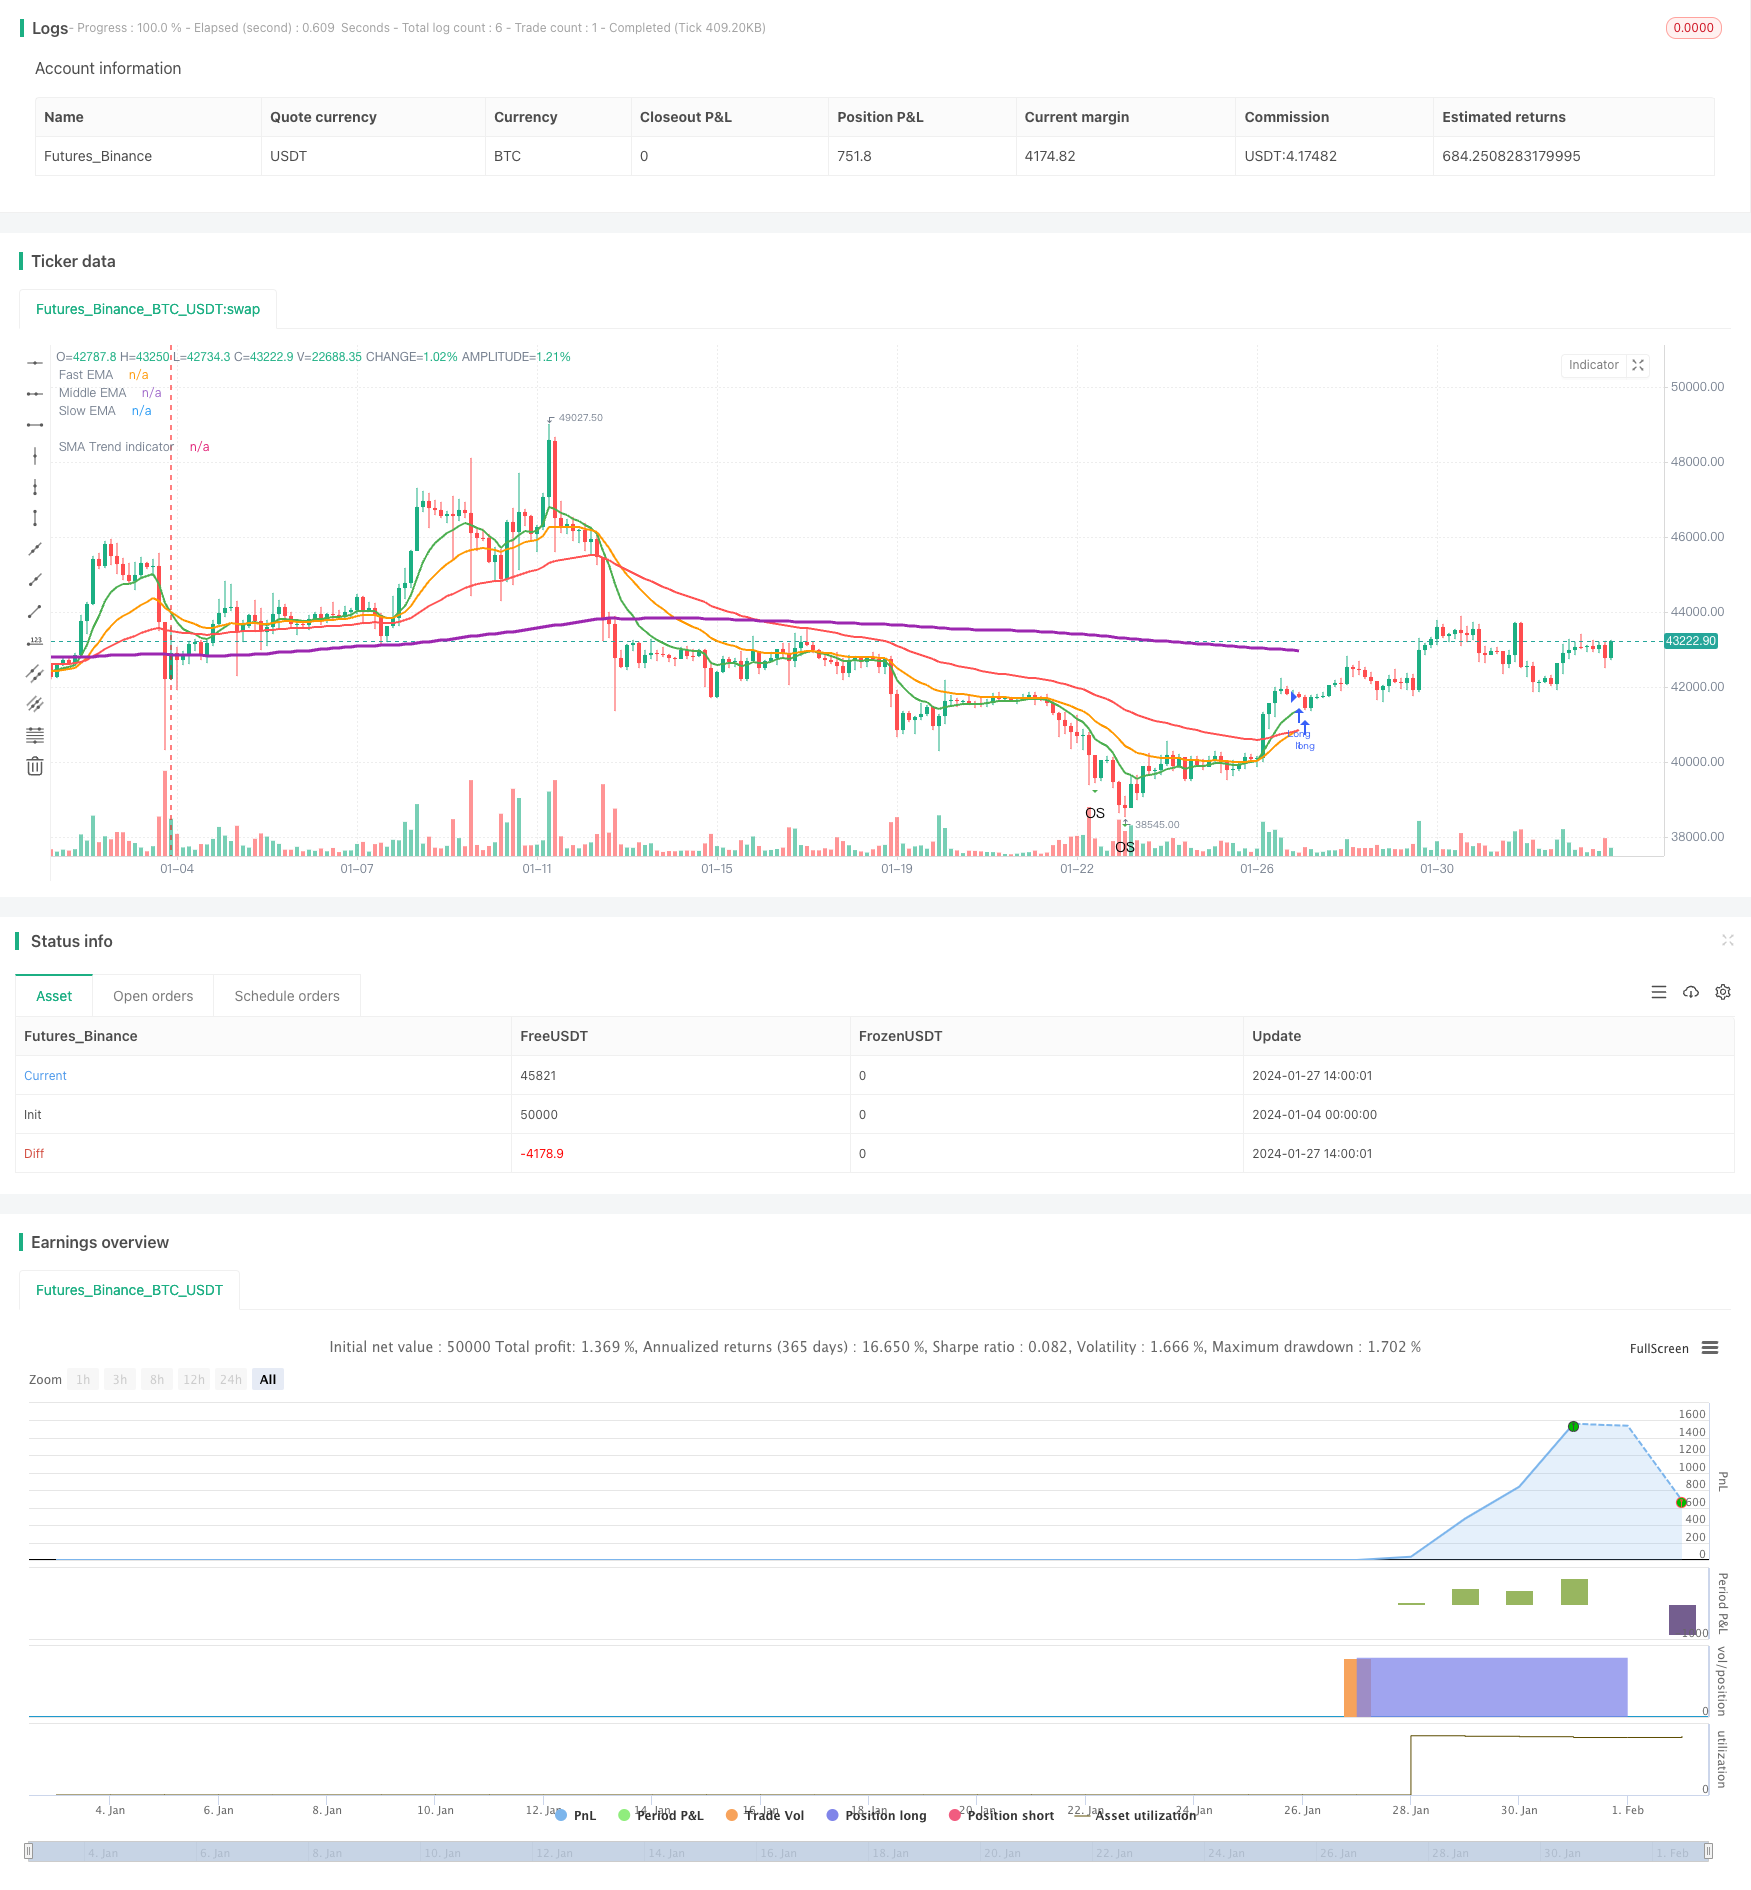
Triple Exponential Moving Average Profit Taking and Stop Loss Strategy adalah strategi trend-following yang didasarkan pada tiga moving average eksponensial dengan periode yang berbeda untuk masuk dan keluar pasar.
Logika Strategi
Strategi ini menggunakan tiga rata-rata bergerak eksponensial: garis cepat, garis tengah, dan garis lambat. Ia pergi panjang ketika garis tengah melintasi di atas garis lambat, dan menutup posisi ketika garis cepat melintasi di bawah garis tengah. Ini adalah strategi trend-mengikuti khas yang menentukan arah tren melalui penyeberangan tiga rata-rata bergerak.
Pada saat yang sama, strategi memanfaatkan indikator Average True Range untuk menghitung tingkat profit-taking dan stop-loss. Secara khusus, take profit untuk posisi panjang adalah harga masuk + Average True Range * faktor keuntungan, dan untuk posisi pendek adalah harga masuk - Average True Range * faktor keuntungan. Logika stop loss serupa. Ini secara efektif membatasi risiko kerugian besar.
Analisis Keuntungan
- Indikator keputusan intuitif dan mudah dipahami.
- Sistematis dan mudah untuk mengotomatisasi.
- Mengimbangi trend-mengikuti dan pengendalian risiko.
Analisis Risiko
- Ada beberapa keterlambatan dan ketidakmampuan untuk menangkap pembalikan tepat waktu.
- Kemungkinan untuk menghentikan kerugian di pasar yang berbeda.
- Pengaturan parameter membutuhkan optimasi, jika tidak hasil mungkin buruk.
Langkah-langkah mitigasi risiko meliputi: memperpendek periode rata-rata bergerak, mengoptimalkan faktor profit/stop, dan menambahkan indikator tambahan.
Arahan Optimasi
- Uji kombinasi rata-rata bergerak untuk menemukan parameter optimal.
- Tambahkan indikator teknis lainnya seperti MACD, RSI dll.
- Gunakan pembelajaran mesin untuk mengoptimalkan parameter secara otomatis.
- Sesuaikan tingkat profit/stop secara dinamis berdasarkan rentang yang sebenarnya.
- Masukkan perasaan untuk menghindari kerumunan.
Kesimpulan
Secara keseluruhan ini adalah strategi trend-mengikuti yang efektif dengan kinerja yang stabil dan penerapan mudah melalui parameter sederhana. mengambil keuntungan dinamis dan stop loss berdasarkan Rata-rata True Range membatasi risiko per sisi. tetapi optimasi parameter dan kombinasi indikator perlu dilakukan dengan hati-hati untuk mencegah overfit atau keputusan lag. pada keseimbangan, strategi ini memiliki profil risiko-manfaat yang baik dan layak dipertimbangkan.
/*backtest
start: 2024-01-04 00:00:00
end: 2024-02-03 00:00:00
period: 3h
basePeriod: 15m
exchanges: [{"eid":"Futures_Binance","currency":"BTC_USDT"}]
*/

//@version=4
//© Densz
strategy("3EMA with TP & SL (ATR)", overlay=true )

// INPUTS
startTime           =       input(title="Start Time", type = input.time, defval = timestamp("01 Jan 2017 00:00 +0000"))
endTime             =       input(title="End Time", type = input.time, defval = timestamp("01 Jan 2022 00:00 +0000"))

slowEMALength       =       input(title="Slow EMA Length", type = input.integer, defval = 55)
middleEMALength     =       input(title="Middle EMA Length", type = input.integer, defval = 21)
fastEMALength       =       input(title="Fast EMA Length", type = input.integer, defval = 9)

trendMALength       =       input(title="Trend indicator MA Length", type = input.integer, defval = 200)

atrLength           =       input(title="ATR Length", type = input.integer, defval = 14)
tpATRMult           =       input(title="Take profit ATR multiplier", type = input.integer, defval = 3)
slATRMult           =       input(title="Stop loss ATR multiplier", type = input.integer, defval = 2)

rsiLength           =       input(title="RSI Length", type = input.integer, defval = 14)

// Indicators
slowEMA             =       ema(close, slowEMALength)
middEMA             =       ema(close, middleEMALength)
fastEMA             =       ema(close, fastEMALength)
atr                 =       atr(atrLength)

rsiValue            =       rsi(close, rsiLength)
isRsiOB             =       rsiValue >= 80
isRsiOS             =       rsiValue <= 20

sma200              =       sma(close, trendMALength)

inDateRange         =       true

// Plotting
plot(slowEMA, title="Slow EMA", color=color.red, linewidth=2, transp=50)
plot(middEMA, title="Middle EMA", color=color.orange, linewidth=2, transp=50)
plot(fastEMA, title="Fast EMA", color=color.green, linewidth=2, transp=50)

plot(sma200, title="SMA Trend indicator", color=color.purple, linewidth=3, transp=10)
plotshape(isRsiOB, title="Overbought", location=location.abovebar, color=color.red, transp=0, style=shape.triangledown, text="OB")
plotshape(isRsiOS, title="Oversold", location=location.belowbar, color=color.green, transp=0, style=shape.triangledown, text="OS")

float takeprofit    =       na
float stoploss      =       na

var line tpline     =       na
var line slline     =       na

if strategy.position_size != 0
    takeprofit := takeprofit[1]
    stoploss := stoploss[1]
    line.set_x2(tpline, bar_index)
    line.set_x2(slline, bar_index)
    line.set_extend(tpline, extend.none)
    line.set_extend(slline, extend.none)

// STRATEGY
goLong  = crossover(middEMA, slowEMA) and inDateRange
closeLong = crossunder(fastEMA, middEMA) and inDateRange


if goLong
    takeprofit := close + atr * tpATRMult
    stoploss := close - atr * slATRMult
    // tpline := line.new(bar_index, takeprofit, bar_index, takeprofit, color=color.green, width=2, extend=extend.right, style=line.style_dotted)
    // slline := line.new(bar_index, stoploss, bar_index, stoploss, color=color.red, width=2, extend=extend.right, style=line.style_dotted)
    // label.new(bar_index, takeprofit, "TP", style=label.style_labeldown)
    // label.new(bar_index, stoploss, "SL", style=label.style_labelup)
    strategy.entry("Long", strategy.long, when = goLong)
    strategy.exit("TP/SL", "Long", stop=stoploss, limit=takeprofit)
if closeLong
    takeprofit := na
    stoploss := na
    strategy.close(id = "Long", when = closeLong)

if (not inDateRange)
    strategy.close_all()
- SMA Crossover Bullish Trend Mengikuti Strategi
- Bollinger Bands Breakout Strategi Perdagangan Kuantitatif
- Tren Mengikuti Strategi Berdasarkan SMA Multi-Periode
- Ichimoku Breakout Strategy Berdasarkan Sentimen Pasar
- Strategi Perdagangan Kuantitatif Multi-Indikator Dinamis
- Coral Trend Pullback Strategi
- Strategi Swing Trading Berdasarkan Momentum
- Momentum Breakout Trading Strategi
- Trend Riding RSI Swing Capture Strategi
- Strategi Bollinger Bands SAR Parabolik Dual-Rail
- Strategi perdagangan lebar saluran Donchian
- Strategi Crossover Rata-rata Gerak yang Dioptimalkan
- Strategi Pelacakan Osilasi Pita Isolasi
- Strategi Double Donchian Channel Breakout
- Strategi rata-rata bergerak CRSI
- Strategi Perdagangan Jaringan Kuantum yang Beradaptasi Sendiri
- Strategi gabungan Ichimoku, MACD dan DMI Multi-Timeframe
- Strategi Trading Tren Berdasarkan Divergensi Harga
- Supertrend Bitcoin Long Line Strategi
- Tren Mengikuti Strategi dengan Moving Average dan Pola Candlestick