ホードルライン
作者: リン・ハーンチャオチャン, 日付: 2022-05-20 16:58:28タグ:HMA
この指標は,買取・保有投資家が資産を保有できるブール市場の期間と,保有しないべきベア市場の期間を決定する.主に仮想通貨を念頭に置いて設計されたものの,どの市場でも成功裏に使用できます. 技術的には,この指標は,市場の売り上げが上昇傾向よりも鋭い傾向にあるという事実を考慮することを目的とした非対称的なトレンドフィルターである.このアルゴリズムは2つの制度がある.
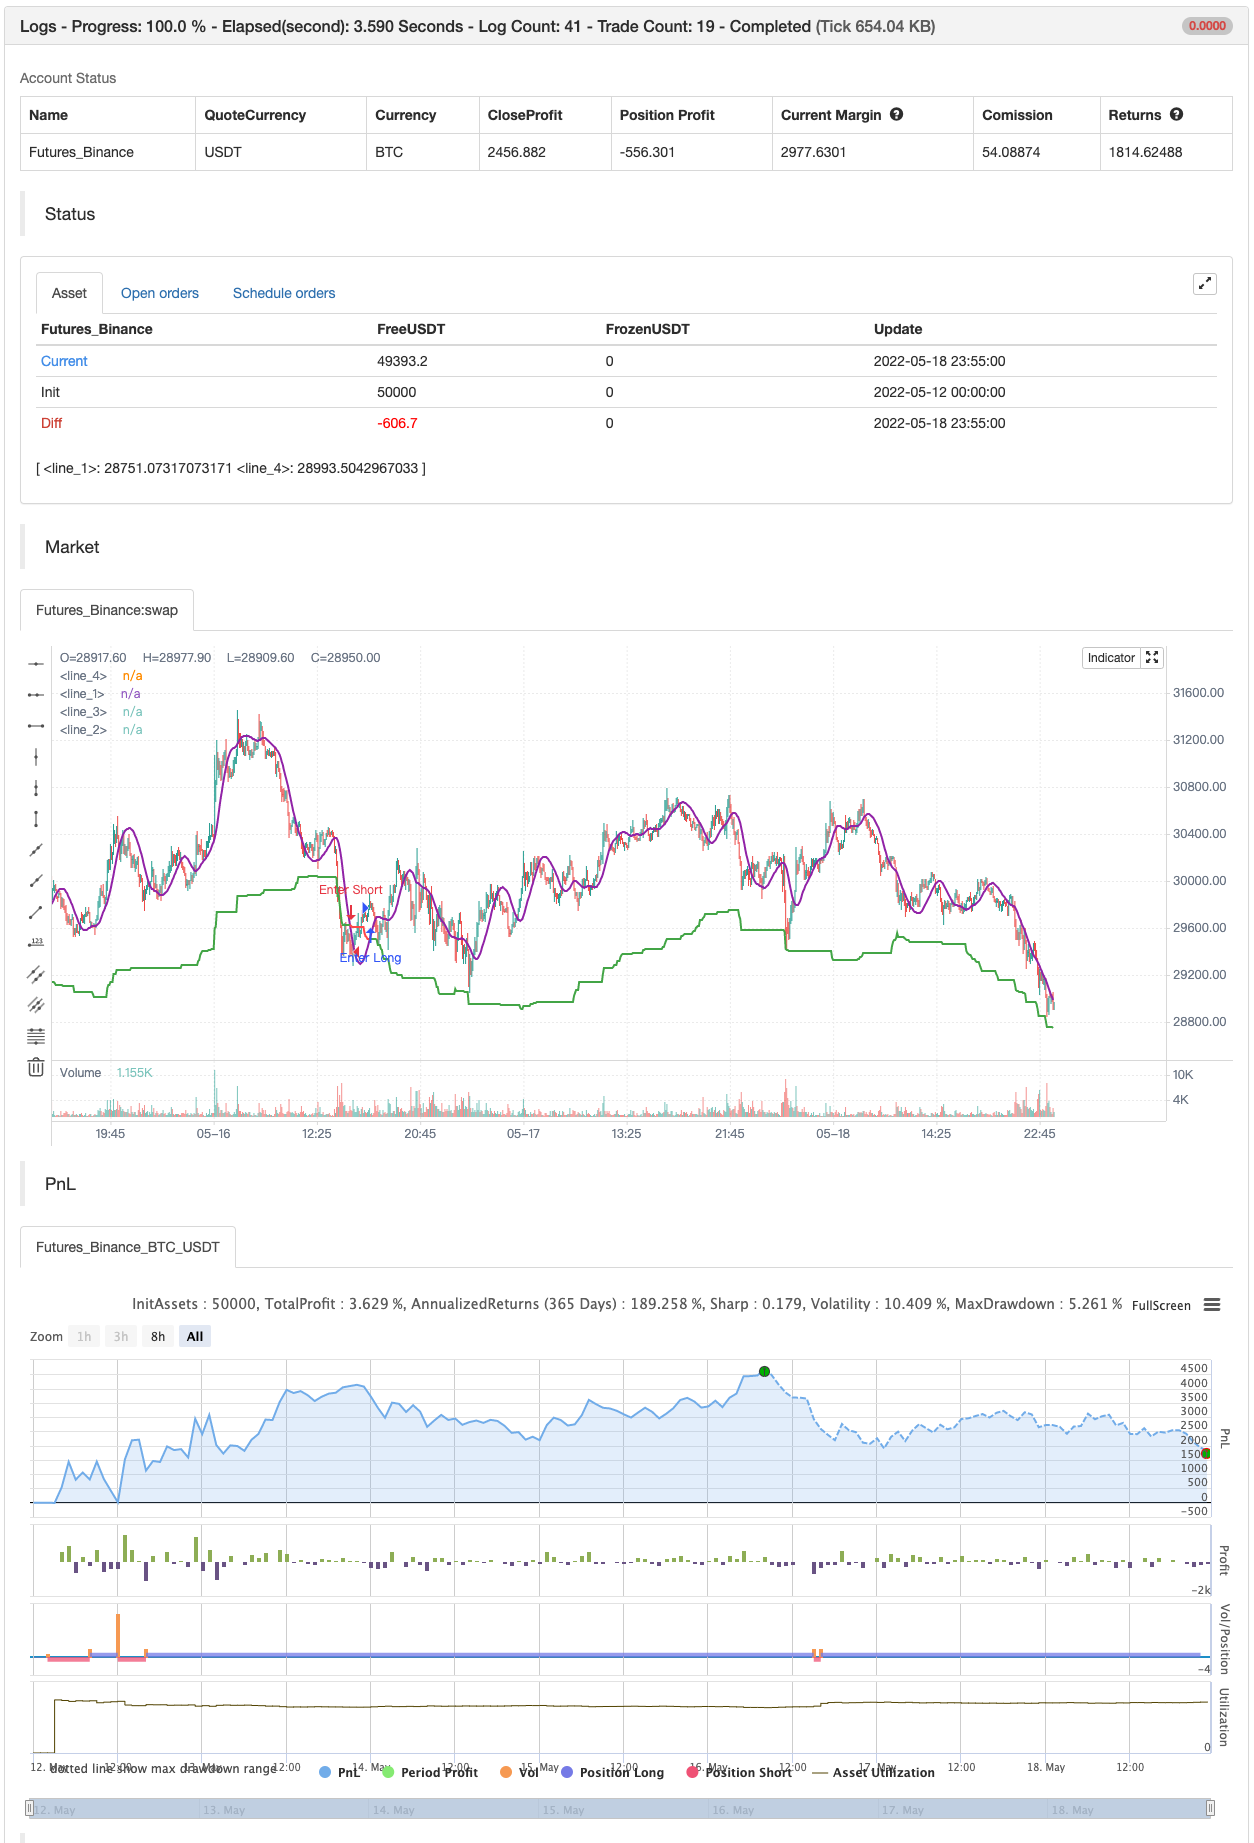
使用方法 ステップのような線は主なトレンドフィルターである. 上向きでは緑色,下向きでは赤色である. 滑らかな状態にあるとき,トレンドフィルターに加えて,インジケーターは紫色の線をプロットする. これは価格のハル移動平均 (HMA) である. この場合,インジケーターはトレンドフィルターとの交差点を見つけるために価格の代わりにこの線を使用する. 価格またはスムーズな線が上記のトレンドフィルタを横切ると,上向きのシグナルである.指標は緑色の円でそのような交差をマークする.また,上向きのグラフの背景を緑色に染める.下向きのフィルタを横切る価格または紫色の線は下向きのシグナルを意味します.下向きの信号は赤い円として表示されます.下向きのグラフの背景は赤になります.
設定 センシビリティ ユーザが指標の平均期間の選択を可能にするドロップダウンリスト.ユーザは,その投資視野に最も適した事前に決定されたセットからセンシビリティの値を選択することができます. スムージングをオン・オフする.スムージングをオンにすると,インジケーターは価格変化にゆっくり反応するが,同時に誤った信号の発生量が少なくなる.
バックテスト

/*backtest
start: 2022-05-12 00:00:00
end: 2022-05-18 23:59:00
period: 5m
basePeriod: 1m
exchanges: [{"eid":"Futures_Binance","currency":"BTC_USDT"}]
*/

// This source code is subject to the terms of the Mozilla Public License 2.0 at https://mozilla.org/MPL/2.0/
// © AstrideUnicorn

// Asymmetrical Trend Filter aka HODL Line

//@version=5
indicator("HODL LINE", overlay=true)

// initialize indicator period parameter and the asymmetry paramter
length = 300
asymmetry =  0.05 //input.float(defval=0.05,step=0.01, minval=0.01, maxval=0.3)

// script inputs
sensitivity = input.string(defval="Hold Short Term", title="Sensitivity", options=['Super Sensitive','Hold Short Term', 'Hold Medium Term', 'Hold Long Term'])
use_smoothing = input.bool(defval=true, title="Use Smoothing")


// Set the indicator period based on the choosen sensitivity
if sensitivity == 'Super Sensitive'
    length:=50

if sensitivity == 'Hold Short Term'
    length:=100

if sensitivity == 'Hold Medium Term'
    length:=300

if sensitivity == 'Hold Long Term'
    length:=500

// Calculate HODL Line - an assymetric trend filter
HODL_line = (ta.highest(close,length) + ta.lowest(close,length))/(2.0 + asymmetry)

// Calculate smoothed price time series
smoothed_price = ta.hma(close,50)

// Use closing price or smoothed price based on the choosen option for smoothing
price_model = use_smoothing ? smoothed_price : close

// Define conditional color for the HODL Line
hodl_line_color = price_model >= HODL_line ? color.green : color.red

// define the HODL Line crossing conditions
crossing_condition_bull = ta.crossover(price_model, HODL_line)
crossing_condition_bear = ta.crossunder(price_model, HODL_line)

// plotting
plot(HODL_line, color = hodl_line_color, linewidth = 2)

plot(crossing_condition_bull?HODL_line:na, color = color.new(color.green,40), style= plot.style_circles, linewidth = 20)
plot(crossing_condition_bear?HODL_line:na, color = color.new(color.red,40), style= plot.style_circles, linewidth = 20)

bgcolor(color.new(hodl_line_color,80))

plot(use_smoothing?price_model:na, color=color.purple, linewidth=2)

if crossing_condition_bull
    strategy.entry("Enter Long", strategy.long)
else if crossing_condition_bear
    strategy.entry("Enter Short", strategy.short)
関連コンテンツ
- 多指標融合動的移動平均線交差量化戦略
- 多時波動ボリンガーの突破戦略とフールの均線戦略を組み合わせた
- 双均線交差結合ヘル移動均線量化戦略
- Hull移動平均線に基づく反射型EMA傾向判断戦略
- 柔軟な多周期均線交差戦略 高級版
- 適応価格のクロス平均線取引戦略
- 動的ストップ損失傾向追跡戦略
- HMAは多周期量化取引戦略を動的ストップ損失と組み合わせて最適化
- 高級複合均線と市場動力のトレンドキャプチャ戦略
- 多周期的なハル移動平均線交差戦略
- RSIとMAを組み合わせる戦略
もっと見る
- シャノンエントロピー V2
- 負荷が減る
- ボリュームフロー v3
- 暗号期貨は,ma & rsi - ogcheckersで毎時間スカルパー
- ATR スムーズ化
- オーダーブロックファインダー
- トレンドスカルプ-フラクタルボックス-3EMA
- QQE信号
- U位格子振幅フィルタ
- CM MACD カスタム インディケーター - 複数のタイムフレーム - V2
- 2 移動平均色方向検知
- Scalping PullBack ツール R1
- 買・売戦略は AO+Stoch+RSI+ATRに依存する
- EMA トレンドクラウド
- RedK ボリューム加速方向エネルギー比
- ドンチアン・ブレイク 塗装なし
- レッドKモメントバー
- スーパージャンプ バックボリンガー帯
- フクイズの傾向
- ジョニーのボット