ハイキン・アシ (ROC) 百分比取引戦略
作者: リン・ハーンチャオチャン開催日:2023年10月23日 15:41:40タグ:

概要
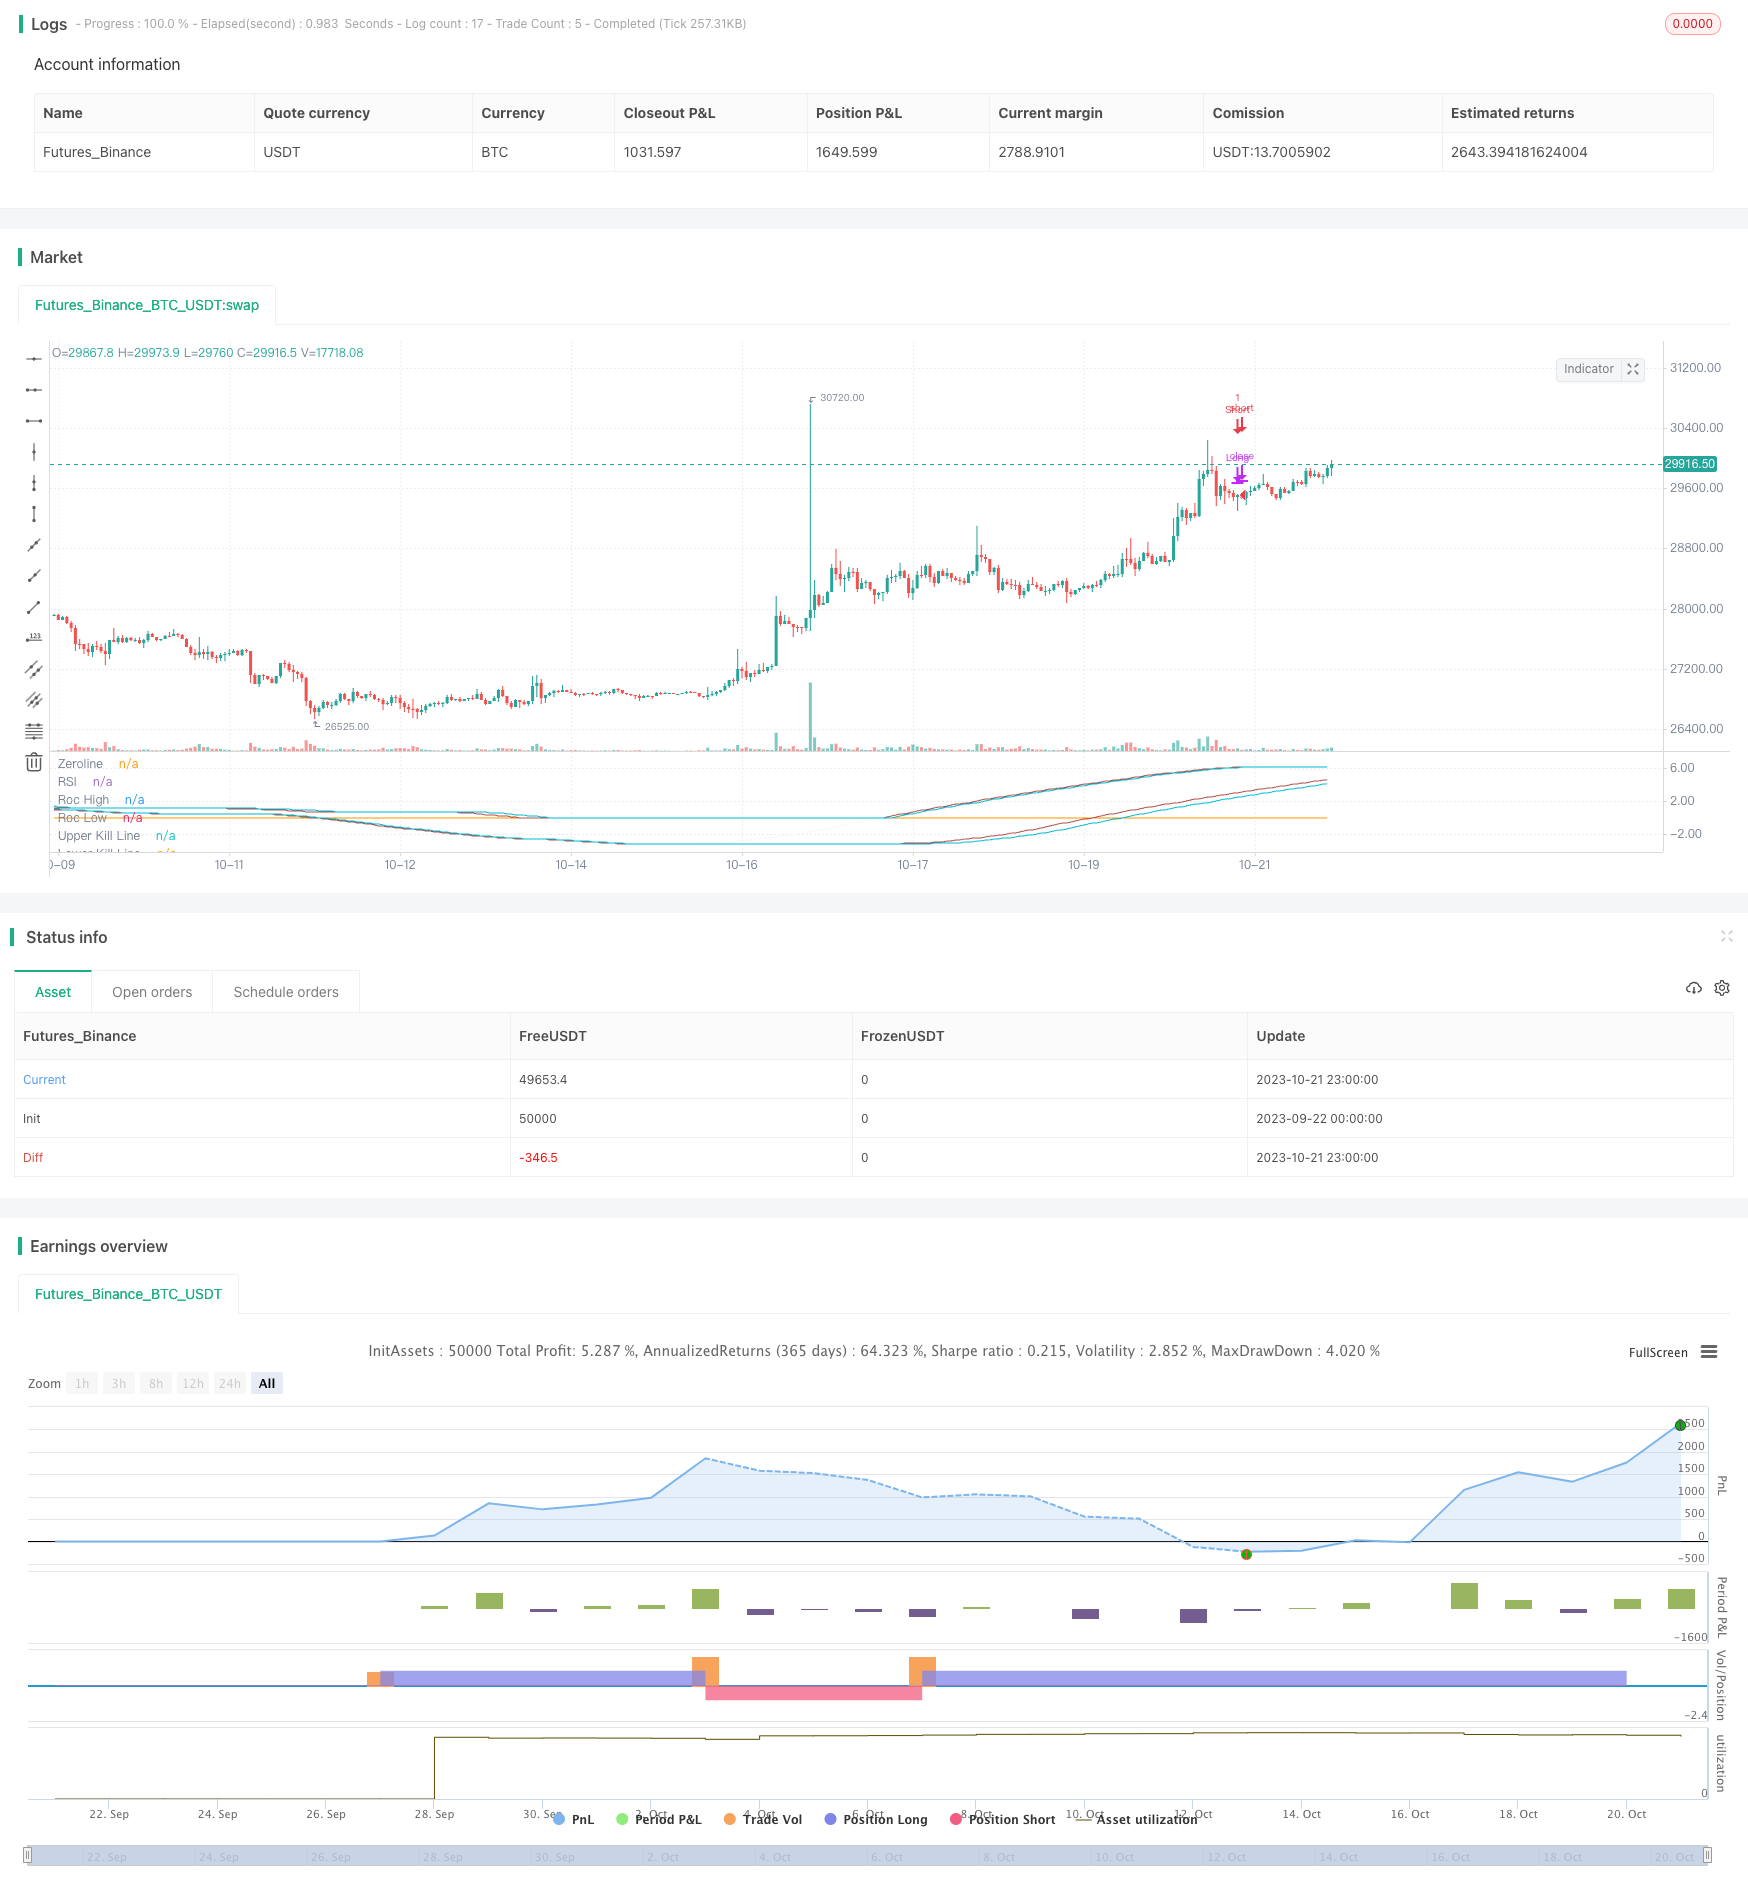
この戦略は"Heikin Ashi ROCパーセンチル取引戦略"と呼ばれる.これは,Heikin Ashi ROCとそのパーセンチルをベースとした使いやすい取引フレームワークを提供することを目的としている.
戦略の論理
この戦略は,過去 rocLength 期間の ROC の閉じる価格を計算する.その後,過去 50 期間の ROC の最高 rocHigh と最低 rocLow 値を計算する.上列の upperKillLine と下列の lowerKillLine は,rocHigh と rocLow の特定の百分点に基づいて生成される.ROC が lowerKillLine を越えたとき,ロングポジションが開かれる.ROC が upperKillLine を越えたとき,ロングポジションは閉じる.逆に,ROC が upperKillLine を越えたとき,ショートポジションが開かれる.ROC が lowerKillLine を越えたとき,ショートポジションは閉まる.
利点分析
この戦略の最大の利点は,ROCインジケーターの強力なトレンドトラッキング能力を活用し,ハイキン・アシのスムージング価格情報機能と組み合わせることです. これにより,戦略はトレンド変化を効果的に特定し,取引をタイムリーに入れることができます.単純な移動平均値と比較して,ROCは価格変化により敏感に反応します.さらに,百分位から生成される上下レールは統合を効果的にフィルタリングし,偽のブレイクから不必要な取引を回避できます.全体的に,この戦略はトレンドフォローと振動フィルタリングの両方を組み合わせて,主要なトレンドで良いリスク・リワーム比を達成します.
リスク分析
この戦略の主なリスクは,不適切なパラメータ設定がオーバートレードまたは不十分なセンシビリティにつながることである. rocLengthおよび百分比回顧期間は慎重に設定する必要があります.そうでなければ,レールがあまりにも鈍くまたは硬くなって,見逃した取引または不必要な損失を引き起こす可能性があります.また,百分比設定は,最適な組み合わせを見つけるためにさまざまな市場のために繰り返しバックテストおよび調整する必要があります.トレンドが逆転する時,トレンドをフォローする指標に依存しているため,戦略は特定の損失にも晒されています.ポジションはタイミングで閉鎖またはリスクを制御するために設定されたストップ損失を停止する必要があります.
オプティマイゼーションの方向性
戦略は以下の方法で最適化できます: 1) RSI などの他の指標でフィルターを追加する; 2) 機械学習でパラメータを動的に最適化する; 3) 自動リスク管理のためにストップ・ロスを設定し,利益を得ること; 4) リスクをバランスするためにトレンド以外の戦略と組み合わせる.
概要
概要すると,この戦略は,ROC指標の強力なトレンドトラッキング能力を利用し,トレンド識別およびフォローのためにハイキンアシと組み合わせます.ROC百分位から生成される上下レールは,効果的な損失フィルタリングを可能にします.これは良いトレンドトラッキングパフォーマンスを達成します.メリットは,トレンドの変化を及時識別し,レールで統合をフィルタリングしながら主要なトレンドを追跡することです.しかし,不適切なパラメータ設定はパフォーマンスに影響を与え,トレンド逆転リスクが残ります.パラメータ選択とストップをさらに最適化することで,より一貫した結果を得ることができます.
/*backtest
start: 2023-09-22 00:00:00
end: 2023-10-22 00:00:00
period: 1h
basePeriod: 15m
exchanges: [{"eid":"Futures_Binance","currency":"BTC_USDT"}]
*/

// This source code is subject to the terms of the Mozilla Public License 2.0 at https://mozilla.org/MPL/2.0/
// © jensenvilhelm

//@version=5
strategy("Heikin Ashi ROC Percentile Strategy", shorttitle="ROC ON" , overlay=false)

// User Inputs
zerohLine = input(0, title="Midline")  // Zero line, baseline for ROC (customer can modify this to adjust midline)
rocLength = input(100, title="roc Length")  // Lookback period for SMA and ROC (customer can modify this to adjust lookback period)

stopLossLevel = input(2, title="Stop Loss (%)")  // Level at which the strategy stops the loss (customer can modify this to adjust stop loss level)
startDate = timestamp("2015 03 03")  // Start date for the strategy (customer can modify this to adjust start date)

// Heikin Ashi values
var float haClose = na  // Define Heikin Ashi close price
var float haOpen = na  // Define Heikin Ashi open price
haClose := ohlc4  // Calculate Heikin Ashi close price as average of OHLC4 (no customer modification needed here)
haOpen := na(haOpen[1]) ? (open + close) / 2 : (haOpen[1] + haClose[1]) / 2  // Calculate Heikin Ashi open price (no customer modification needed here)

// ROC Calculation
roc = ta.roc(ta.sma(haClose, rocLength), rocLength)  // Calculate Rate of Change (ROC) (customer can modify rocLength in the inputs)
rocHigh = ta.highest(roc, 50)  // Get the highest ROC of the last 50 periods (customer can modify this to adjust lookback period)
rocLow = ta.lowest(roc, 50)  // Get the lowest ROC of the last 50 periods (customer can modify this to adjust lookback period)
upperKillLine = ta.percentile_linear_interpolation(rocHigh, 10, 75)  // Calculate upper kill line (customer can modify parameters to adjust this line)
lowerKillLine = ta.percentile_linear_interpolation(rocLow, 10, 25)  // Calculate lower kill line (customer can modify parameters to adjust this line)

// Trade conditions
enterLong = ta.crossover(roc, lowerKillLine)  // Define when to enter long positions (customer can modify conditions to adjust entry points)
exitLong = ta.crossunder(roc, upperKillLine)  // Define when to exit long positions (customer can modify conditions to adjust exit points)
enterShort = ta.crossunder(roc, upperKillLine)  // Define when to enter short positions (customer can modify conditions to adjust entry points)
exitShort = ta.crossover(roc, lowerKillLine )  // Define when to exit short positions (customer can modify conditions to adjust exit points)

// Strategy execution
if(time >= startDate)  // Start strategy from specified start date
    if (enterLong)
        strategy.entry("Long", strategy.long)  // Execute long trades
    if (exitLong)
        strategy.close("Long")  // Close long trades
    if (enterShort)
        strategy.entry("Short", strategy.short)  // Execute short trades
    if (exitShort)
        strategy.close("Short")  // Close short trades

// Plotting
plot(zerohLine,title="Zeroline")  // Plot zero line
plot(roc, "RSI", color=color.rgb(248, 248, 248))  // Plot ROC
plot(rocHigh, "Roc High", color = color.rgb(175, 78, 76))  // Plot highest ROC
plot(rocLow, "Roc Low", color = color.rgb(175, 78, 76))  // Plot lowest ROC
plot(upperKillLine, "Upper Kill Line", color = color.aqua)  // Plot upper kill line
plot(lowerKillLine, "Lower Kill Line", color = color.aqua)  // Plot lower kill line
- 動向平均のクロスオーバーに基づく戦略をフォローする傾向
- ノロの価格チャネル戦略 v1.1
- 2つの移動平均逆転戦略
- トリプル パターン オシレーション 取引戦略
- トレンド逆転システム
- チャンネルブレイク SMA戦略
- RSIのトレンド逆転戦略
- RSI MACDクロスオーバー ダブルMA追跡戦略
- 複数のタイムフレームのトレンド戦略
- 双重RSI平均逆転戦略
- 移動平均偏差に基づくトレンドブレイク戦略
- スナップバック 移動平均 反トレンド 戦略
- ゴールデンクロス・ロング戦略をフォローする移動平均傾向
- モメントブレイク戦略
- オープンドライブ戦略
- モメント・リバース・コンボ・戦略
- クロスオーバーマスター - 逆転ブレイアウト戦略
- イチモク・ラグング・クロス・デュアル・ライン・トレーディング・戦略
- 動力分解 MACD 戦略
- 移動平均を追跡する戦略