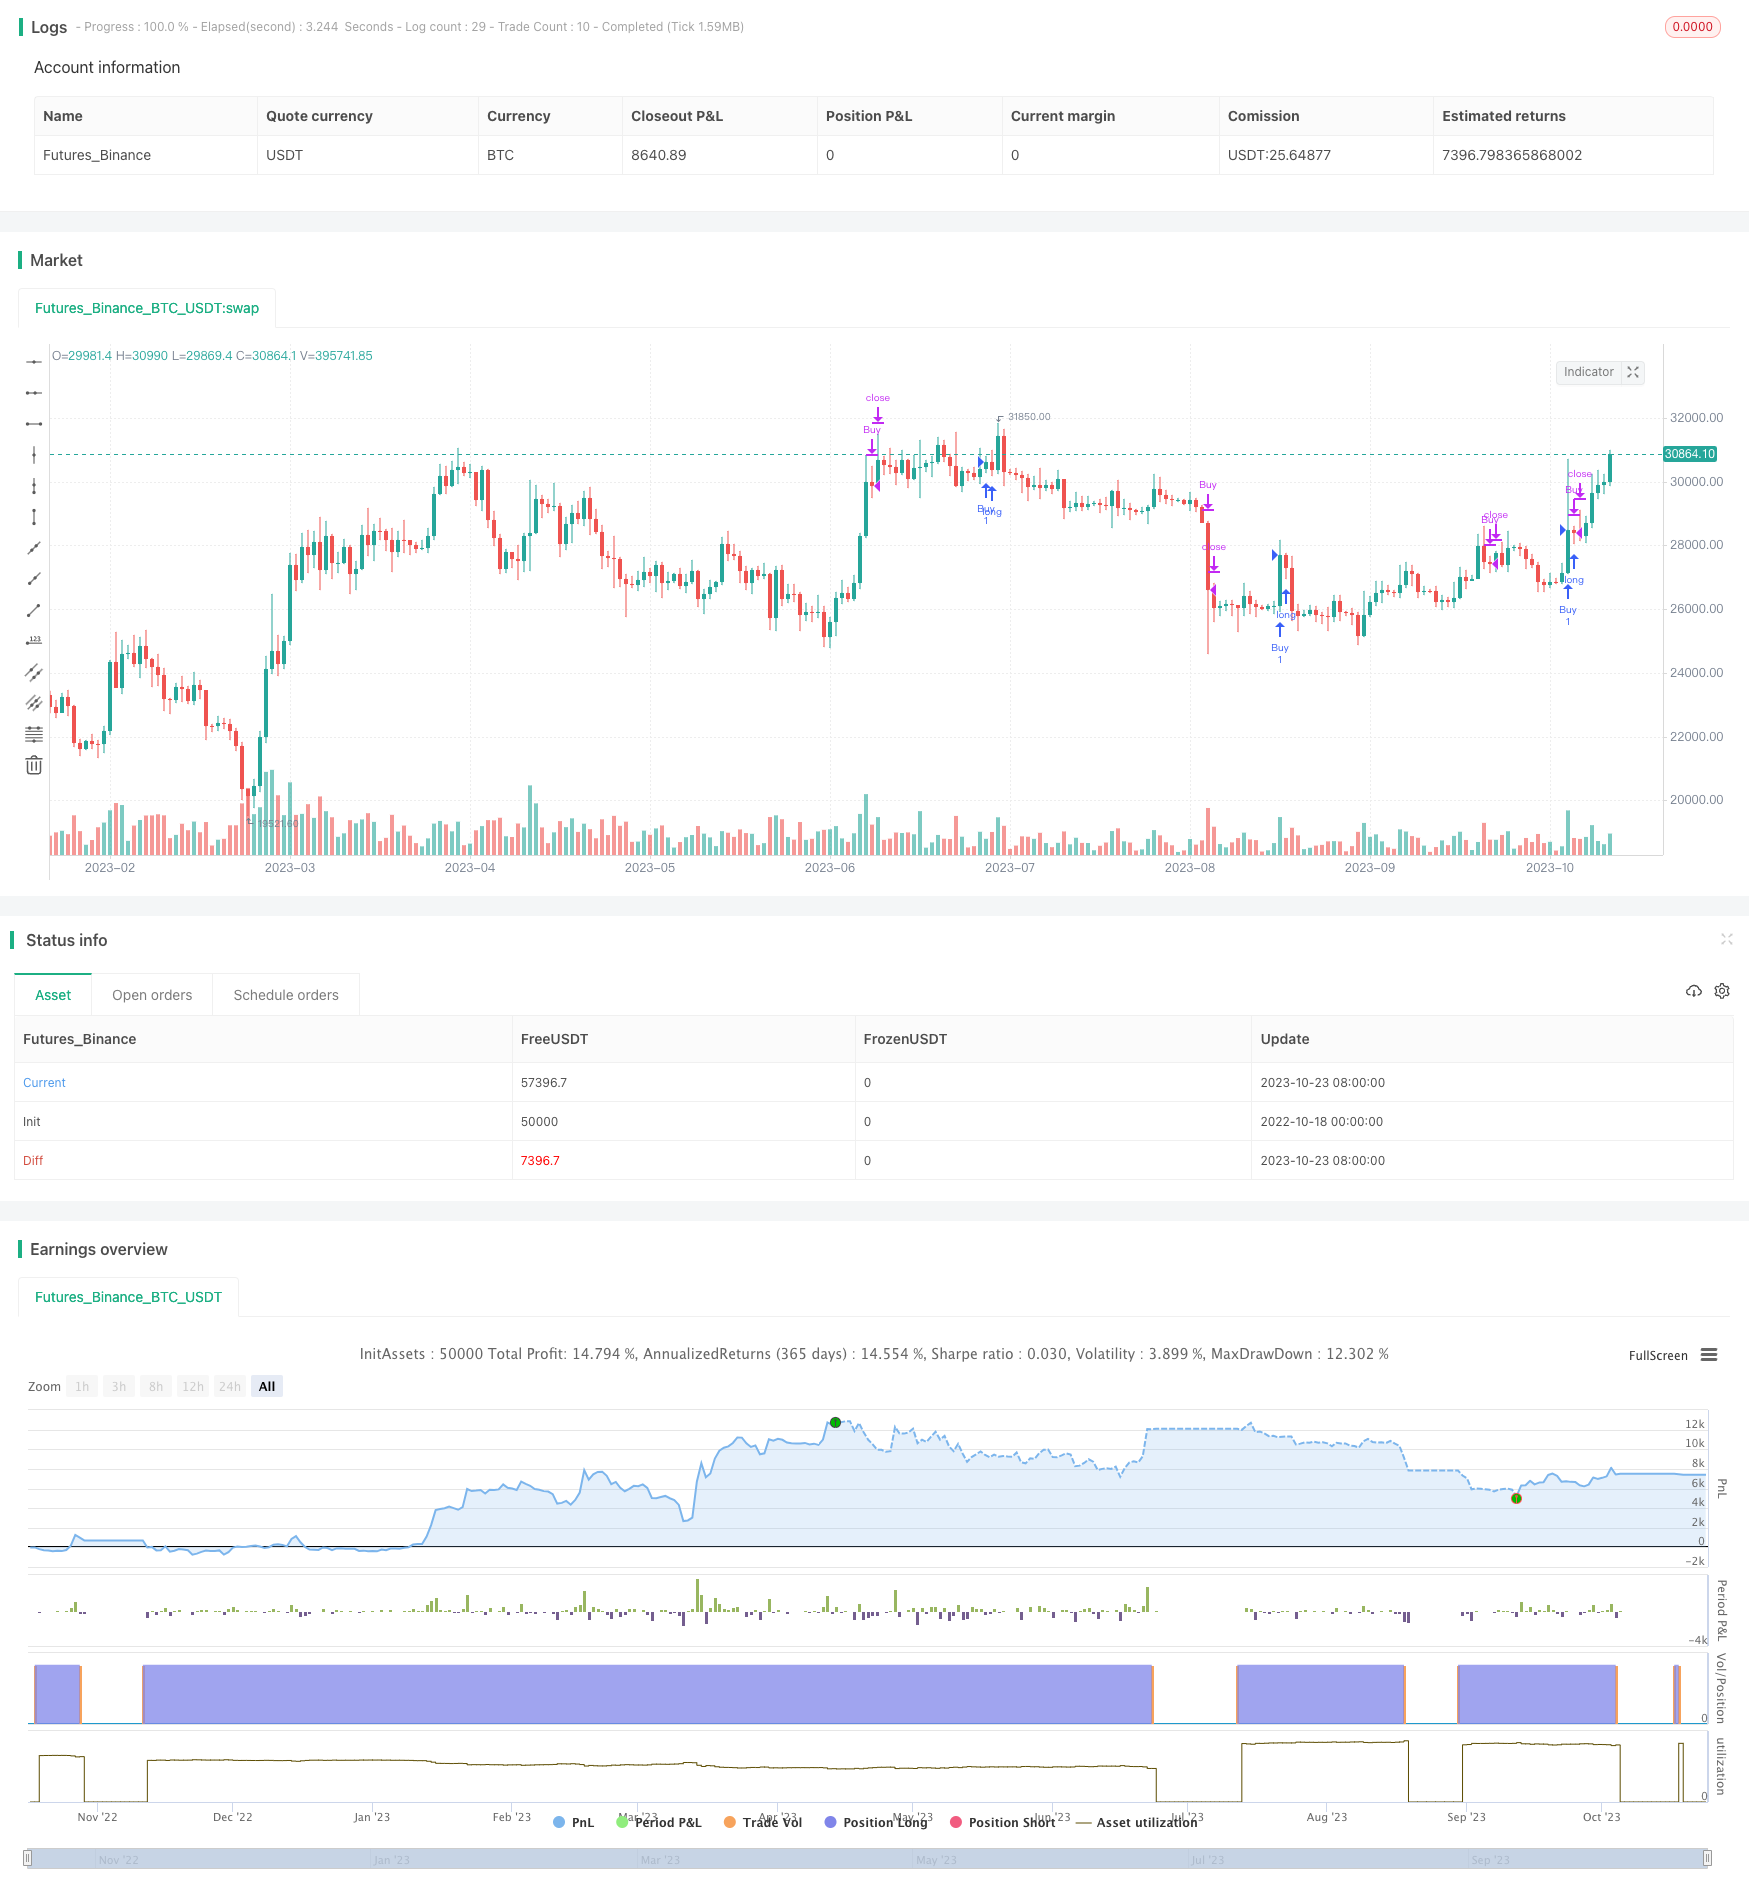
ボリンジャー・バンド幅スケーリング ダブル・ムービング・平均トレンドフィルター戦略
作者: リン・ハーンチャオチャン開催日:2023年10月25日15時20分タグ:

この戦略は,ボリンジャー帯とダブル移動平均をベースに取引信号を生成し,高い勝利率と良い利益損失比率をターゲットにトレンドフィルタリングを行います.
戦略の論理
-
長/短信号生成のためにボリンジャー帯上,中,下帯を使用します.価格が上帯に触ると販売し,下帯に触ると購入します.
-
トレンド方向を決定するために20期間の中期期および60期間の長期期間の移動平均値を使用します.短期MAが長期MAを横切ると上向き,下向きは下向きです.
-
ボリンジャー帯幅に基づいてストップロスのポジションを動的に調整する.幅が0.5%を超えると,下の帯でストップロスを調整する.0.5%未満の場合,ストップロスを下の帯範囲の半分に削減する.
-
入場条件: 上向きのトレンド中に購入信号として下の帯を突破する. 下向きのトレンド中に販売信号として上向きの帯を突破する.
-
出口条件: ロングで上帯またはショートMAに触れたときに利益を得ます. ショートで下帯またはショートMAに触れたときに利益を得ます.
-
ストップ・ロスの条件: ストップ・アウトは,ロングで価格が下帯ダイナミックレンジを下回る.ショートで価格が上帯ダイナミックレンジを下回る.
利点
-
トレンドを決定するためにダブルMAsを使用すると,トレンドでない市場やレンジ・バインド市場からのノイズをフィルタリングするのに役立ちます.
-
BB 中間帯はサポート/レジスタンス,上部/下部帯はリスク制御のための動的ストップ損失レベルとして機能します.
-
BB幅に基づいてストップ損失範囲を調整すると,ストップを合理的に保つ一方で,ストップアウトされる可能性が減少します.
-
トレンドの方向で取引すると 勝率が上がります
リスク
-
ダブルMAsは頻繁に偽ブレイクを生成し,トレンドターニングポイントを逃す.
-
市場が動かない場合 取引頻度が低下します
-
サポート/レジスタンスレベルに近いストップ・ロスは引き出されやすい.より広いストップ・ロスの範囲を許可できる.
-
短期的な引き下げを有効に活用できず 保持期間を短縮します
増進 の 機会
-
市場条件に最も適したものを探すために,MAP期間を最適化する.
-
BB倍数パラメータを最適化して ストップ損失を平衡させる
-
信号の質を改善するために,複数の要素による確認のための他の指標を追加します.
-
トレンドを確認するためにボリューム/モメンタムを組み込む.
-
資金管理の最適化 例えば,単一の取引リスクを制御するための固定・割引・固定ストップ損失
-
価格ショック処理,例えば大幅な一日のギャップ.
概要
これは,トレンド方向のためのダブルMAとサポート/レジスタンスおよびダイナミックストップのためのBBを使用する総合的な堅牢な戦略です. 誤ったトレンド信号やあまりにも近いストップなどの制限があります. 様々な市場条件において堅牢性を高めるために,MAシステム,ストップ損失戦略,マネーマネジメントなどにさらなる最適化ができます. 総合的に,高い勝利率,良いリスク・リターンプロファイル,シンプルで効果的な論理で初心者にとって優れた戦略です.
/*backtest
start: 2022-10-18 00:00:00
end: 2023-10-24 00:00:00
period: 1d
basePeriod: 1h
exchanges: [{"eid":"Futures_Binance","currency":"BTC_USDT"}]
*/

//@version=2
strategy(title="yuthavithi BB Scalper 2 strategy", overlay=true)

len = input(20, minval=1, title="Length")
multiplier = input(4, minval=1, title="multiplier")
trendTimeFrame = input(60, minval=1, title="Trend Time Frame")
useTrendFilter = input(true, type=bool, title = "Use Trend Filter")

src = input(close, title="Source")
out = sma(src, len)
//plot(out, title="SMA", color=blue)

stdOut = stdev(close, len)
bbUpper = out + stdOut * multiplier
bbLower = out - stdOut * multiplier
bbUpper2 = out + stdOut * (multiplier / 2)
bbLower2 = out - stdOut * (multiplier / 2)
bbUpperX2 = out + stdOut * multiplier * 2
bbLowerX2 = out - stdOut * multiplier * 2
bbWidth = (bbUpper - bbLower) / out


closeLongTerm = request.security(syminfo.tickerid, tostring(trendTimeFrame), close)
smaLongTerm = request.security(syminfo.tickerid, tostring(trendTimeFrame), sma(close,20))

//plot(smaLongTerm, color=red)

trendUp = useTrendFilter ? (closeLongTerm > smaLongTerm) : true
trendDown = useTrendFilter? (closeLongTerm < smaLongTerm) : true

bearish = ((cross(close,bbUpper2) == 1) or (cross(close,out) == 1)) and (close[1] > close) and trendDown
bullish = ((cross(close,bbLower2) == 1) or (cross(close,out) == 1)) and (close[1] < close) and trendUp


closeBuy = (high[1] > bbUpper[1]) and (close < bbUpper) and (close < open) and trendUp
closeSell = (((low[1] < bbLower[1]) and (close > bbLower)) or ((low[2] < bbLower[2]) and (close[1] > bbLower[1]))) and (close > open) and trendDown


cutLossBuy = iff(bbWidth > 0.005, (low < bbLower) and (low[1] > bbLower[1]) and trendUp, (low < bbLowerX2) and (low[1] > bbLowerX2[1]) and trendUp)
cutLossSell = iff(bbWidth > 0.005, (high > bbUpper) and (high[1] < bbUpper[1]) and trendDown, (high > bbUpperX2) and (high[1] < bbUpperX2[1]) and trendDown)


if (bullish)
    strategy.entry("Buy", strategy.long, comment="Buy")

if (bearish)
    strategy.entry("Sell", strategy.short, comment="Sell")


strategy.close("Buy", closeBuy or cutLossBuy)

strategy.close("Sell", closeSell or cutLossSell)
- EMAのクロスオーバー追跡戦略
- 追跡ストップ損失のSSLチャネルブレークアウト戦略
- 勢いを追うCCI戦略
- 漸進的な蓄積による脱出取引戦略
- ダイナミック・キャンドル・ディレクション・戦略
- RSI ダイバージェンツ・トレーディング戦略
- 多指標に基づく短期動向戦略
- マルチタイムフレームMACDヒートマップ戦略
- 2倍移動平均のクロスオーバー戦略
- ATR 調整可能な追尾停止損失戦略
- グラディエント・トライリング・ストップ・ロスの戦略
- Bollinger Bands と RSI インディケーター 戦略
- 短期取引戦略
- イチモク バランスライン 戦略の流れ
- 双 EMA スプレッド ブレイクストラテジー
- コントリアン・ブレイク・トレード・戦略
- ウィリアムズVIX 修正戦略
- RSI デュアルレール振動線 長と短 両方向取引戦略
- 多要素モメンタム・ローテーション戦略
- RSI EMAクロスオーバー戦略