概述
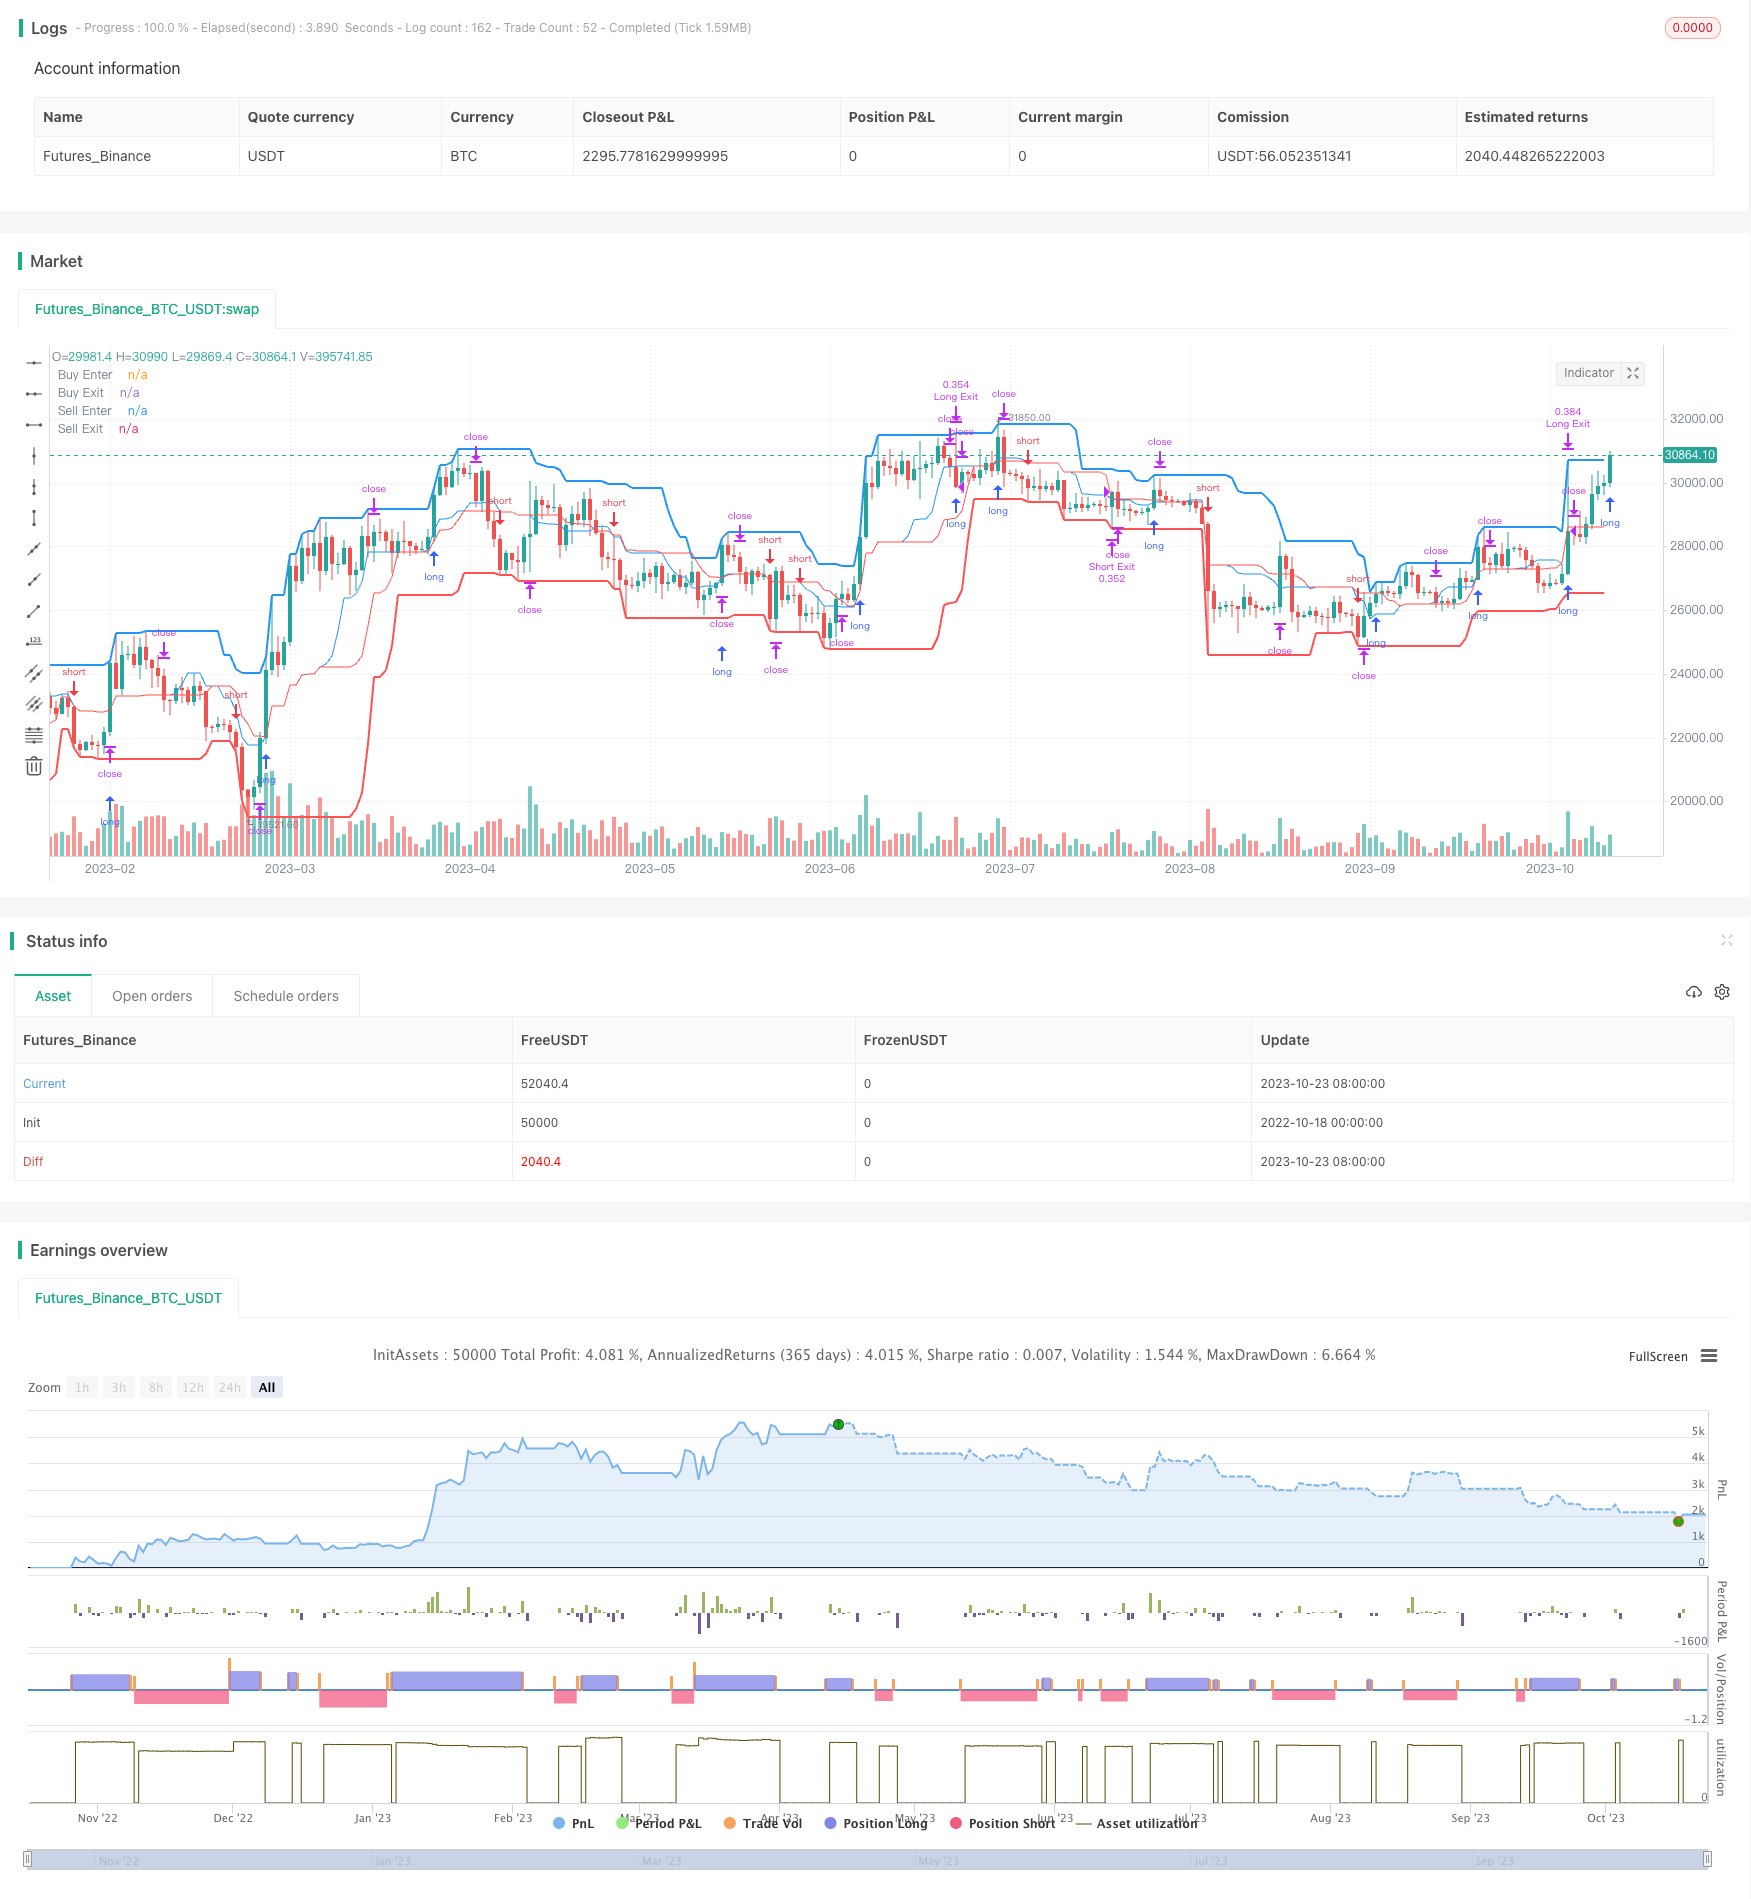
该策略是一种基于通道指标的短期交易策略。它利用通道上下轨的突破来判断趋势的开始和结束,进而做出买卖决策。在强劲的趋势市场中,这种突破策略可以获得较好的收益。
策略原理
该策略首先计算一定周期内的最高价和最低价,构建通道的上轨和下轨。
如果价格上涨突破上轨,则做多入场。如果价格下跌突破下轨,则做空入场。
采用移动止损来控制风险。止损线设置为通道的中线。
有两个可选的退出规则:回归中线和移动止损。前者实现快速获利退出,后者控制风险。
可以根据市场环境选择通道周期,调整止损幅度等参数,实现策略的优化。
优势分析
操作简单,容易实现。只需要监控价格与通道的关系,按规则开平仓。
顺应趋势交易,不存在逆势的风险。
通道清晰直观,形成明确的入场信号。
具有较好的获利空间,通常能获得比较满意的回报。
可调整的参数较多,可以针对不同市场进行优化。
风险分析
突破不一定成功,存在被套的风险。需要及时止损。
通道需要一定周期形成,不适用于震荡行情。
回看通道中线止损可能过于保守,无法持有趋势。
参数优化需要历史数据支持,实盘可能出现过优化。
机械地买卖突破点可能增加交易次数和滑点成本。
优化方向
评估不同周期参数的效果,选择最佳通道周期。
测试回归中线止损和移动止损,选择更合适的退出机制。
优化止损幅度,降低止损被触发的概率。
加入趋势过滤,避免不合适的突破交易。
考虑加大仓位,但要控制好风险。
总结
该策略整体来说是一个较为成熟的短期突破策略。它有明确的入场规则,风险控制措施到位,运行效果较好。通过参数优化可以进一步改善策略表现。但仍需注意一些固有缺点,需要针对不同市场调整。如果系统使用该策略,整体收益应该可以获得保障。
策略源码
/*backtest
start: 2022-10-18 00:00:00
end: 2023-10-24 00:00:00
period: 1d
basePeriod: 1h
exchanges: [{"eid":"Futures_Binance","currency":"BTC_USDT"}]
*/

// This source code is subject to the terms of the Mozilla Public License 2.0 at https://mozilla.org/MPL/2.0/
// Strategy testing and optimisation for free Bitmex trading bot
// © algotradingcc

//@version=4
strategy("Channel Break [for free bot]", overlay=true, default_qty_type= strategy.percent_of_equity, initial_capital = 1000, default_qty_value = 20, commission_type=strategy.commission.percent, commission_value=0.075)

//Options
buyPeriod = input(13, "Channel Period for Long position")
sellPeriod = input(18, "Channel Period for Short position")
isMiddleExit = input(true, "Is exit on Base Line?")
takeProfit = input(46, "Take Profit (%) for position")
stopLoss = input(9, "Stop Loss (%) for position")

// Test Start
startYear = input(2005, "Test Start Year")
startMonth = input(1, "Test Start Month")
startDay = input(1, "Test Start Day")
startTest = timestamp(startYear,startMonth,startDay,0,0)

//Test End
endYear = input(2050, "Test End Year")
endMonth = input(12, "Test End Month")
endDay = input(30, "Test End Day")
endTest = timestamp(endYear,endMonth,endDay,23,59)

timeRange = time > startTest and time < endTest ? true : false

// Long&Short Levels
BuyEnter = highest(buyPeriod)
BuyExit = isMiddleExit ? (highest(buyPeriod) + lowest(buyPeriod)) / 2: lowest(buyPeriod)

SellEnter = lowest(sellPeriod)
SellExit = isMiddleExit ? (highest(sellPeriod) + lowest(sellPeriod)) / 2: highest(sellPeriod)

// Plot Data
plot(BuyEnter, style=plot.style_line, linewidth=2, color=color.blue, title="Buy Enter")
plot(BuyExit, style=plot.style_line, linewidth=1, color=color.blue, title="Buy Exit", transp=50)
plot(SellEnter, style=plot.style_line, linewidth=2, color=color.red, title="Sell Enter")
plot(SellExit, style=plot.style_line, linewidth=1, color=color.red, title="Sell Exit", transp=50)

// Calc Take Profits & Stop Loss
TP = 0.0
SL = 0.0
if strategy.position_size > 0
    TP := strategy.position_avg_price*(1 + takeProfit/100)
    SL := strategy.position_avg_price*(1 - stopLoss/100)

if strategy.position_size > 0 and SL > BuyExit
    BuyExit := SL

if strategy.position_size < 0
    TP := strategy.position_avg_price*(1 - takeProfit/100)
    SL := strategy.position_avg_price*(1 + stopLoss/100)

if strategy.position_size < 0 and SL < SellExit
    SellExit := SL


// Long Position
if timeRange and strategy.position_size <= 0
    strategy.entry("Long", strategy.long, stop = BuyEnter)
strategy.exit("Long Exit", "Long", stop=BuyExit, limit = TP, when = strategy.position_size > 0)


// Short Position
if timeRange and strategy.position_size >= 0
    strategy.entry("Short", strategy.short, stop = SellEnter)

strategy.exit("Short Exit", "Short", stop=SellExit, limit = TP, when = strategy.position_size < 0)

// Close & Cancel when over End of the Test
if time > endTest
    strategy.close_all()
    strategy.cancel_all()