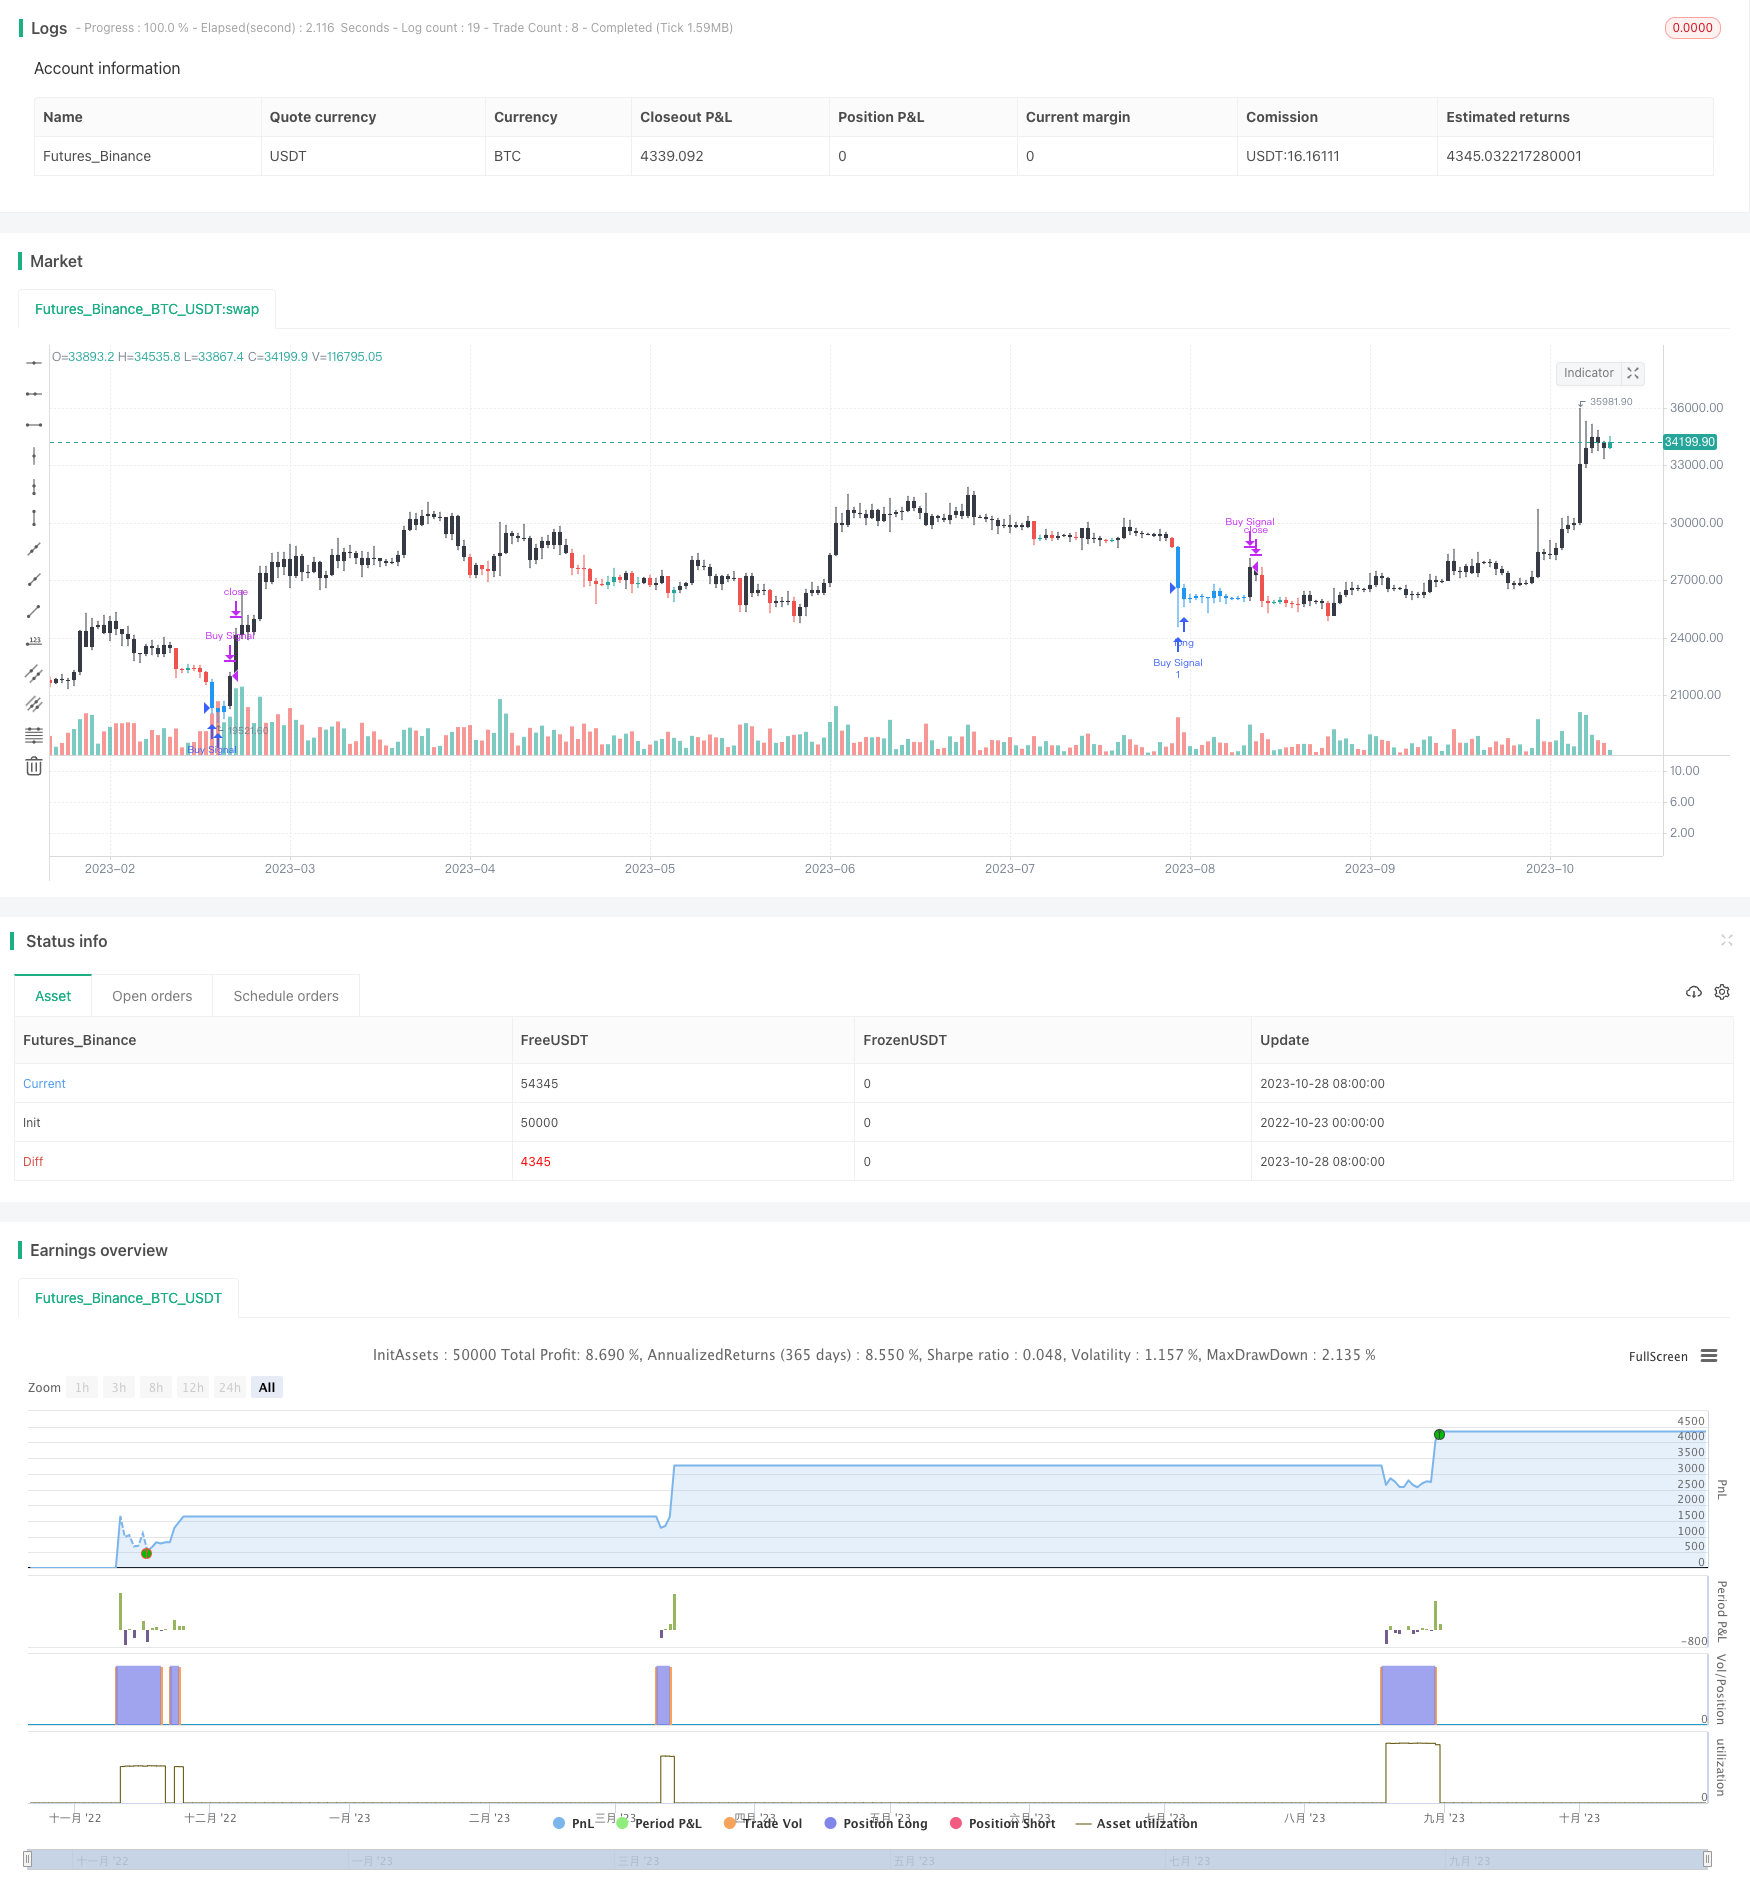
RSI 取引戦略
作者: リン・ハーンチャオチャン,日付: 2023年10月30日 14:58:38タグ:

概要
この戦略は,相対強度指数 (RSI) をベースとした単純な
戦略の論理
この戦略は,主にRSI指標の過剰販売と過剰購入ゾーンを使用して取引信号を生成する.RSIは,一期間の価格変化の速度を反映する.RSIが30未満である場合は,価格が反発する可能性がある過剰販売ゾーンを示します.RSIが70を超える場合は,価格が下がる可能性がある過剰購入ゾーンを示します.
戦略は,最初に10日間のRSIを計算し,その後30と40で
この戦略は単純で理解が容易で,RSIを使用して過売りと過買いのゾーンを特定し,指標に基づいたトレード戦略を実行します.
利点
- パラメータ最適化のためのスペースを広く適用されるRSIインジケーターを使用
この戦略は,一般的なRSI指標を使用している.RSIパラメータは,異なる期間と市場環境に合わせて調整および最適化することができます.
- シンプルなトレンドを実行します
RSIは価格変動傾向を反映することができる.戦略は,RSIに基づいて価格動きを判断し,単純なトレンドフォローを達成する.
- 比較的良いリスク管理
この戦略は,単一の損失を効果的に制御するために固定保持期間を採用しています.一方,RSIパラメータは,誤った取引を減らすために調整できます.
リスク
- RSI パラメータは過度に最適化されやすい
RSIパラメータは柔軟に設定できますが,過剰な最適化やバックテストバイアスは,リアルタイム取引リスクをもたらす可能性があります.
- 遅延効果がある
RSI は,傾向を示す指標であり,突然の出来事に対してゆっくりと反応し,一定の遅延効果があります.他の指標を組み合わせる必要があります.
- 固定保有期間が柔軟性がない
固定保有期間には,利益取得とストップ損失のポイントが義務付けられており,市場の変化に基づいて調整することはできません.ストップ利益とストップ損失の動的調整が望まれます.
改善の方向性
-
RSI パラメータと異なる値のテスト効果を最適化する.
-
異なる指標の強みを利用した組み合わせたシステムを形成するために他の指標を追加します
-
ストップ・プロフィット/損失戦略を強化し,市場の状況に基づいて動的調整を可能にします.
-
ポジションのサイズを最適化し,市場の状況に基づいてポジションを動的に調整する.
-
戦略に適した製品を試験し,高揮発性の液体製品を選択する.
-
取引時間を最適化し 戦略への影響をテストする
結論
この戦略は比較的シンプルで,RSIを用いた
/*backtest
start: 2022-10-23 00:00:00
end: 2023-10-29 00:00:00
period: 1d
basePeriod: 1h
exchanges: [{"eid":"Futures_Binance","currency":"BTC_USDT"}]
*/

// This source code is subject to the terms of the Mozilla Public License 2.0 at https://mozilla.org/MPL/2.0/
// © Bitduke

//@version=4
// strategy("Simple RSI Buy/Sell at a level", shorttitle="Simple RSI Strategy", overlay=true,calc_on_every_tick=false,pyramiding=1, default_qty_type=strategy.cash,default_qty_value=1000, currency=currency.USD, initial_capital=1000,commission_type=strategy.commission.percent, commission_value=0.075)
overbought = input(40, title="overbought value")
oversold = input(30, title="oversold value")
// Component Test Periods Code Begin
testStartYear = input(2018, "Backtest Start Year")
testStartMonth = input(1, "Backtest Start Month")
testStartDay = input(1, "Backtest Start Day")
testPeriodStart = timestamp(testStartYear,testStartMonth,testStartDay,0,0)

testStopYear = input(2021, "Backtest Stop Year")
testStopMonth = input(16, "Backtest Stop Month")
testStopDay = input(2, "Backtest Stop Day")
testPeriodStop = timestamp(testStopYear,testStopMonth,testStopDay,0,0)

// A switch to control background coloring of the test period
testPeriodBackground = input(title="Color Background?", type=input.bool, defval=true)
testPeriodBackgroundColor = testPeriodBackground and (time >= testPeriodStart) and (time <= testPeriodStop) ? #00FF00 : na
bgcolor(testPeriodBackgroundColor, transp=97)

testPeriod() => true
// Component Test Periods Code End
//////////////////////////////////////////////////////////////////////

myrsi = rsi(close, 10) > overbought
myrsi2 = rsi(close, 10) < oversold

barcolor(myrsi ? color.black : na)
barcolor(myrsi2 ? color.blue : na)


myEntry = myrsi2 and hour(time) <= 9

strategy.entry("Buy Signal", strategy.long, when = myEntry and testPeriod())

// Close 10 bar periods after the condition that triggered the entry

//if (myEntry[10])
    //strategy.close("Buy Signal")
strategy.close("Buy Signal", when = barssince(myEntry) >= 10 or myrsi and testPeriod())

//strategy.entry("Sell Signal",strategy.short, when = myrsi2)
- 総量残高に基づくVB戦略
- 波動性ブレイク・トレード戦略
- 3つの移動平均のクロスオーバー戦略
- MACD LONG のサポート&レジスタンスの戦略
- 移動平均値に基づくトレンド取引戦略
- RSI 長期・短期残高取引戦略
- テスラのスーパートレンド戦略
- 3つの内側から逆転する戦略
- 2つの移動平均のクロスオーバーアルゴリズム取引戦略
- トレンドフォロー戦略とストップロスの追跡
- 強いトレンドブレイク戦略
- シグザグ ベース トレンド フォロー 戦略
- イチモクバランス戦略
- 金十字 死十字 移動平均 取引戦略
- HULL SMA と EMA のクロスオーバーに基づいたトレンド戦略
- 双重EMAクロスオーバー戦略
- 移動平均のブレイクに基づいたトレンドフォロー戦略
- MACD 閉じる ハイブリッド カメ戦略
- 多時間枠の利益戦略
- 低点リバウンド戦略