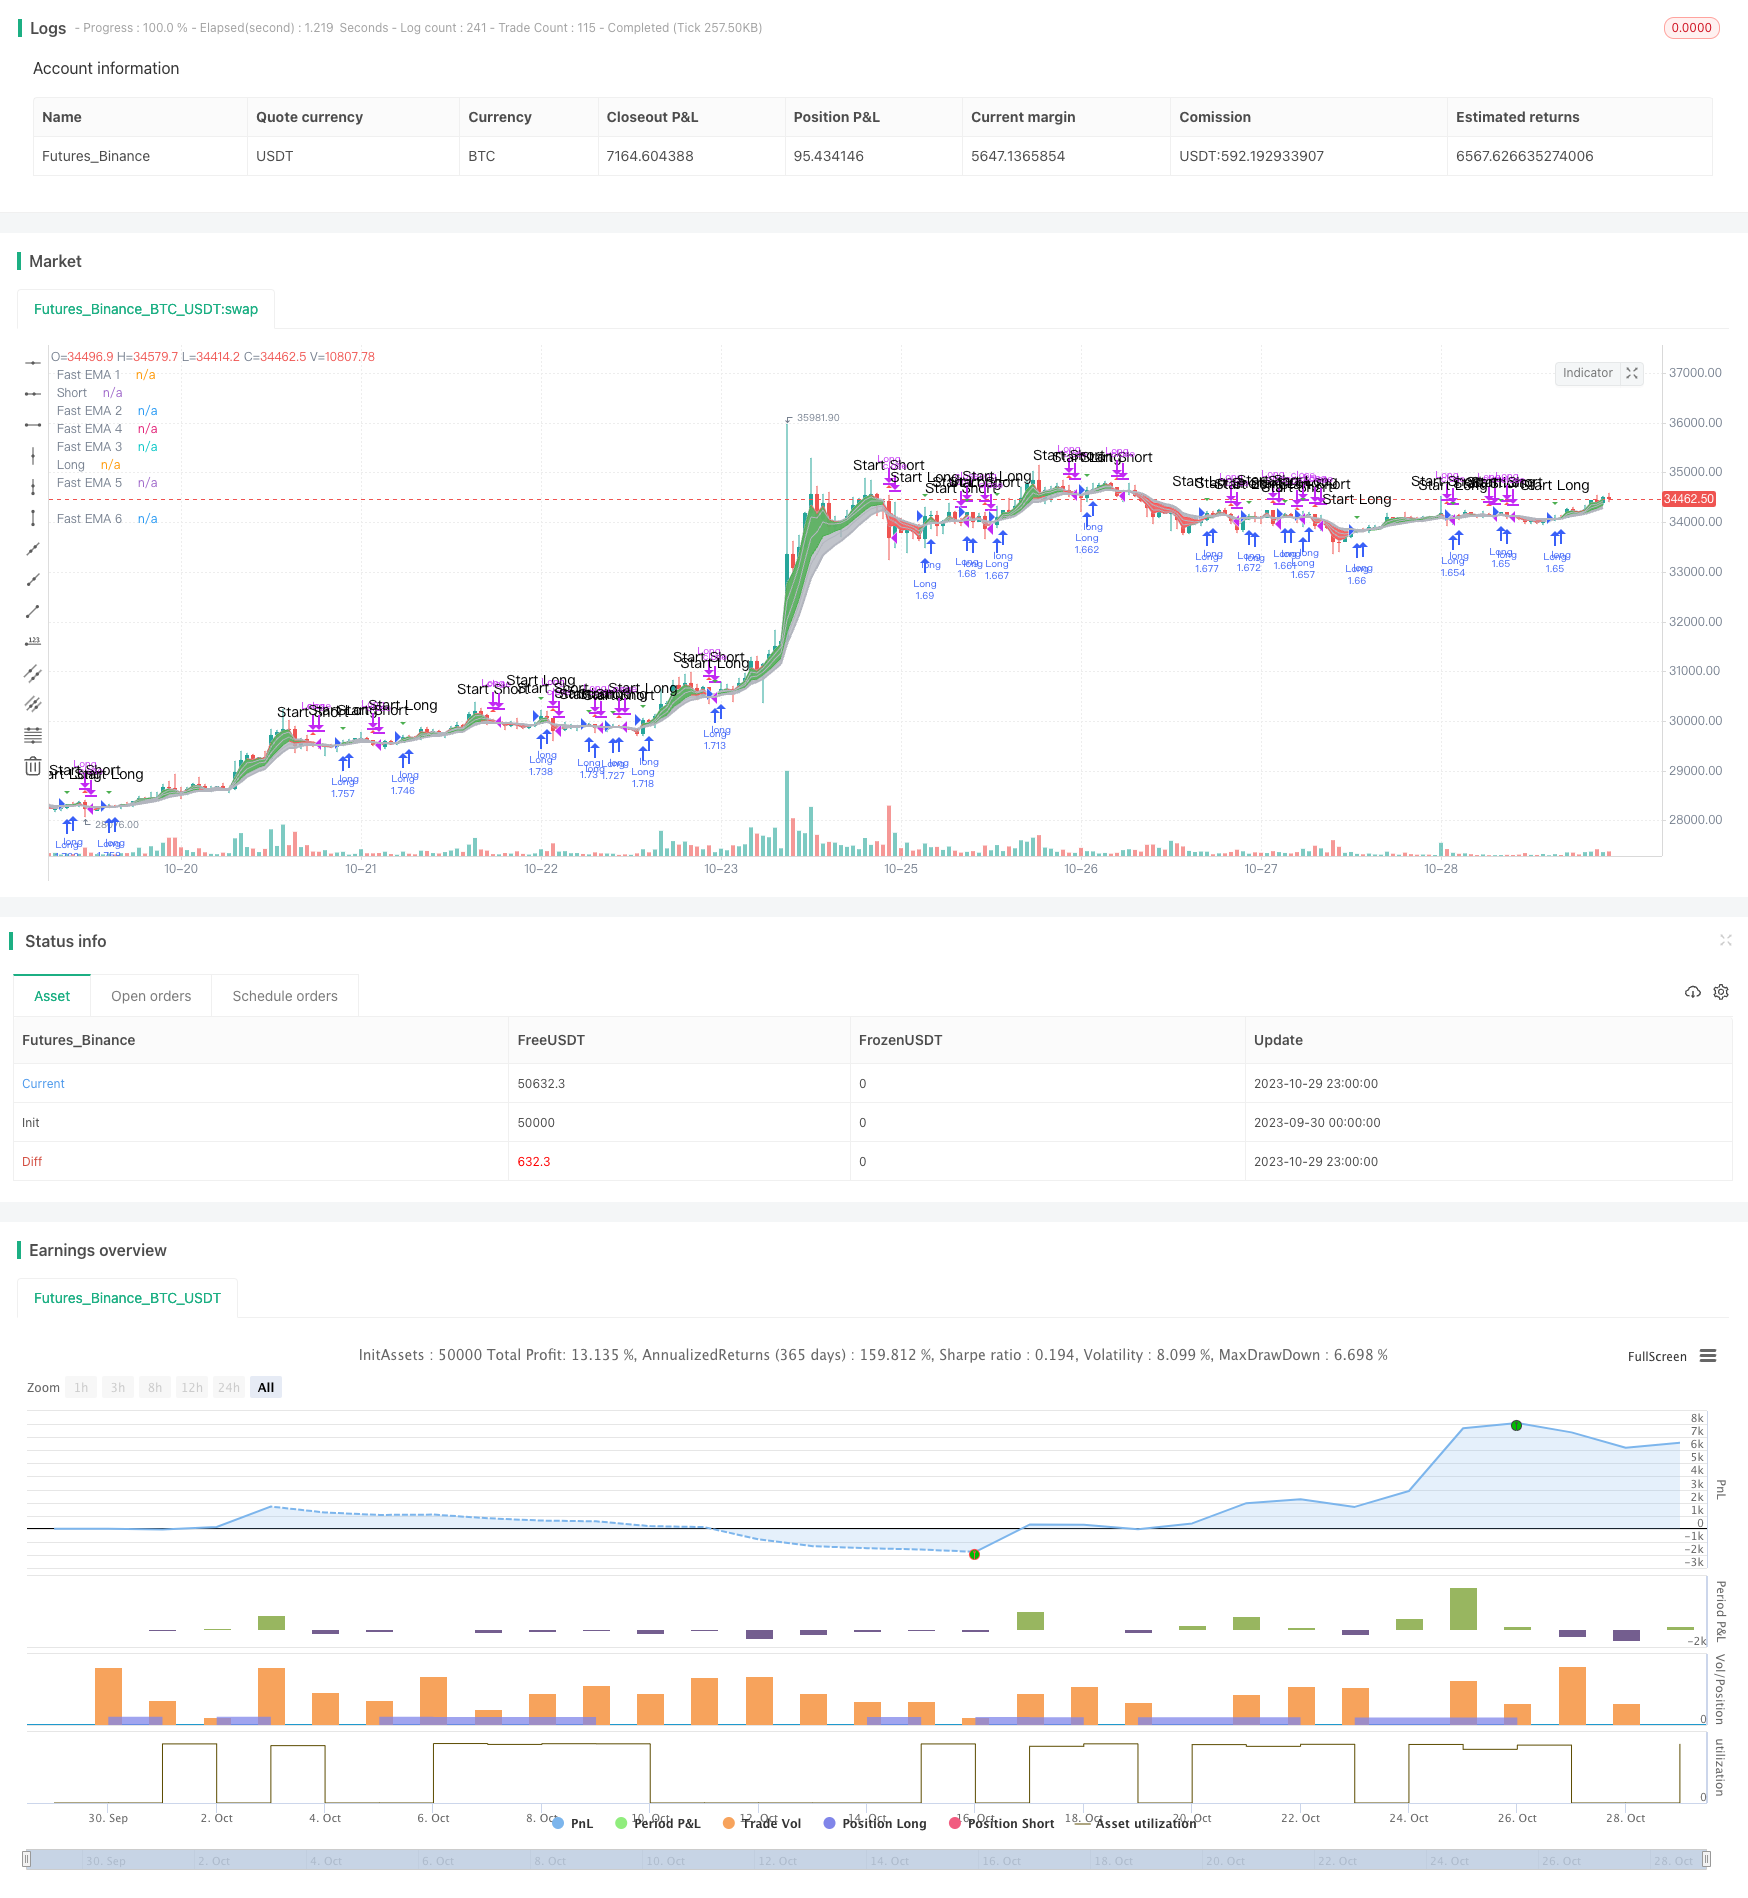
EMAクロスオーバーに基づくトレンド・トレーディング戦略
作者: リン・ハーンチャオチャン開催日:2023年10月31日 (月) 14:37:38タグ:

概要
この戦略の主なアイデアは,EMA指標の黄金十字と死十字信号を使用して購入・売却の決定を行うことです.高速および遅いEMAの複数のセットをプロットし,そのクロスオーバーに基づいて取引信号を生成します.
戦略の論理
この戦略は,まず,高速EMA ema1からema6まで,遅いEMA ema7からema12までを含む複数のEMAラインを定義し,その後,購入信号 buy_signalと販売信号 sell_signalを定義します.
-
購入シグナル buy_signal は ema1 が ema3 を越えるときに生成されます.
-
セールシグナル sell_signal は ema1 が ema3 よりも低い値を越えると生成されます.
短期EMAが長期EMAを超えると,市場の上昇傾向を示し,買い信号が発信されます.短期EMAが長期EMAを下回ると,下落傾向を示し,売り信号が発信されます.
戦略は,EMA線の交差を監視し,トレンド方向を決定し,それに応じて購入/販売の決定を下します.
利点分析
この戦略の利点は以下の通りです.
-
EMA線を使用してトレンドを決定することで 短期間の市場の騒音をフィルターし,取引信号をより信頼できます.
-
複数の EMA をプロットすることで,傾向の変化をより正確に識別できる.高速と遅い EMA の間のクロスオーバーは,重要な傾向のターニングポイントを把握するのに役立ちます.
-
戦略はシンプルで明確です.取引信号は EMA クロスによって生成され,量子取引で理解し,実装しやすくなります.
-
EMA 期間パラメータは,異なる製品や市場に適応するように調整できます.
リスク分析
この戦略のリスクは以下のとおりです.
-
EMA線は遅延効果があり,取引シグナルが遅れる可能性があります.
-
EMA パラメータの不正な選択は,誤った信号を生む可能性があります.
-
EMAの交差値では 市場差の誤った信号を 効果的にフィルタリングできません
-
EMAパラメータの最適化可能な空間が限られているため,過剰なフィッティングのリスクがあります.
解決策:
-
他の指標とフィルターを追加して,市場範囲で間違った信号を避ける.
-
テスト 安定性 異なる周期パラメータ オーバーフィット防止
-
パラメータを調整したり リスク制御のための出口メカニズムを追加したり
オプティマイゼーションの方向性
この戦略は,次の側面においてさらに最適化することができる.
-
ストップ・ロスは出口ポジションに追加します.
-
追加的な買い/売る信号で再入力の論理を実装する.
-
EMAのクロスオーバー期間のパラメータを最適化して 最良の結果を得る.
-
信号の質を改善するために,多因子検証のための他の指標を組み込む.
-
テストパラメータの調整を異なる製品で,最適な適用性を探す.
-
リアルタイムの取引では スリップを考慮し バックテストで最適化します
概要
これは,EMAクロスオーバーに基づいたシンプルなトレンドフォロー戦略である.トレンド変化を特定できるが,遅延効果やウィップソーなどのリスクも伴う.ストップ損失,パラメータ最適化,マルチファクタリアル検証などの強化により,バックテストおよびライブ取引における戦略パフォーマンスをさらに改善することができる.
/*backtest
start: 2023-09-30 00:00:00
end: 2023-10-30 00:00:00
period: 1h
basePeriod: 15m
exchanges: [{"eid":"Futures_Binance","currency":"BTC_USDT"}]
*/

//@version=3
//Companion Strategy script to my Cloud Study. Enjoy! -MP
// study("MP's Cloud Study", overlay=true)
strategy(title="MP's Cloud Strat'", shorttitle="MP's Cloud Strat", overlay=true, precision=6, pyramiding=0, initial_capital=10000, currency="USD", default_qty_type=strategy.percent_of_equity,calc_on_order_fills= false, calc_on_every_tick=false, default_qty_value=100.0, commission_type=strategy.commission.percent, commission_value=0.05)

//bgcolor ( color=black, transp=20, title='Blackground', editable=true)

src = close, len1 = input(2, minval=1, title="Short EMA")
src2 = close, len3 = input(7, minval=1, title="Long EMA")
emaShort = ema(src, len1)
emaLong = ema(src2, len3)


StartYear = input(2018, "Start Year")
StartMonth = input(01, "Start Month")
StartDay = input(18, "Start Day")


StopYear = input(2018, "Stop Year")
StopMonth = input(12, "Stop Month")
StopDay = input(26, "Stop Day")
tradeStop = timestamp(StopYear,StopMonth,StopDay,0,0)

//src = close,
//len1 = input(3, minval=1, title="Fast EMA 1")
len2 = input(3, minval=1, title="Fast EMA 2")
//len3 = input(8, minval=1, title="Fast EMA 3")
len4 = input(5, minval=1, title="Fast EMA 4")
len5 = input(8, minval=1, title="Fast EMA 5")
len6 = input(10, minval=1, title="Fast EMA 6")
//Slow EMA
len7 = input(30, minval=1, title="Slow EMA 7")
len8 = input(35, minval=1, title="Slow EMA 8")
len9 = input(40, minval=1, title="Slow EMA 9")
len10 = input(45, minval=1, title="Slow EMA 10")
len11 = input(50, minval=1, title="Slow EMA 11")
len12 = input(60, minval=1, title="Slow EMA 12")

//Fast EMA
ema1 = ema(src, len1)
ema2 = ema(src, len2)
ema3 = ema(src, len3)
ema4 = ema(src, len4)
ema5 = ema(src, len5)
ema6 = ema(src, len6)
//Slow EMA
ema7 = ema(src, len7)
ema8 = ema(src, len8)
ema9 = ema(src, len9)
ema10 = ema(src, len10)
ema11 = ema(src, len11)
ema12 = ema(src, len12)

//Fast EMA Color Rules
//colfastL = (ema1 > ema2 and ema2 > ema3 and ema3 > ema4 and ema4 > ema5 and ema5 > ema6)
colfastS = (ema1 < ema2 and ema2 < ema3 and ema3 < ema4 and ema4 < ema5 and ema5 < ema6)
//Slow EMA Color Rules
//colslowL = ema7 > ema8 and ema8 > ema9 and ema9 > ema10 and ema10 > ema11 and ema11 > ema12
//colslowS = ema7 < ema8 and ema8 < ema9 and ema9 < ema10 and ema10 < ema11 and ema11 < ema12
//Fast EMA Final Color Rules
//colFinal = colfastL and colslowL? aqua : colfastS and colslowS? orange : gray
//Slow EMA Final Color Rules
//colFinal2 = colslowL  ? lime : colslowS ? red : gray
//Fast EMA Plots
p1=plot(ema1, title="Fast EMA 1", style=line, linewidth=2, color=silver)
plot(ema2, title="Fast EMA 2", style=line, linewidth=1, color=silver)
plot(ema3, title="Fast EMA 3", style=line, linewidth=1, color=silver)
plot(ema4, title="Fast EMA 4", style=line, linewidth=1, color=silver)
plot(ema5, title="Fast EMA 5", style=line, linewidth=1, color=silver)
p2=plot(ema6, title="Fast EMA 6", style=line, linewidth=2, color=silver)
fill(p1,p2,color=silver, transp=60)
//Slow EMA Plots
//p3=plot(ema7, title="Slow EMA 7", style=line, linewidth=4, color=colFinal2)
//plot(ema8, title="Slow EMA 8", style=line, linewidth=3, color=colFinal2)
//plot(ema9, title="Slow EMA 9", style=line, linewidth=3, color=colFinal2)
//plot(ema10, title="Slow EMA 10", style=line, linewidth=3, color=colFinal2)
//plot(ema11, title="Slow EMA 11", style=line, linewidth=3, color=colFinal2)
//p4=plot(ema12, title="Slow EMA 12", style=line, linewidth=4, color=colFinal2)
//fill(p3,p4, color=silver, transp=60)


//Plot the Ribbon
ma1=plot( emaShort,color=rising(emaShort,2)?green:red,linewidth=1,join=true,transp=20,title="Short")
ma2=plot( emaLong,color=rising(emaLong,2)?green:red,linewidth=1,join=true,transp=20,title="Long")
fcolor = emaShort>emaLong?green:red
fill(ma1,ma2,color=fcolor,transp=80,title="Ribbon Fill")


//fast = 4, slow = 16
//fastMA = ema(close, fast)
//slowMA = ema(close, slow)
//plot(fastMA, color=green, title = "buy/sell")
//plot(slowMA, color=red, title = "base")


//Conditions
buy_signal = crossover(ema1,ema3)
sell_signal = crossunder(ema1,ema3)

plotshape(sell_signal, style=shape.triangleup, color = red, text="Start Short")
plotshape(buy_signal, style=shape.triangledown, color = green, text="Start Long")

alertcondition(sell_signal, title = 'Sell/Short', message = 'e= s= c=position b=long t=market l= | delay=30 | e= s= b=short l= t=market q=0.01')
alertcondition(buy_signal, title = 'Buy/Long', message =  'e= s= c=position b=short t=market l= | delay=30 | e= s= b=long l= t=market q=0.01')

//alertcondition(sell_signal, title = 'Sell/Short', message = 'e= s= c=order b=buy | delay=3 | e= b=sell q=99% p=0.70% u=currency')
//alertcondition(buy_signal, title = 'Buy/Long', message =  'e= s= c=order b=sell | delay=30 | e= b=buy q=80 p=0.1% u=currency')


testStartYear = input(2018, "From Year")
testStartMonth = input(1, "From Month")
testStartDay = input(1, "From Day")
testPeriodStart = timestamp(testStartYear,testStartMonth,testStartDay,0,0)

testStopYear = input(2019, "To Year")
testStopMonth = input(1, "To Month")
testStopDay = input(1, "To Day")
testPeriodStop = timestamp(testStopYear,testStopMonth,testStopDay,0,0)

testPeriod() => true

if testPeriod()
    if buy_signal
        strategy.entry("Long", true)


    if sell_signal
        strategy.close("Long")
- ドンチアン・チャネルに基づく戦略を踏まえた傾向
- ローズクロススター・デュアル・インディケーター・ボラティリティ戦略
- アダプティブATRトレンドブレイク戦略
- ボリンジャー・バンド・モメンタム・バースト戦略
- 多要素戦略
- 定期的な投資に基づくゴールデントレンド追跡戦略
- イチモク・キンコ・ヒョウ 十字戦略
- 多角形の移動平均戦略
- Pivot Detector オシレーター トレンド トレーディング 戦略
- バリアンスリバーション取引戦略
- ボリンジャーバンド逆転振動トレンド戦略
- EMAとMAMA指標に基づく取引戦略
- エラーズの主要指標取引戦略
- 移動平均値に基づいたトレンドフォロー戦略
- レレデック DEC 戦略
- Auto Buy Scalper 戦略でストカスティックRSI
- 拡張性のあるブレイクアウト取引戦略
- ボリンジャー・バンドとストックRSIのモメンタム戦略
- RSI ロング・ショート 自動取引戦略
- トレンドレスMACD戦略