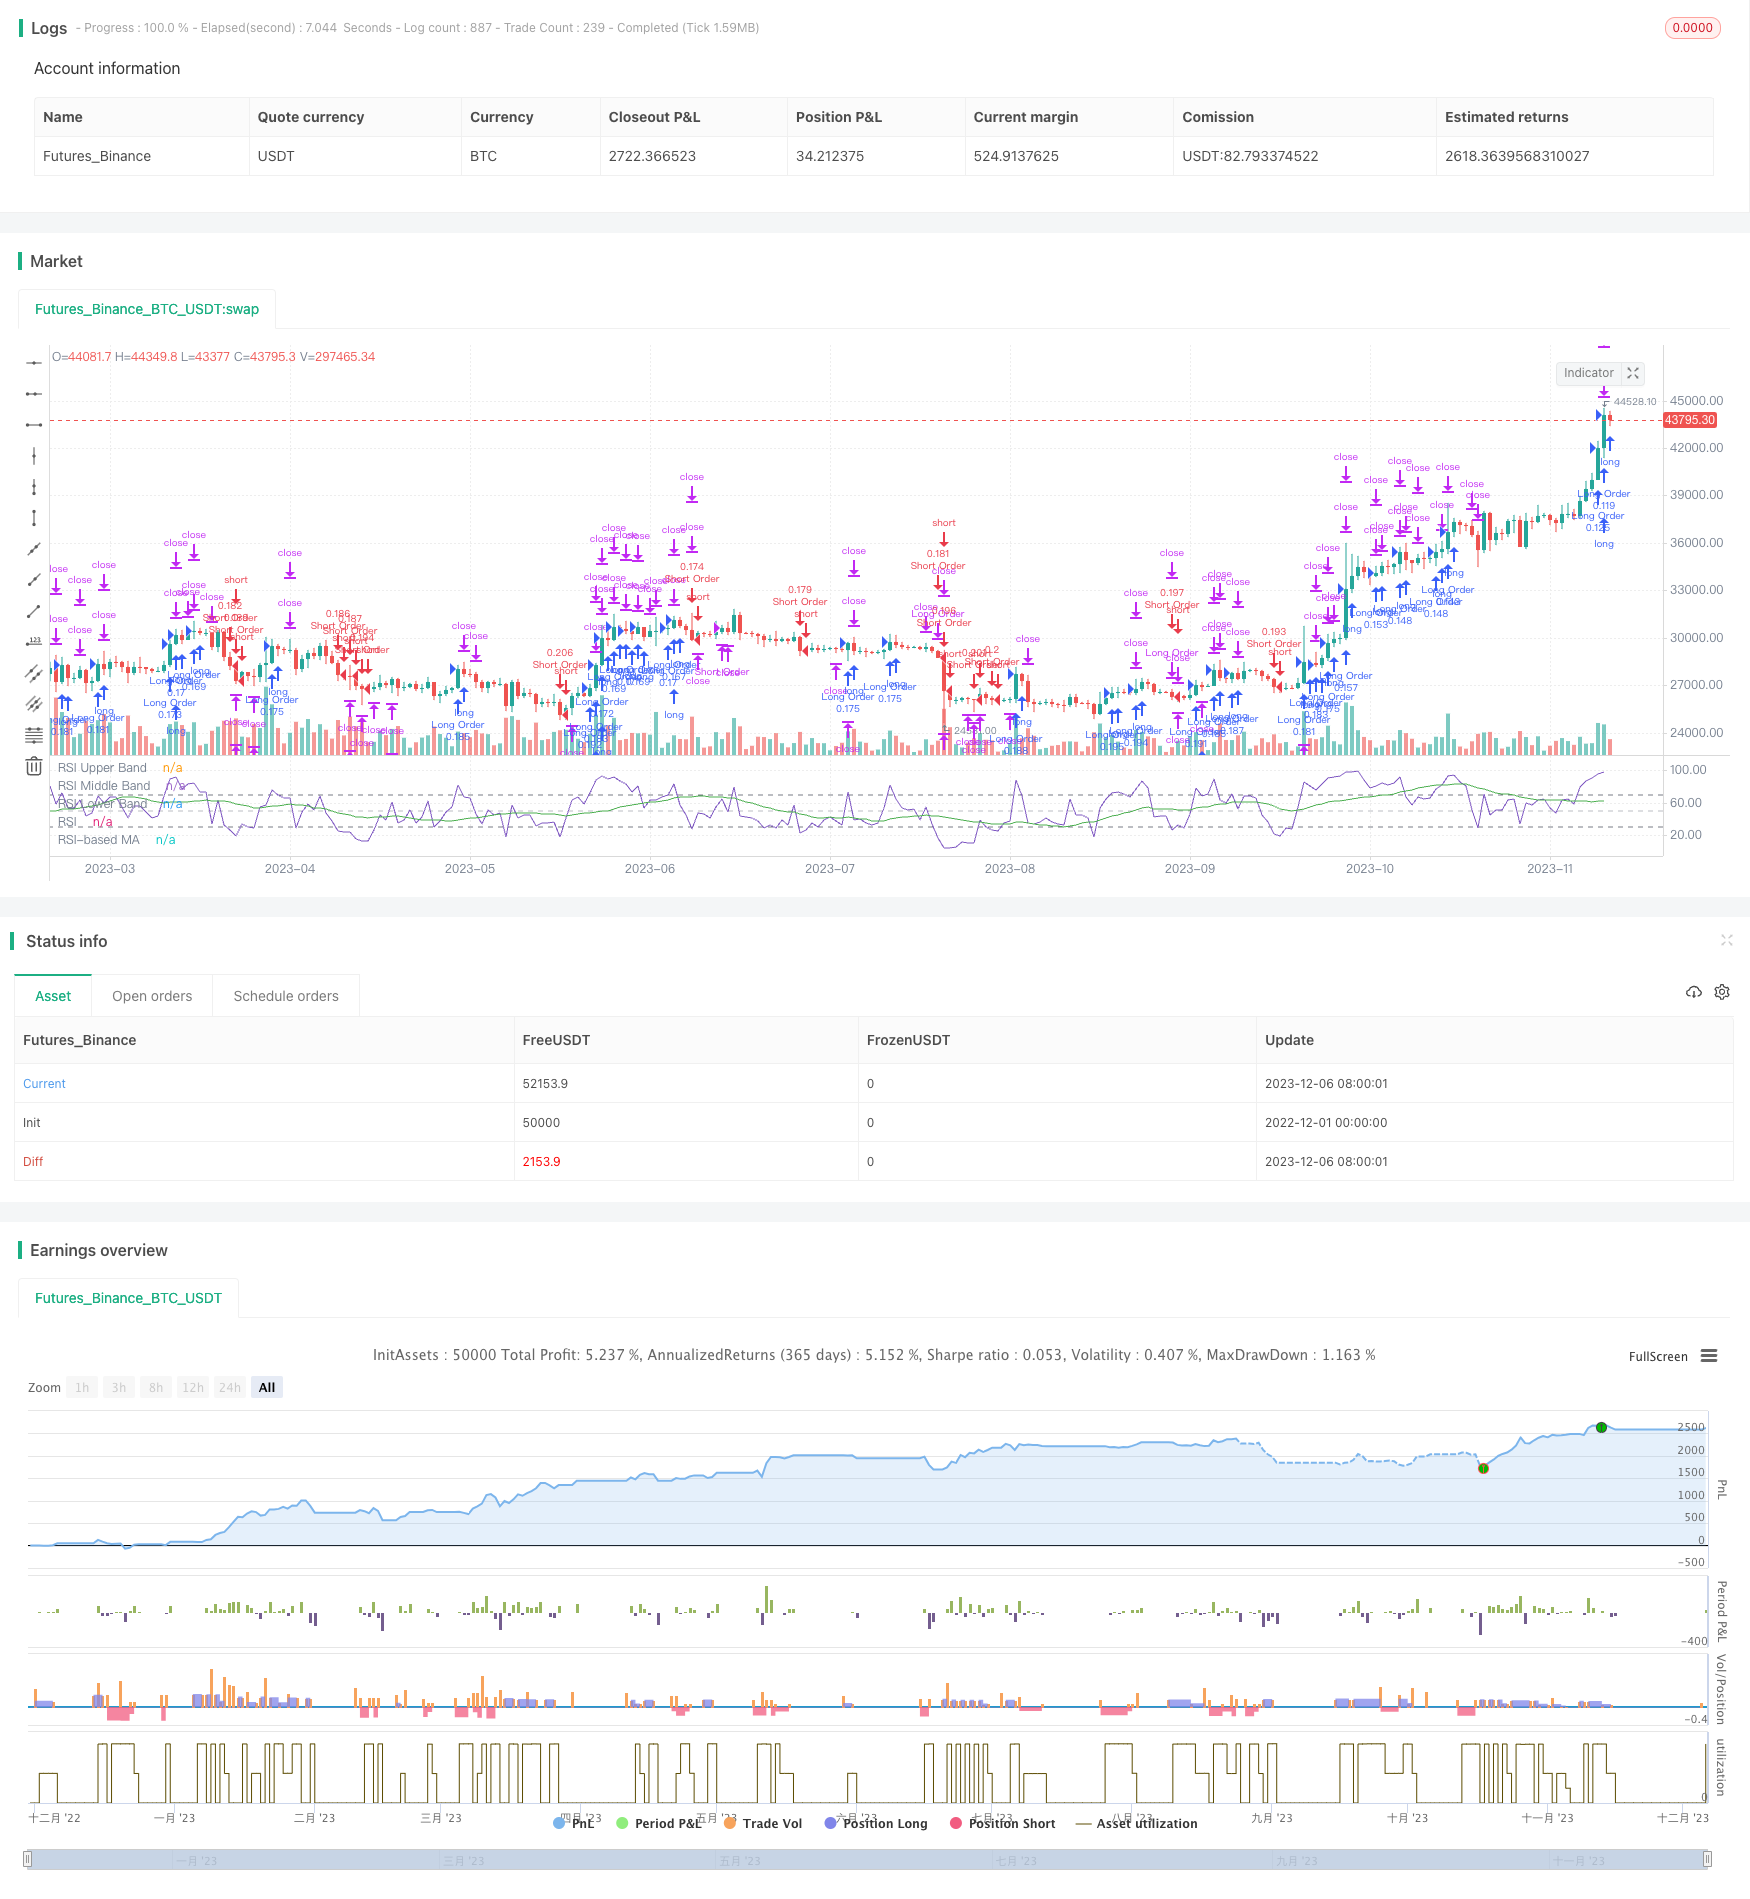
RSI トレンド トレイリングストップロスの戦略
作者: リン・ハーンチャオチャン, 日時: 2023-12-08 11:41:31タグ:

概要
この戦略は,RSI指標を使用してトレンドを特定し,移動平均値,ストップ・ロスト,テイク・プロフィート設定でトレンドを確認する自動化された取引戦略である.RSIが68を超え,現在の移動平均値が前の移動平均値を超えるとロングになり,RSIが28を下回り,現在の移動平均値が前の移動平均値を下回るとショートになります.ストップ・ロストとテイク・プロフィートポイントも設定されています.
戦略の論理
この戦略は,主にRSI指標を使用して,傾向を決定するために過剰購入および過剰販売状態を特定する.RSIの70以上の値は過剰購入状態を示し,30以下の値は過剰販売状態を示します.トレンドは移動平均値から黄金十字と死亡十字信号を使用して確認されます.具体的な取引信号は:
ロングシグナル:RSIが68を超え,現在の移動平均が前回の移動平均を超えるとロングになります.
ショートシグナル:RSIが28を下回り,現在の移動平均値が前回の移動平均値を下回るとショートになります
ストップ・ロストとテイク・プロフィートの設定は 緩やかから厳格まで 段階的に設定されています
利回り: 利回り 1.4% の高値で ポジションの50% 利回り 0.8% の高値で 利回り 100%
ロングストップ・ロスは,エントリー価格を下回り2%でストップ・ロスを設定します.
ショート・テイク・プロフィート: 低値の0.4%以下でポジションの50%の利益,低値の0.8%以下で100%の利益. ショートストップ損失: 入場価格の 2% にストップ損失を設定する.
また,トレンドが逆転すると,例えばRSIがロングで30を下回ると,市場での全ロングポジションを閉じる.
利点
- RSI を使って買い過ぎ/売過ぎを判断し,高値で買い過ぎで売れ過ぎを避ける.
- 移動平均値のフィルターで,主要なトレンドに対する取引を減らす.
- 利益の最大化のために 利益の目標を取ります
- ストップロスの幅が広い場合,リトラセッションが可能です.
- トレンド逆転に基づくポジション閉鎖は 突然の出来事に対して迅速に対応します
リスク
- RSIパラメータの調節が悪くて 信号が不正確だ
- 移動平均のパラメータの調節が不十分で フィルタリングが弱くなる
- ストップ損失が大きすぎると 損失が大きくなります
- 利益は太りすぎて 利益はテーブルに置いておく
- 不正確な逆転信号で 不必要に位置を閉じる
上記のリスクに対処するために,パラメータを幅広く調整する必要があります. ストップ・ロストとテイク・プロフィートは,市場の変動に基づいて適切に設定する必要があります. 不必要な損失を避けるために,逆転信号は慎重に使用する必要があります.
増進 の 機会
この戦略はさらに改善できる.
- 音量などのフィルターを追加して 信号の精度を向上します
- 利益を確保するためにストップロスを実行します
- 利潤を最大化するために,いくつかの出口のために利益を取ります.
- 最適なパラメータを使用するために 計器の切り替えを追加します.
- 動的にストップを調整するために,先物に対する運搬コストを組み込む.
結論
一般的には,これは成熟した信頼性の高いトレンドフォロー戦略である.RSIを使用してトレンドをよく特定し,移動平均値でさらにフィルターを設定する.また,合理的なストップ損失と段階的な利益の設定を実装する.適切に調整された場合,トレンド市場では非常にうまく機能することができます.さらなる最適化はさらに優れたパフォーマンスにつながります.
// © CRabbit
//@version=5

// Starting with $100 and using 10% of the account per trade
strategy("RSI Template", shorttitle="RSI", overlay=false, initial_capital=100, default_qty_value=10, default_qty_type=strategy.percent_of_equity)

// RSI Indicator
ma(source, length, type) =>
    switch type
        "SMA" => ta.sma(source, length)
        "Bollinger Bands" => ta.sma(source, length)
        "EMA" => ta.ema(source, length)
        "SMMA (RMA)" => ta.rma(source, length)
        "WMA" => ta.wma(source, length)
        "VWMA" => ta.vwma(source, length)

rsiLengthInput = input.int(4, minval=1, title="RSI Length", group="RSI Settings")
rsiSourceInput = input.source(close, "Source", group="RSI Settings")
maTypeInput = input.string("SMA", title="MA Type", options=["SMA", "Bollinger Bands", "EMA", "SMMA (RMA)", "WMA", "VWMA"], group="MA Settings")
maLengthInput = input.int(23, title="MA Length", group="MA Settings")
bbMultInput = input.float(2.0, minval=0.001, maxval=50, title="BB StdDev", group="MA Settings")

up = ta.rma(math.max(ta.change(rsiSourceInput), 0), rsiLengthInput)
down = ta.rma(-math.min(ta.change(rsiSourceInput), 0), rsiLengthInput)
rsi = down == 0 ? 100 : up == 0 ? 0 : 100 - (100 / (1 + up / down))
rsiMA = ma(rsi, maLengthInput, maTypeInput)
isBB = maTypeInput == "Bollinger Bands"

plot(rsi, "RSI", color=#7E57C2)
plot(rsiMA, "RSI-based MA", color=color.green)
rsiUpperBand = hline(70, "RSI Upper Band", color=#787B86)
hline(50, "RSI Middle Band", color=color.new(#787B86, 50))
rsiLowerBand = hline(30, "RSI Lower Band", color=#787B86)
fill(rsiUpperBand, rsiLowerBand, color=color.rgb(126, 87, 194, 90), title="RSI Background Fill")


// Configure backtest start date with inputs
startDate = input.int(title="Start Date", defval=1, minval=1, maxval=31)
startMonth = input.int(title="Start Month", defval=6, minval=1, maxval=12)
startYear = input.int(title="Start Year", defval=2022, minval=1800, maxval=2100)

// See if this bar's time happened on/after start date
afterStartDate = (time >= timestamp(syminfo.timezone,
     startYear, startMonth, startDate, 0, 0))


// Long and Short buy strategy
// Submit a market open/ close Long order, but only on/after start date
if (afterStartDate)
    if rsi > 68 and (rsiMA > rsiMA[1])
        strategy.entry("Long Order", strategy.long, comment="ENTER-LONG")
    if rsi < 30
        strategy.close("Long Order", alert_message="L-CL")

strategy.exit("L-TP1", from_entry="Long Order", limit=high * 1.004, qty_percent=50, alert_message="L-TP1" + str.tostring(high * 1.004))
strategy.exit("L-TP2", from_entry="Long Order", limit=high * 1.008, qty_percent=100, alert_message="L-TP2" + str.tostring(high * 1.008))
strategy.exit("Exit Long", from_entry="Long Order", stop=low * 0.98, alert_message="L-SL" + str.tostring(low * 0.98))


// Submit a market Open/ Close Short order, but only on/after start date
if (afterStartDate)
    if rsi < 28 and (rsiMA < rsiMA[1])
        strategy.entry("Short Order", strategy.short, comment="ENTER-SHORT")
    if rsi > 60
        strategy.close("Short Order", alert_message="S-CL")

strategy.exit("S-TP1", from_entry="Short Order", limit=low * 0.996, qty_percent=50, alert_message="S-TP1" + str.tostring(low * 0.996))
strategy.exit("S-TP2", from_entry="Short Order", limit=low * 0.992, qty_percent=100, alert_message="S-TP2" + str.tostring(low * 0.992))
strategy.exit("Exit Short", from_entry="Short Order", stop=high * 1.02, alert_message="S-SL" + str.tostring(high * 1.02))

// MONTHLY TABLE //

prec      = input(2, title = "Return Precision")

new_month = month(time) != month(time[1])
new_year  = year(time)  != year(time[1])

eq = strategy.equity

bar_pnl = eq / eq[1] - 1

cur_month_pnl = 0.0
cur_year_pnl  = 0.0

// Current Monthly P&L
cur_month_pnl := new_month ? 0.0 :
                 (1 + cur_month_pnl[1]) * (1 + bar_pnl) - 1

// Current Yearly P&L
cur_year_pnl := new_year ? 0.0 :
                 (1 + cur_year_pnl[1]) * (1 + bar_pnl) - 1

// Arrays to store Yearly and Monthly P&Ls
var month_pnl  = array.new_float(0)
var month_time = array.new_int(0)

var year_pnl  = array.new_float(0)
var year_time = array.new_int(0)

if (not na(cur_month_pnl[1]) and (new_month or barstate.islast))
    array.push(month_pnl , cur_month_pnl[1])
    array.push(month_time, time[1])

if (not na(cur_year_pnl[1]) and (new_year or barstate.islast))
    array.push(year_pnl , cur_year_pnl[1])
    array.push(year_time, time[1])

// Monthly P&L Table
var monthly_table = table(na)

if (barstate.islast)
    monthly_table := table.new(position.bottom_right, columns = 14, rows = array.size(year_pnl) + 1, border_width = 1)

    table.cell(monthly_table, 0,  0, "",     bgcolor = #cccccc)
    table.cell(monthly_table, 1,  0, "Jan",  bgcolor = #cccccc)
    table.cell(monthly_table, 2,  0, "Feb",  bgcolor = #cccccc)
    table.cell(monthly_table, 3,  0, "Mar",  bgcolor = #cccccc)
    table.cell(monthly_table, 4,  0, "Apr",  bgcolor = #cccccc)
    table.cell(monthly_table, 5,  0, "May",  bgcolor = #cccccc)
    table.cell(monthly_table, 6,  0, "Jun",  bgcolor = #cccccc)
    table.cell(monthly_table, 7,  0, "Jul",  bgcolor = #cccccc)
    table.cell(monthly_table, 8,  0, "Aug",  bgcolor = #cccccc)
    table.cell(monthly_table, 9,  0, "Sep",  bgcolor = #cccccc)
    table.cell(monthly_table, 10, 0, "Oct",  bgcolor = #cccccc)
    table.cell(monthly_table, 11, 0, "Nov",  bgcolor = #cccccc)
    table.cell(monthly_table, 12, 0, "Dec",  bgcolor = #cccccc)
    table.cell(monthly_table, 13, 0, "Year", bgcolor = #999999)


    for yi = 0 to array.size(year_pnl) - 1
        table.cell(monthly_table, 0,  yi + 1, str.tostring(year(array.get(year_time, yi))), bgcolor = #cccccc)

        y_color = array.get(year_pnl, yi) > 0 ? color.new(color.green, transp = 50) : color.new(color.red, transp = 50)
        table.cell(monthly_table, 13, yi + 1, str.tostring(math.round(array.get(year_pnl, yi) * 100, prec)), bgcolor = y_color)

    for mi = 0 to array.size(month_time) - 1
        m_row   = year(array.get(month_time, mi))  - year(array.get(year_time, 0)) + 1
        m_col   = month(array.get(month_time, mi))
        m_color = array.get(month_pnl, mi) > 0 ? color.new(color.green, transp = 70) : color.new(color.red, transp = 70)

        table.cell(monthly_table, m_col, m_row, str.tostring(math.round(array.get(month_pnl, mi) * 100, prec)), bgcolor = m_color)
- 移動平均のクロスオーバー戦略
- 価格チャネルとMACDベースのマルチタイムフレーム取引戦略
- バイノミアル移動平均トレンド戦略
- 移動平均のクロスオーバー戦略
- トレンドと移動平均のクロスオーバーに基づく多機能アルゴリズム取引戦略
- 移動平均ボリンガー帯のブレイクアウト戦略
- グリッド戦略をフォローする傾向
- 逆転と将来の境界線を統合する定量的な取引戦略
- ボリンジャー帯とハル指標の交差戦略
- トートルブレイクダウン 適応型取引戦略
- 逆転動的ピボットポイント 指数関数移動平均戦略
- kNNベースのトレンドフォロー戦略
- シンプルなモメンタム戦略,SMA,EMA,ボリュームに基づく
- ドンチアン・チャネルズ ブレイク量的な取引戦略
- N 連続的な高値 閉じる 脱出戦略
- 賢明な定量的な底辺逆転取引戦略
- Bollinger + RSI ダブル戦略 (ロングのみ) v1.2
- CCIのゼロ・クロス・トレーディング戦略
- 2つの移動平均価格逆転のブレイクアウト戦略
- 移動平均回帰取引戦略