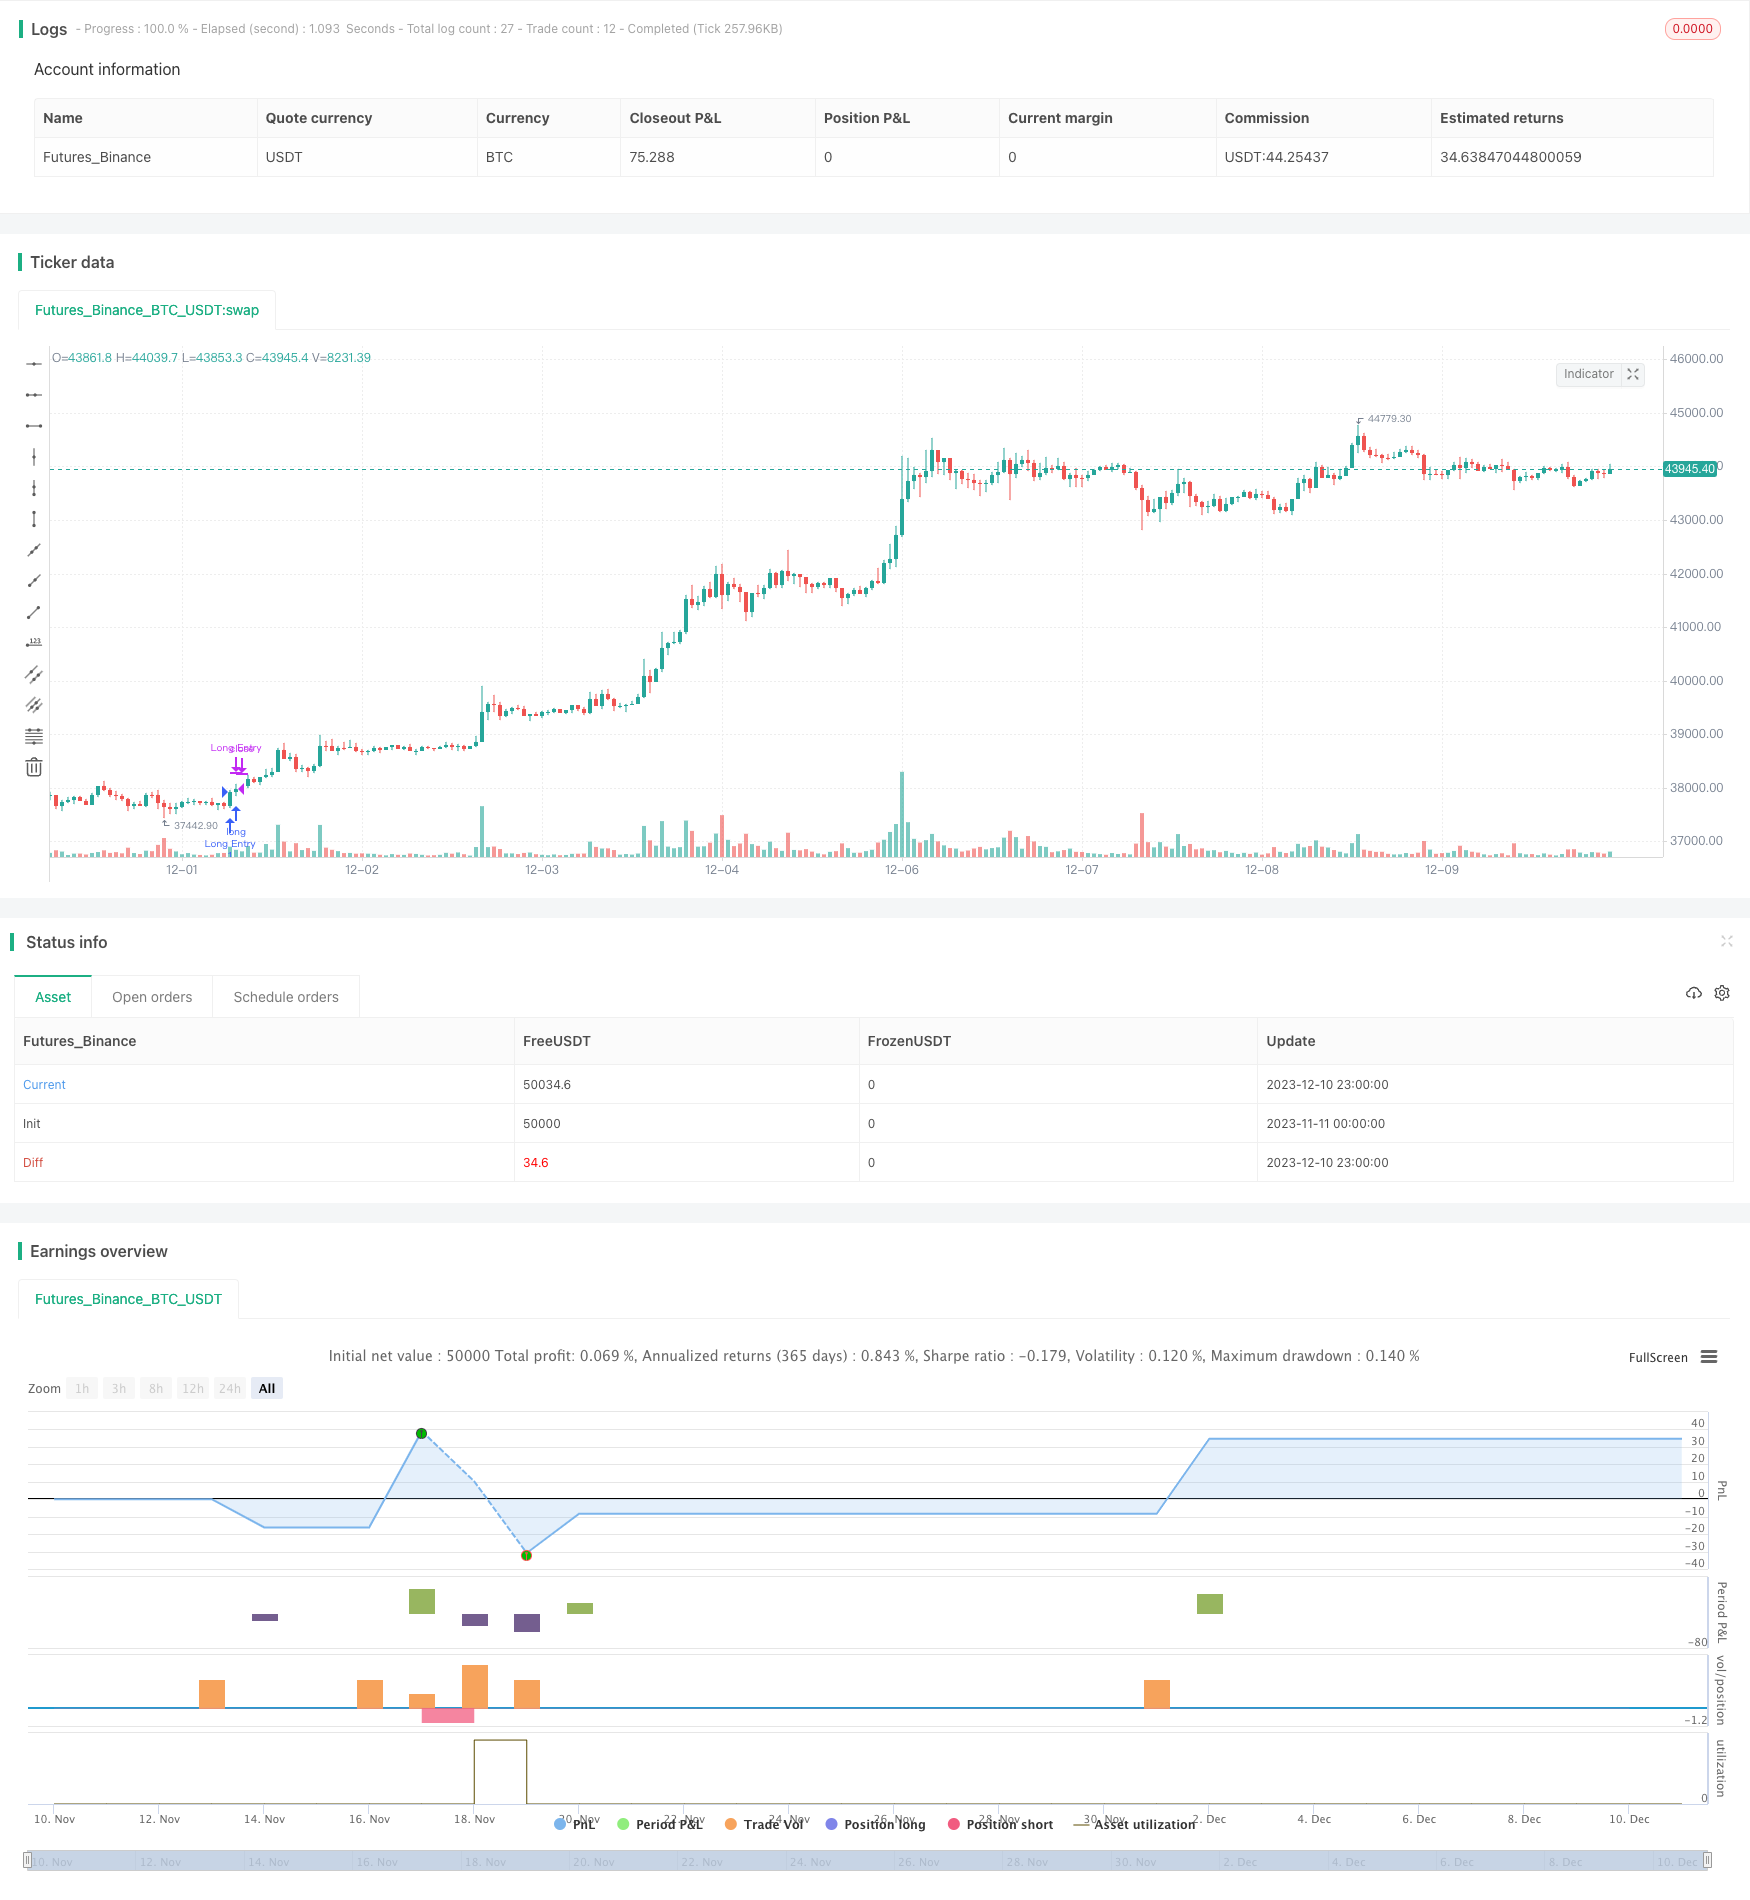
トレンドトラッキング戦略 真の強度指数と組み合わせたダブル・ヴォルテックス指標に基づく
作者: リン・ハーンチャオチャン開催日:2023年12月12日 16:23:10タグ:

概要
この戦略は,ド્યુઅલ・ヴォルテックス・インディケーターとTrue-Strength Indexを組み合わせたトレンド・トラッキング・ストラテジーと呼ばれる.ド્યુઅલ・ヴォルテックス・インディケーターとTrue-Strength Indexが買い売り信号を発行するときに,ロングとショートポジションを開き,中長期のトレンドを把握するために特定の価格動きの後,ポジションを閉じる.
戦略の論理
この戦略は,二重渦輪指標と真の強度指数 (TSI) を両方使用する.二重渦輪指標は,順番に上向きと下向きの勢力の大きさを反映するVI+とVI-線で構成される.TSIには,価格変動の強さと方向性を測定する赤と青の線がある.
VI+が上昇し,VI-が下がると,上向きの勢いが強まり,下向きの勢いが弱まることを示します.ダブル・ヴォルテックスインジケーターはロング信号を生成します.同時に,TSIの青い線が赤線を越えると,TSIもロング信号を発します.戦略は,両方の指標が同時にロング信号を発するとロングポジションを開きます.
対照的に,VI+が低下し,VI-が上昇すると,上向きモメンタムが弱まり,下向きモメンタムが強くなることをシグナルとして,ダブル・ヴォルテックスはショート・シグナルを発します. TSIの青い線が赤線以下を横切る場合,TSIもショート・シグナルを発します.戦略は,並べたショート・シグナルを受け取るとショート・ポジションを開きます.
この2つの指標からのシグナルを組み合わせることで,戦略は中長期のトレンドを特定し,追跡することができる.トレンドが終了すると,出口シグナルが生成される.したがって,この戦略は,市場の大きなトレンドに従う動きを効果的に把握することができます.
利点分析
この戦略の主な利点は以下の通りである.
- 二重表示フィルターは信号の信頼性を向上させ 偽信号を回避します
- 中期から長期の指標を採用することで,より大きな動向を把握できます.短期信号は市場の騒音によって混乱する傾向があります.
- パラメータ調整による保持期間柔軟な調整.これはトレンド追跡と単一の取引リスク管理の両方を可能にします.
- トレンドフォローとリスク管理のバランス付け.指標はトレンドを適切に識別する.リスクは出口価格波を設定することによって制御される.
リスク分析
リスクもあります:
- 中期から長期にわたる保有は,ストップ・ロスのためにウィプソー価格のアクションに直面する可能性があります.これは,出口波期間を短縮したり,ストップ・ロスを適切に調整することによって緩和することができます.
- 偽信号の確率は,二重インジケーターフィルターにもかかわらず,依然として存在します.追加のインジケーター確認またはパラメータ調整が役立ちます.
- 資本運用効率は比較的低い.資本は長期にわたって保有されるため,ポジションサイズを調整して資金利用を最適化することができる.
- 傾向市場への依存:不必要な損失を避けるため,レンジ市場でのポジションサイズを減らすべきです.
オプティマイゼーションの方向性
戦略を最適化する方法には以下の通りがあります.
- 複数のフィルタリングによる信号品質の強化のためにより多くの指標コンボを導入する.
- パラメータを最適化して,異なる製品の特性に適したものにします.
- ダイナミックなポジションサイズを追加して,トレンドのポジションを拡大し,市場範囲のサイズを削減する.
- リスク制御のために,ストップ損失を後押しするストップ損失や部分的なストップ損失を伴うストップ損失のメカニズムを組み込む.
- エリオット波分析を組み合わせて,方向フィルターとしてより大きな度合いの傾向を特定する.
- 機械学習を利用して パラメータとルールを自動最適化して 適応力を高めます
結論
概要すると,この戦略は,中長期トレンドフォローのアプローチである.ダブル・ヴォルテックス・インディケーターとTSIの技術を活用することで,中長期トレンドを信頼的に認識することができる.適切なパラメータ調整により,取引リスクは管理できる.より多くの指標とリスク管理技術を取り入れることでさらなる最適化によりパフォーマンスが向上する.中長期トレンド取引に興味のある投資家に適している.
/*backtest
start: 2023-11-11 00:00:00
end: 2023-12-11 00:00:00
period: 1h
basePeriod: 15m
exchanges: [{"eid":"Futures_Binance","currency":"BTC_USDT"}]
*/

// This source code is subject to the terms of the Mozilla Public License 2.0 at https://mozilla.org/MPL/2.0/
// © hydrelev

//@version=4
strategy("Vortex TSI strategy", overlay=false)
///////////////////INDICATOR TSI
long = input(title="Long Length", type=input.integer, defval=25)
short = input(title="Short Length", type=input.integer, defval=13)
signal = input(title="Signal Length", type=input.integer, defval=13)
price = close
double_smooth(src, long, short) =>
    fist_smooth = ema(src, long)
    ema(fist_smooth, short)
pc = change(price)
double_smoothed_pc = double_smooth(pc, long, short)
double_smoothed_abs_pc = double_smooth(abs(pc), long, short)
tsi_blue = 100 * (double_smoothed_pc / double_smoothed_abs_pc)
tsi_red = ema(tsi_blue, signal)
// plot(tsi_blue, color=#3BB3E4)
// plot(tsi_red, color=#FF006E)
// hline(0, title="Zero")

/////////////////INDICATOR VI
period_ = input(14, title="Period", minval=2)
VMP = sum( abs( high - low[1]), period_ )
VMM = sum( abs( low - high[1]), period_ )
STR = sum( atr(1), period_ )
VIP_blue = VMP / STR
VIM_red = VMM / STR
// plot(VIP_blue, title="VI +", color=#3BB3E4)
// plot(VIM_red, title="VI -", color=#FF006E)

////////////////////STRATEGY
bar=input(1, title="Close after x bar", minval=1, maxval=50)

tsi_long = crossover(tsi_blue, tsi_red)
tsi_short = crossunder(tsi_blue, tsi_red)
vi_long = crossover(VIP_blue, VIM_red)
vi_short = crossunder(VIP_blue, VIM_red)

LongConditionOpen = tsi_long and vi_long ? true : false
LongConditionClose = tsi_long[bar] and vi_long[bar] ? true : false
ShortConditionOpen = tsi_short and vi_short ? true : false
ShortConditionClose = tsi_short[bar] and vi_short[bar] ? true : false

if (LongConditionOpen)
    strategy.entry("Long Entry", strategy.long)
if (LongConditionClose)
    strategy.close("Long Entry")

if (ShortConditionOpen)
    strategy.entry("Short Entry", strategy.short)
if (ShortConditionClose)
    strategy.close("Short Entry")
- イチモク 資金管理による取引戦略
- 持続的なストップ損失取引戦略
- 勢いを逆転させる戦略
- ボリンジャー・バンド 素晴らしいオシレーター ブレイクトレード戦略
- EMAのクロスオーバー取引戦略
- 戦略をフォローするディバージェンツマトリックス傾向
- 重力中心のバックテスト トレーディング戦略
- ターンポイントのブレイクアウト戦略
- モメント・プルバック・戦略
- RSI トレンド 仮想通貨戦略
- イチモク 初期の雲のトレンド 戦略をフォローする
- 複数の時間枠移動平均システム取引戦略
- EVWMA 戦略をフォローする傾向
- 変化率 定量戦略
- 振動抑制戦略のEMA追跡傾向
- RSI インディケーターをベースにしたスカルピング戦略
- 量と価格の復旧 多重取上げ利益による高度な戦略
- 長期的トレンドを追跡するシンプルな引き戻し戦略
- RSI インディケーターと200日SMAフィルターに基づく間接的な強度指数戦略
- ストカスティックモメントムインデックスとRSIベースの量子取引戦略