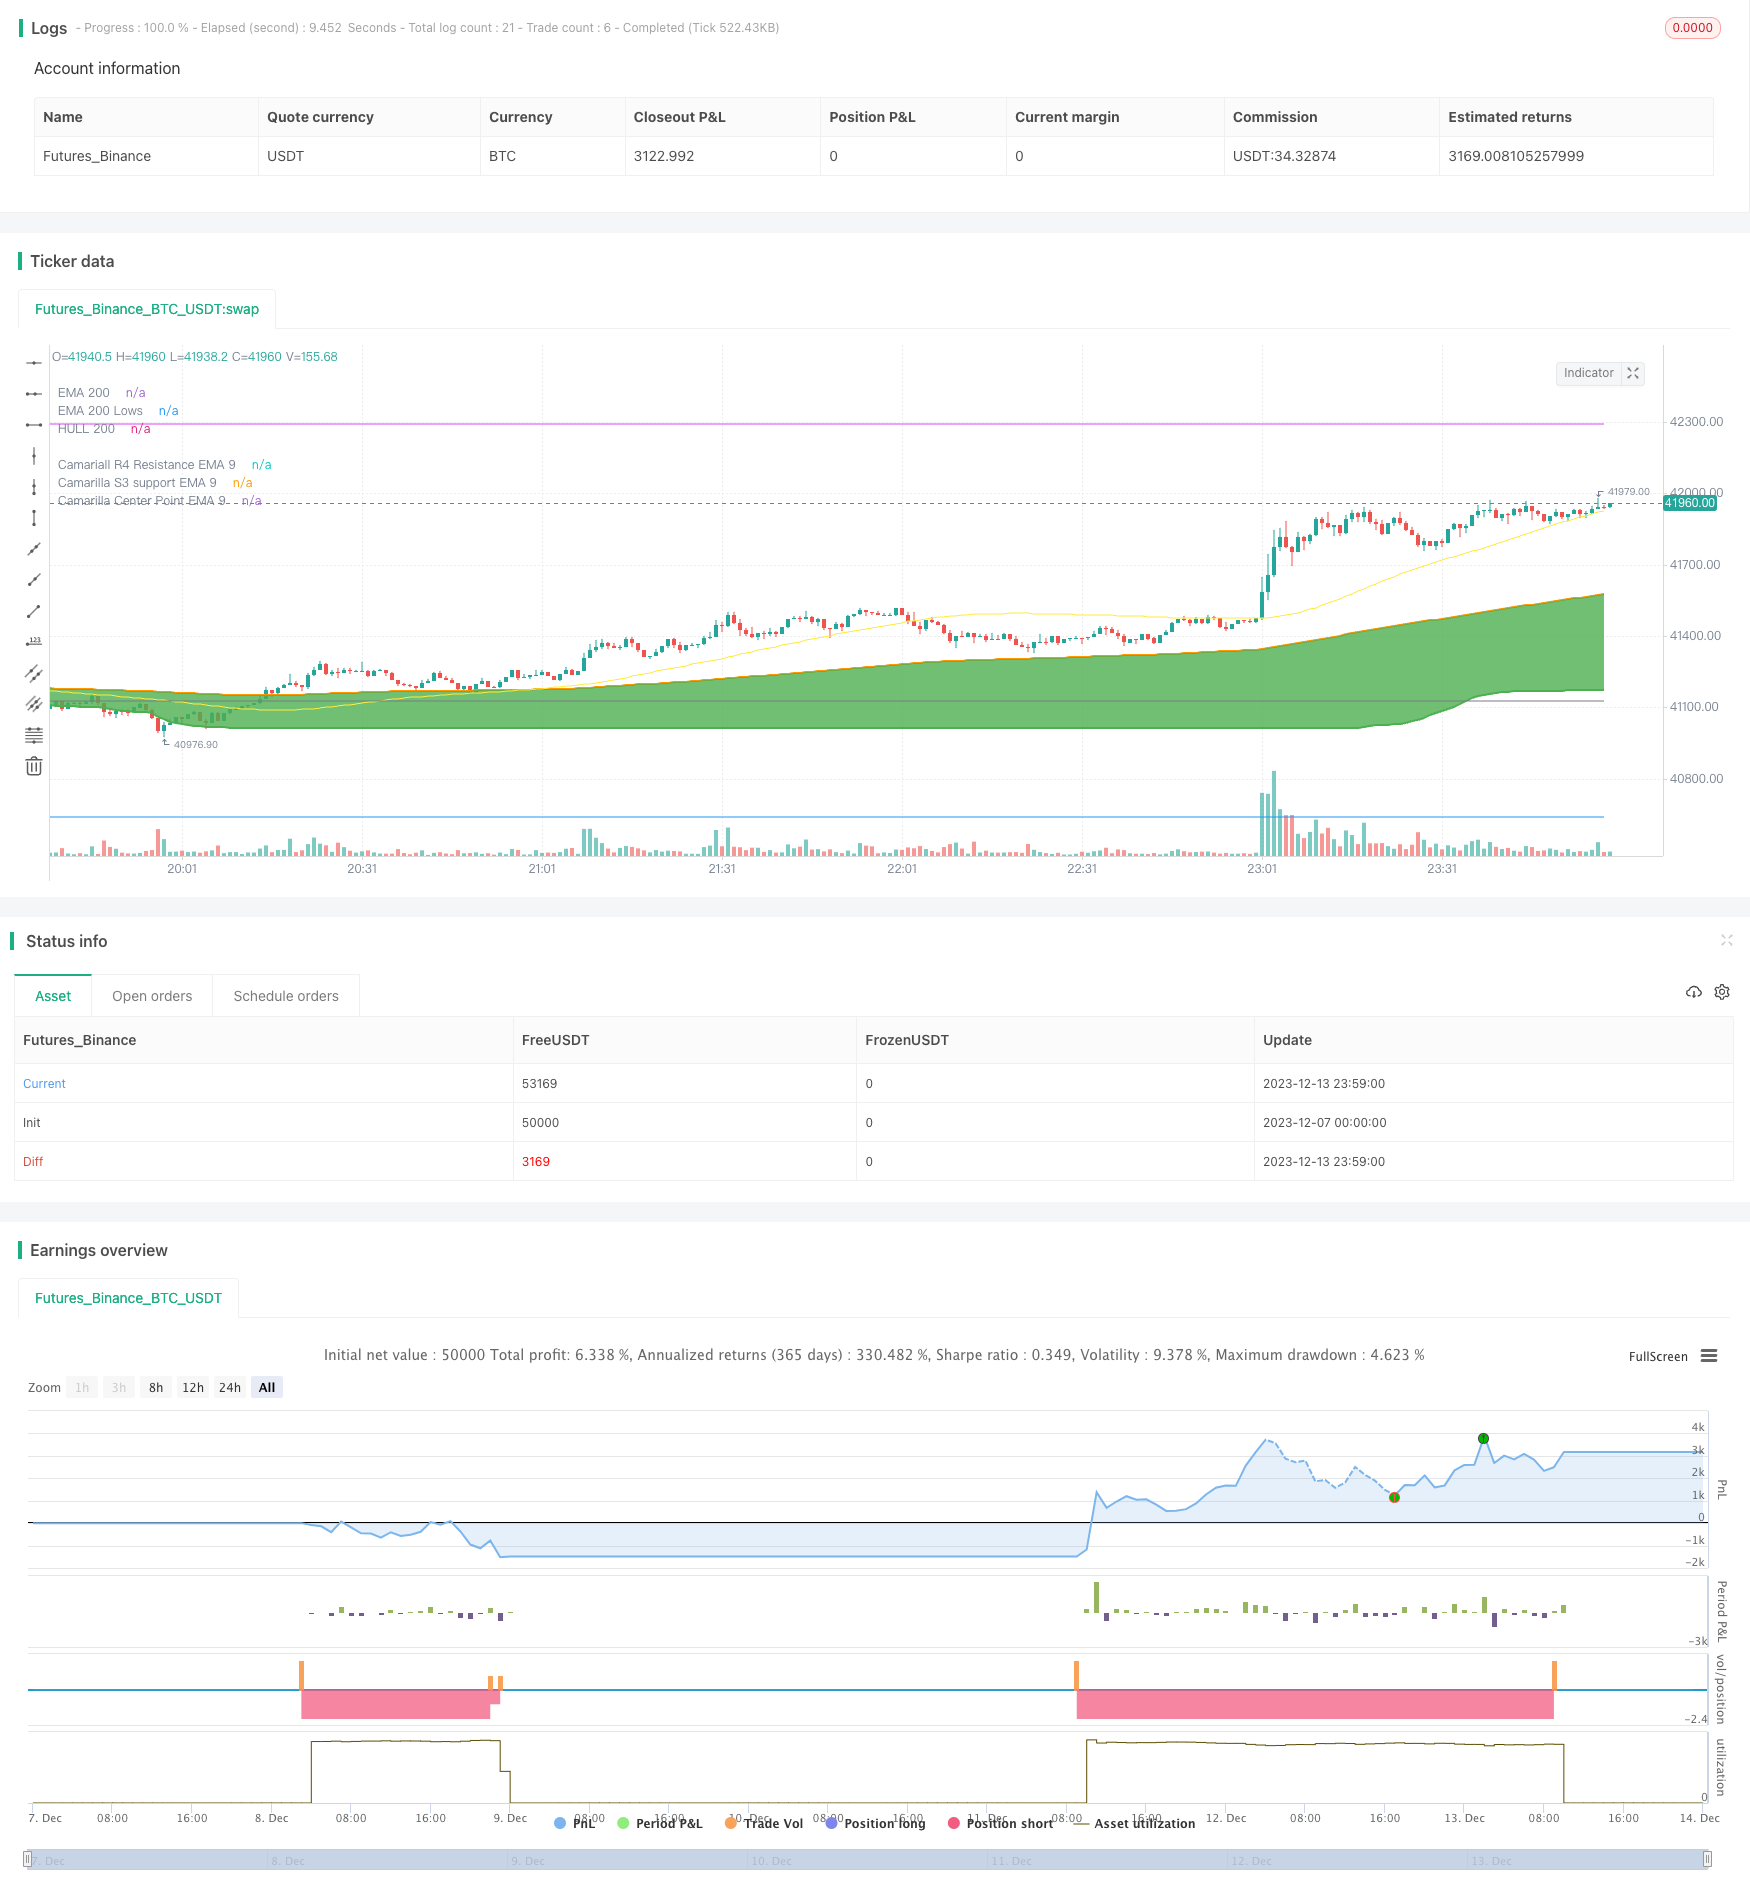
下方逆転戦略
作者: リン・ハーンチャオチャン開催日:2023年12月15日 11:07:41タグ:

概要
この戦略はリバース取引のための市場底部に基づいています. 200日間のEMAの最低点とCamarillaサポート/レジスタンスレベルを組み合わせて市場底部を決定します.価格が反転すると長引きます.
戦略の論理
- 最低値 EMA200を計算します. 200日間のEMAの最低値です.価格がこのEMAを下回ると,市場は底に近づいていると考えられます.
- Camarillaのサポートレベル3 (S3),ema_s3_9の9日間のEMAを重要なサポートレベルとして計算する.
- また,逆転の信号としてCamarillaの中間点 ema_center_9の9日間のEMAを計算します.
- Ema200Lowsより小さいので,長引きます. Ema200Lowsは, ema200Lowsよりも小さいので,
- 最低価格を追跡して 利益をロックします
- 利益目標はema_h4_9 (カマリラ抵抗レベル4) とema_s3_9です.
利点分析
- 200日間のEMA最低値では,実際の底を下回る前にポジションを取ることは避けます.
- 中点と組み合わせたカマリラレベルは 逆転を信頼的に識別します
- ATRストップロスはより合理的です 低価格を追跡することで より大きな利益を得ることができます
リスク分析
- 長期保持期間がリスクを増やす.この戦略は短期取引を好む.
- 大規模な市場動向は 大規模なストップ損失を 引き起こす可能性があります
- カマリラの反転信号は必ずしも正確ではない
オプティマイゼーションの方向性
- 逆転信号を補完するために RSI のような指標を追加することを検討します
- 異なる製品に対して最適なパラメータを研究します
- 機械学習を使って 動的ATRストップ損失を
概要
この戦略は,EMA低点とCamarillaレベルを使用して市場の底部と逆転を特定する.ATRのトレーリングストップで利益をロックする.全体的には,実用的な価値でかなり完全である.さらなる最適化は強度を改善する.
/*backtest
start: 2023-12-07 00:00:00
end: 2023-12-14 00:00:00
period: 1m
basePeriod: 1m
exchanges: [{"eid":"Futures_Binance","currency":"BTC_USDT"}]
*/

// This source code is subject to the terms of the Mozilla Public License 2.0 at https://mozilla.org/MPL/2.0/
// © mohanee

//Using the lowest of low of ema200, you can find the bottom
//wait for price to close below ema200Lows line
//when pivot

//@version=4
strategy(title="PickingupFromBottom Strategy", overlay=true )  //default_qty_value=10, default_qty_type=strategy.fixed,

//HMA
HMA(src1, length1) =>  wma(2 * wma(src1, length1/2) - wma(src1, length1), round(sqrt(length1)))


//variables BEGIN
length1=input(200,title="EMA 1 Length")
length2=input(50,title="EMA 2 Length")
length3=input(20,title="EMA 3 Length")

sourceForHighs= input(hlc3, title="Source for Highs", type=input.source)
sourceForLows = input(hlc3, title="Source for Lows" , type=input.source)

hiLoLength=input(7, title="HiLo Band Length")

atrLength=input(14, title="ATR Length")
atrMultiplier=input(3.5, title="ATR Multiplier")

//takePartialProfits = input(true, title="Take Partial Profits (if this selected, RSI 13 higher reading over 80 is considered for partial closing ) ")


ema200=ema(close,length1)
hma200=HMA(close,length1)


////Camarilla pivot points
//study(title="Camarilla Pivots", shorttitle="Camarilla", overlay=true)
t = input(title = "Pivot Resolution", defval="D", options=["D","W","M"])

//Get previous day/week bar and avoiding realtime calculation by taking the previous to current bar
sopen = security(syminfo.tickerid, t, open[1], barmerge.gaps_off, barmerge.lookahead_on)
shigh = security(syminfo.tickerid, t, high[1], barmerge.gaps_off, barmerge.lookahead_on)
slow = security(syminfo.tickerid, t, low[1], barmerge.gaps_off, barmerge.lookahead_on)
sclose = security(syminfo.tickerid, t, close[1], barmerge.gaps_off, barmerge.lookahead_on)
r = shigh-slow

//Calculate pivots
//center=(sclose)
//center=(close[1] + high[1] + low[1])/3
center=sclose - r*(0.618)

h1=sclose + r*(1.1/12)
h2=sclose + r*(1.1/6)
h3=sclose + r*(1.1/4)
h4=sclose + r*(1.1/2)
h5=(shigh/slow)*sclose
l1=sclose - r*(1.1/12)
l2=sclose - r*(1.1/6)
l3=sclose - r*(1.1/4)
l4=sclose - r*(1.1/2)
l5=sclose - (h5-sclose)

//Colors (<ternary conditional operator> expression prevents continuous lines on history)
c5=sopen != sopen[1] ? na : color.red
c4=sopen != sopen[1] ? na : color.purple
c3=sopen != sopen[1] ? na : color.fuchsia
c2=sopen != sopen[1] ? na : color.blue
c1=sopen != sopen[1] ? na : color.gray
cc=sopen != sopen[1] ? na : color.blue

//Plotting
//plot(center, title="Central",color=color.blue, linewidth=2)
//plot(h5, title="H5",color=c5, linewidth=1)
//plot(h4, title="H4",color=c4, linewidth=2)
//plot(h3, title="H3",color=c3, linewidth=1)
//plot(h2, title="H2",color=c2, linewidth=1)
//plot(h1, title="H1",color=c1, linewidth=1)
//plot(l1, title="L1",color=c1, linewidth=1)
//plot(l2, title="L2",color=c2, linewidth=1)
//plot(l3, title="L3",color=c3, linewidth=1)
//plot(l4, title="L4",color=c4, linewidth=2)
//plot(l5, title="L5",color=c5, linewidth=1)////Camarilla pivot points

ema_s3_9=ema(l3, 9)
ema_s3_50=ema(l3, 50)
ema_h4_9=ema(h4, 9)

ema_center_9=ema(center, 9)


plot(ema_h4_9, title="Camariall R4 Resistance EMA 9", color=color.fuchsia)
plot(ema_s3_9, title="Camarilla S3 support EMA 9", color=color.gray, linewidth=1)

//plot(ema_s3_50, title="Camarilla S3 support EMA 50", color=color.green, linewidth=2)

plot(ema_center_9, title="Camarilla Center Point EMA 9", color=color.blue)


plot(hma200, title="HULL 200", color=color.yellow,  transp=25)
plotEma200=plot(ema200, title="EMA 200",  style=plot.style_linebr, linewidth=2 , color=color.orange)

ema200High = ema(highest(sourceForHighs,length1), hiLoLength)
ema200Low= ema(lowest(sourceForLows,length1), hiLoLength)

ema50High = ema(highest(sourceForHighs,length2), hiLoLength)
ema50Low= ema(lowest(sourceForLows,length2), hiLoLength)

ema20High = ema(highest(sourceForHighs,length3), hiLoLength)
ema20Low= ema(lowest(sourceForLows,length3), hiLoLength)

//plot(ema200High, title="EMA 200 Highs", linewidth=2, color=color.orange, transp=30)
plotEma200Low=plot(ema200Low, title="EMA 200 Lows", linewidth=2, color=color.green, transp=30, style=plot.style_linebr)

//plot(ema50High, title="EMA 50 Highs", linewidth=2, color=color.blue, transp=30)
//plotEma50Low=plot(ema50Low, title="EMA 50 Lows", linewidth=2, color=color.blue, transp=30)


fill(plotEma200, plotEma200Low, color=color.green )


// Drawings /////////////////////////////////////////


//Highlight when centerpont crossing up ema200Low a
ema200LowBuyColor=color.new(color.green, transp=50)
bgcolor(crossover(ema_center_9,ema200Low) and (close[1]<ema200Low or close[2]<ema200Low or close[3]<ema200Low)? ema200LowBuyColor : na)
//ema200LowBuyCondition= (close[1]<ema200Low or close[2]<ema200Low or close[3]<ema200Low)
strategy.entry(id="ema200Low Buy", comment="LE2", qty=2, long=true,  when= crossover(ema_center_9,ema200Low) and (close[1]<ema200Low or close[2]<ema200Low or close[3]<ema200Low) )  //or (close>open and low<ema20Low and close>ema20Low) ) )     //  // aroonOsc<0


//Trailing StopLoss
////// Calculate trailing SL
/////////////////////////////////////////////////////
sl_val = atrMultiplier * atr(atrLength)


trailing_sl = 0.0
//trailing_sl :=   max(low[1]  - sl_val, nz(trailing_sl[1]))
trailing_sl :=   strategy.position_size>=1 ?  max(low  - sl_val, nz(trailing_sl[1])) :  na

//draw initil stop loss
//plot(strategy.position_size>=1 ? trailing_sl : na, color = color.blue , style=plot.style_linebr,  linewidth = 2, title = "stop loss")
plot(trailing_sl, title="ATR Trailing Stop Loss", style=plot.style_linebr, linewidth=1, color=color.red, transp=30)
//Trailing StopLoss
////// Calculate trailing SL
/////////////////////////////////////////////////////


strategy.close(id="ema200Low Buy", comment="TP1="+tostring(close - strategy.position_avg_price, "####.##"), qty=1, when=abs(strategy.position_size)>=1 and crossunder(close, ema_h4_9)  )  //close<ema55 and rsi5Val<20 //ema34<ema55  //close<ema89
strategy.close(id="ema200Low Buy", comment="TP2="+tostring(close - strategy.position_avg_price, "####.##"),  qty=1, when=abs(strategy.position_size)>=1 and crossunder(close, ema_s3_9)  )  //close<ema55 and rsi5Val<20 //ema34<ema55  //close<ema89
もっと
- MACD ロング リバース 戦略
- 2つのタイムフレームトレンド追跡戦略
- 複数のタイムフレームで確認されたブレークアウト戦略
- 複数のキャンドルスタイクパターンの包括的な戦略
- 統合脱退戦略
- 4つのEMAクロスオーバー戦略
- 月間および四半期移動平均操作に基づく量子取引戦略
- アダプティブ・ムービング・メアディアの多要素組み合わせ戦略
- EMA ゴールデンクロス 短期取引戦略
- ハイケン・アシとスーパー・トレンドの組み合わせ戦略
- ダイナミック・モメント・オシレーター取引戦略
- WMX ウィリアムズ・フラクタル 逆転ピボット戦略
- ストカスティッククロスオーバー 長期・短期戦略
- 線形MACD トレーディングにおける線形回帰の魔法を解き放つView
- ピボット逆転キャンドルスタイク戦略
- バレリア 181 ロボット 戦略 改善 2.4
- 仮想通貨取引のためのストカスティックRSI戦略
- 2つの逆転傾向を追跡する戦略
- 量重量移動平均収束差異
- ストカスティックターンアワンドファクターとキーターンアワンド・シグナルに基づいた組み合わせの逆転戦略