統合脱退戦略
作者: リン・ハーンチャオチャン, 日付: 2023年12月15日 11:59:08タグ:

概要
この戦略は,インド市場のための日取引イントラデイ統合ブレイクアウト指標である.時間条件,佣金,ストップ損失を追跡を組み込む.この戦略の利点は,明確な論理,柔軟なパラメータチューニング,市場動態に適応するなどである.しかし,特定のリスクが存在し,さらなる最適化が必要である.
戦略の論理
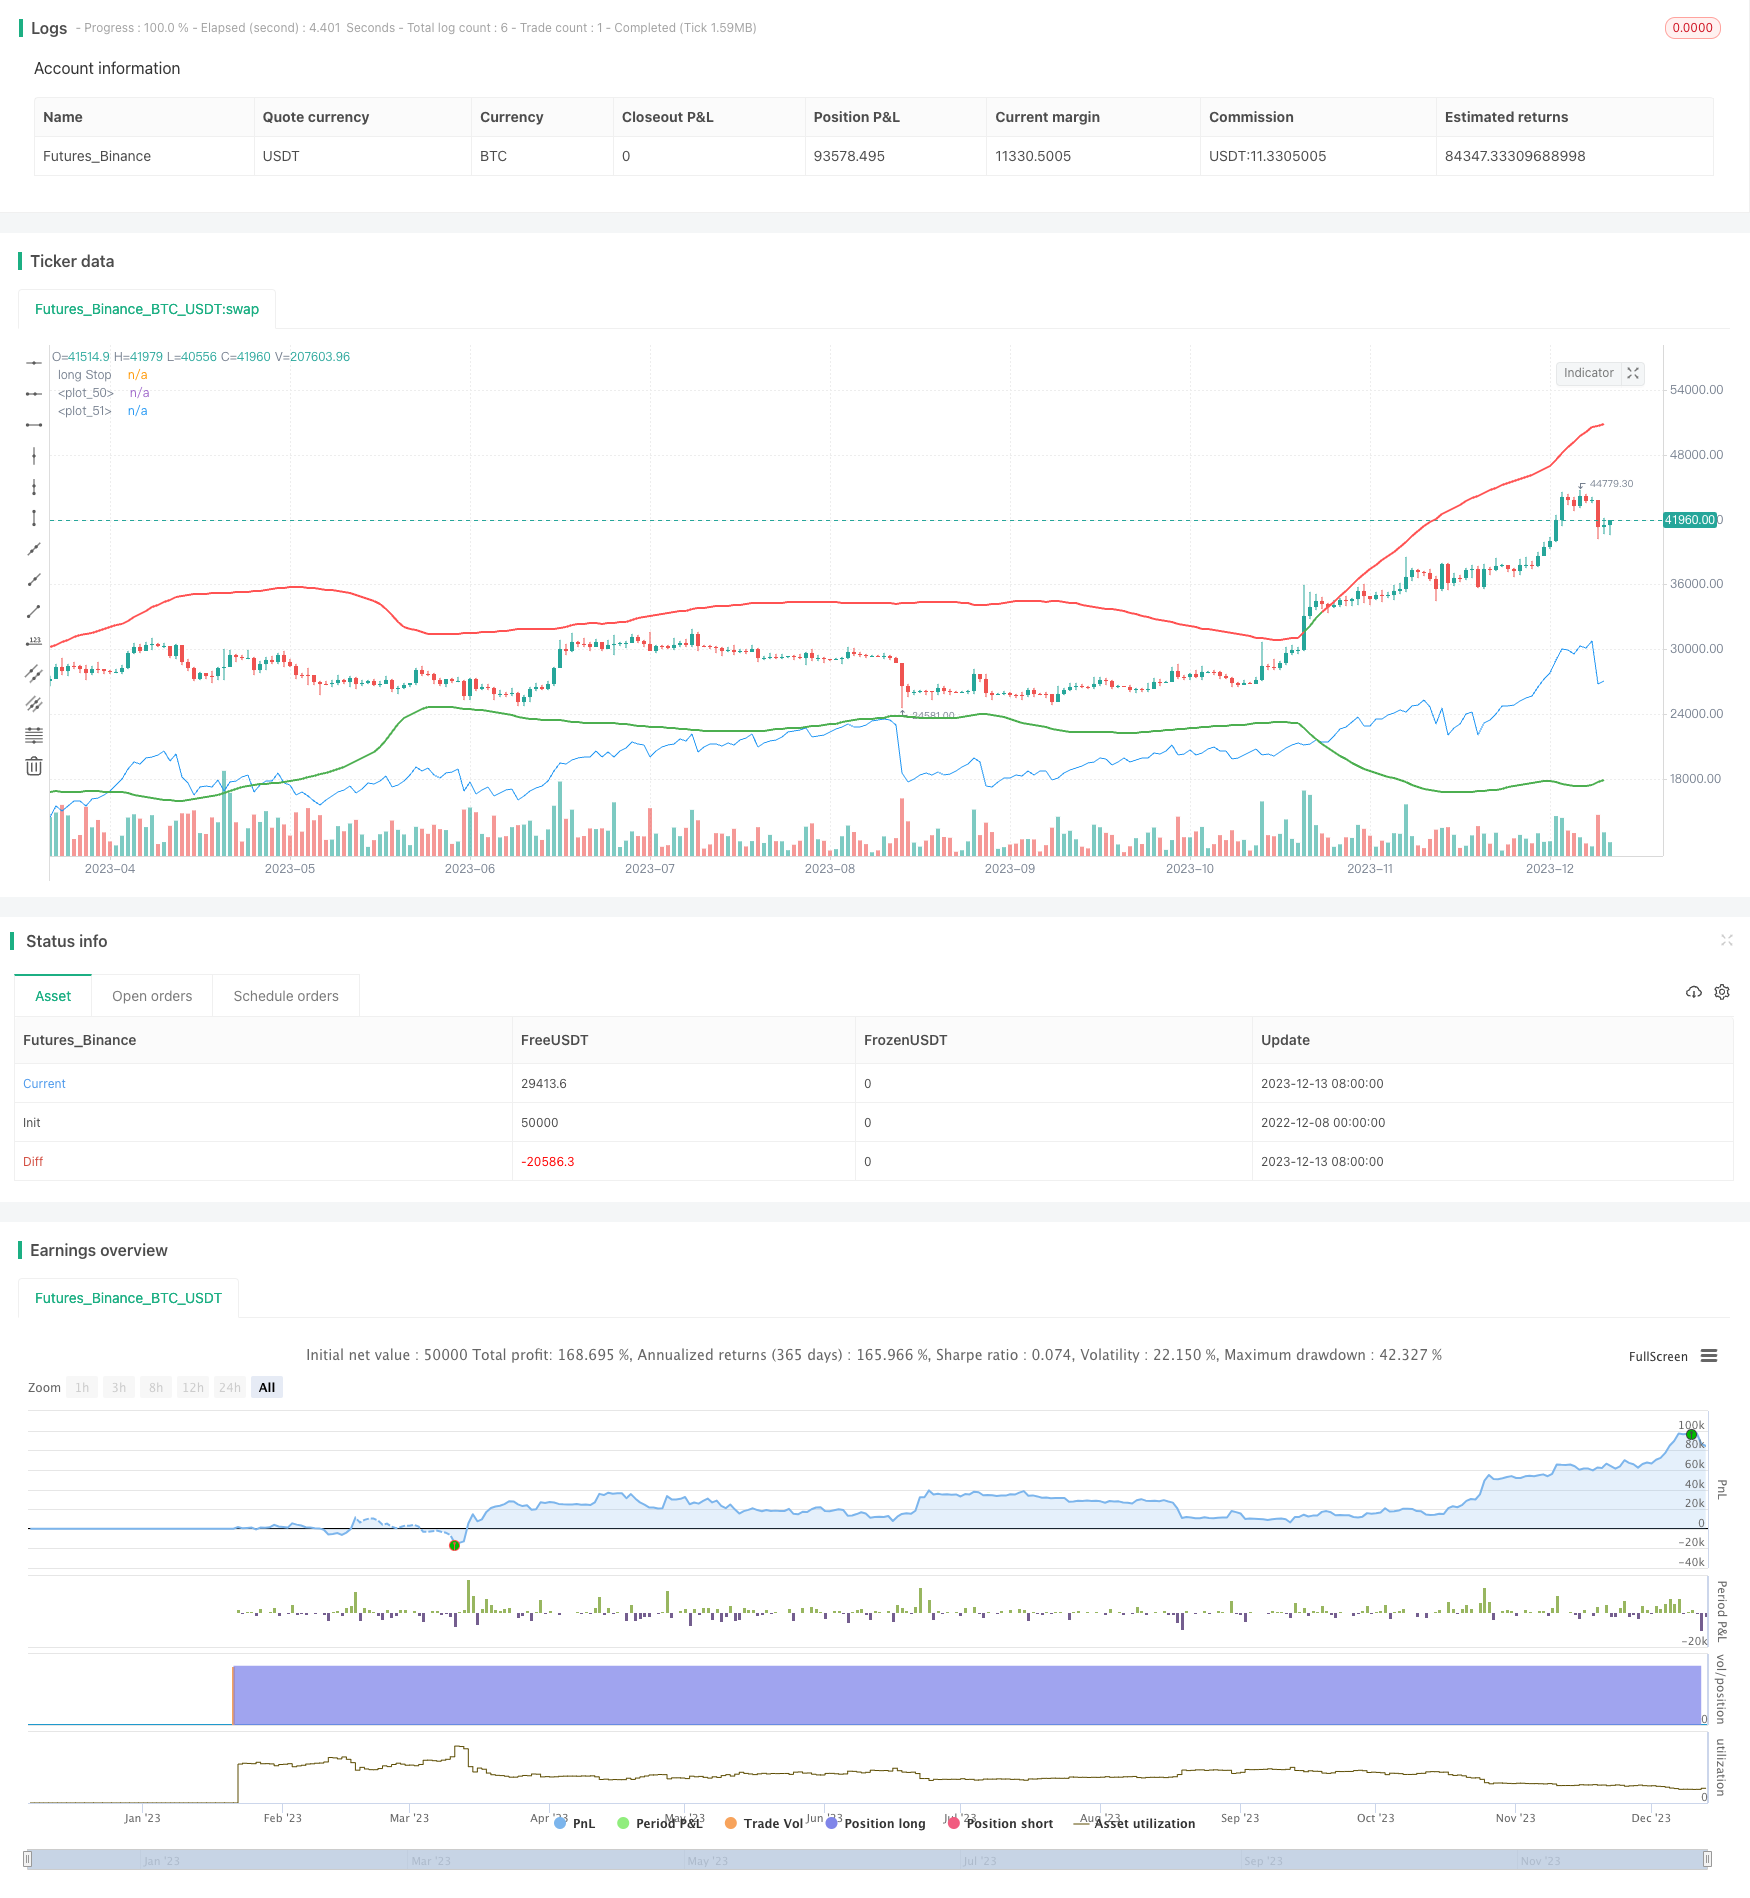
基本戦略はボリンジャーバンドに基づいている. 中間線と上/下帯は+MULT/-MULT標準偏差であるため,LENGTH期間の単純な移動平均を使用する.上帯の上の割れ目で購入信号が生成され,下帯の下の割れ目で販売信号が生成され,レンジブレイクアウト戦略を形成する.
リスク管理のために,ストップ・ロスのラインとしてATRを使用します.また,インド市場取引時間を考慮し,毎日14:57ですべてのポジションを閉じる.
利点分析
この戦略の利点は
- 明確な論理,簡単なパラメータ調整,柔軟な適応
- リスク管理のためにストップ・ロストとタイミング制御を組み込む
- インドの市場を現地化するための特性を考慮してください
- 合理的な取引頻度,過剰な取引を避ける
- さらに最適化するために良い拡張性
リスク分析
この戦略のリスクは
- ボリンジャー・バンドは,経験に基づくパラメータ調整に依存する.
- 誤った信号に敏感な単一指標
- ATRのストップ・ロスは限られたリスクしかコントロールできない
- ブラック・スワン事件は考慮されていない
リスクは以下によって軽減できます.
- シグナルフィルタリングのための複数の指標を組み合わせる
- パラメータ調整規則の最適化
- ギャップ・トレード・ロジック
- ストップ・ロスの安定性を向上させる
- 市場情勢指数を組み合わせる
オプティマイゼーションの方向性
戦略はいくつかの方向で最適化することができます.
- 適性向上のためにパラメータ調整を最適化
- 誤った信号を避けるためにより多くの指標を追加する
- ストップ・ロスの安定性を向上させる
- トレンド検出のための分析をさらに組み込む
- 自動位置サイズを考慮してください
モデルとアルゴリズムの最適化により,パラメータチューニングとシグナルフィルタリング機能はより広範な適応とより高いリスク耐性を向上させることができます.
結論
総括すると,これは直線的な日中ブレイクアウト戦略です.インド市場の特性を取り上げ,取引リスクを制御します.パラメータチューニングとシグナルフィルタリングのさらなる改善により,この戦略は商業化要件を満たすことができます.
/*backtest
start: 2022-12-08 00:00:00
end: 2023-12-14 00:00:00
period: 1d
basePeriod: 1h
exchanges: [{"eid":"Futures_Binance","currency":"BTC_USDT"}]
*/

//@version=5
strategy("Consolidation Breakout [Indian Market Timing]",overlay = true , pyramiding = 0 ,initial_capital = 50000, default_qty_value=5, currency = currency.NONE,commission_type = strategy.cash, commission_value = 30, slippage = 1 )


// ══════════════════════════════════//
// ————————> INPUT VALUES <————————— //
// ══════════════════════════════════//

LENGTH = input.int(title='LENGTH', defval = 75, minval = 10 ,maxval = 300)
MULT = input.float(title='MULT_STDEV',defval = 3.2 , minval = 1 , maxval = 7 , step =0.1)

//EMA1 = input.int(title='EMA1', defval = 50, minval = 10 ,maxval = 550)
//EMA2 = input.int(title='EMA2', defval = 135, minval = 10 ,maxval = 550)
factor_tr = input.float(title = "ATR TRAIL", defval = 10, step = 0.1)

// ══════════════════════════════════//
// ————————> DAY TIME LIMIT <——————— //
// ══════════════════════════════════//

t = time(timeframe.period, '0935-1430:1234567')
time_condition = not na(t)

//**********************// ════════════════════════════════//
//**********************// ————————> ATR & PLOT <————————— //
//**********************// ════════════════════════════════//
//ema1 = ta.ema(close,EMA1)
//ema2 = ta.ema(close,EMA2)

//plot(ema1, color=color.new(color.blue, 0), style=plot.style_linebr, title='ema1')
//plot(ema2, color=color.new(color.yellow, 0), style=plot.style_linebr, title='ema2')

atr_tr = ta.atr(16)*factor_tr

longStop = close - atr_tr
shortStop = close + atr_tr

Entry = close
length = LENGTH
mult = MULT
basis = ta.sma(Entry , length)
dev = mult * ta.stdev(Entry , length)
upper = (basis + dev)
lower = (basis - dev)
buyEntry = ta.crossover(Entry , upper)
sellEntry = ta.crossunder(Entry , lower)

//plot(upper, color=color.new(color.red, 0), style=plot.style_linebr, title="short stop")
//plot(lower, color=color.new(color.green, 0), style=plot.style_linebr, title="Long stop")

plot(upper, color=close[1] > upper and close > upper ? color.green : color.red, linewidth=2)
plot(lower, color=close[1] > lower and close > lower ? color.green : color.red, linewidth=2)


// ══════════════════════════════════//
// ————————> LONG POSITIONS <————————//
// ══════════════════════════════════//
//******barinstate.isconfirmed used to avoid repaint in real time*******

if ( buyEntry and strategy.opentrades==0 and barstate.isconfirmed and time_condition)
    strategy.entry(id= "Long" ,direction = strategy.long, comment = "B")

plot(longStop , color=color.new(color.blue, 0), style=plot.style_linebr, title='long Stop')

if strategy.position_size > 0
    strategy.exit("long tsl", "Long" , stop = longStop , comment='S')

// ═════════════════════════════════════//
// ————————> SHORT POSITIONS <————————— //
// ═════════════════════════════════════//
if ( sellEntry and strategy.opentrades==0 and barstate.isconfirmed and time_condition)
    strategy.entry(id = "Short" ,direction = strategy.short,  comment = "S")

if strategy.position_size < 0
    strategy.exit("short tsl", "Short" , stop = shortStop ,comment='B')

// ════════════════════════════════════════════════//
// ————————> CLOSE ALL POSITIONS BY 3PM <————————— //
// ════════════════════════════════════════════════//
strategy.close_all(when = hour == 14 and minute == 57)
もっと
- 多指標条件フィルタリングに基づいた定量戦略に従う日中の傾向
- Bollinger Bands と RSI の ショート セール 戦略
- 相互に重複する価格差値に基づく逆取引戦略
- 日平均取引戦略からの価格偏差
- 双動平均 三倍指数指数 取引戦略
- モメント インディケーター 取引戦略
- MACD ロング リバース 戦略
- 2つのタイムフレームトレンド追跡戦略
- 複数のタイムフレームで確認されたブレークアウト戦略
- 複数のキャンドルスタイクパターンの包括的な戦略
- 4つのEMAクロスオーバー戦略
- 月間および四半期移動平均操作に基づく量子取引戦略
- アダプティブ・ムービング・メアディアの多要素組み合わせ戦略
- EMA ゴールデンクロス 短期取引戦略
- ハイケン・アシとスーパー・トレンドの組み合わせ戦略
- 下方逆転戦略
- ダイナミック・モメント・オシレーター取引戦略
- WMX ウィリアムズ・フラクタル 逆転ピボット戦略
- ストカスティッククロスオーバー 長期・短期戦略
- 線形MACD トレーディングにおける線形回帰の魔法を解き放つView