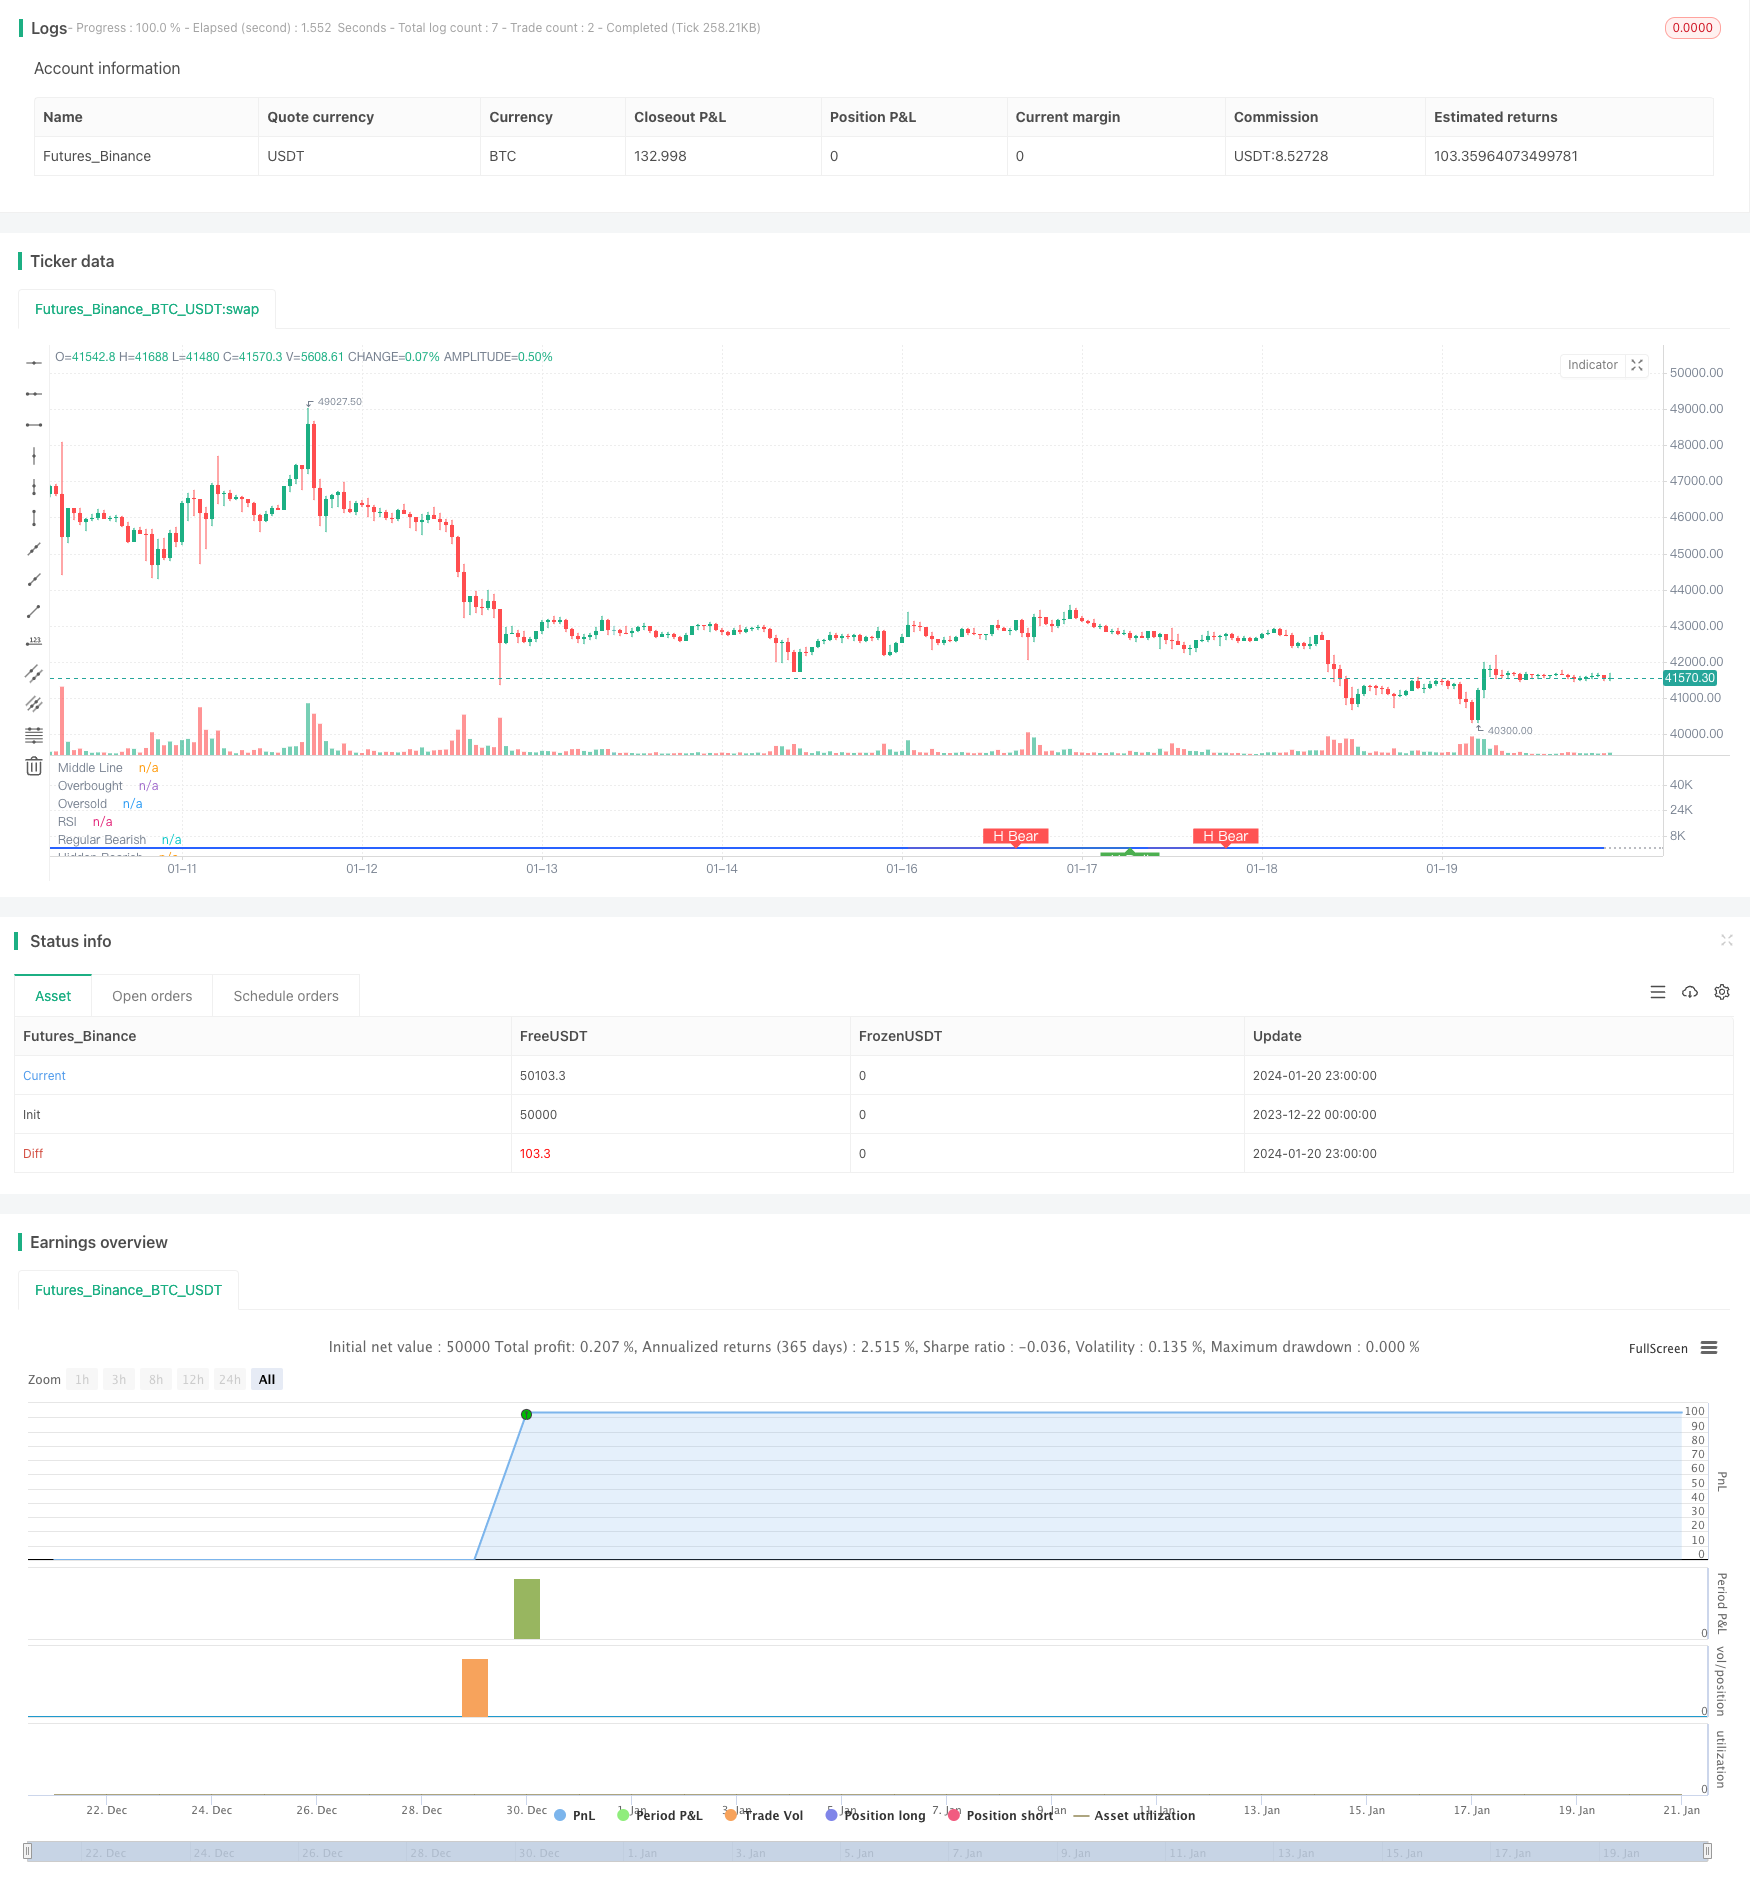
RSI ダイバージェンツ・トレーディング戦略
作者: リン・ハーンチャオチャン,日付: 2024-01-22 11:45:25タグ:

戦略名
RSI ブライッシュ/ベアッシュ・ディバージェンス・トレーディング戦略
概要
この戦略は,長期と短期のポジションを決定するために,定期的および隠された上昇/下落のRSIディバージェンス信号を特定します.
原則
価格が新高値に達し,RSIが新高値に達しなかった場合,上昇差異を形成し,販売信号として扱われる.価格が新低値に達し,RSIが新低値に達しなかった場合,上昇差異を形成し,購入信号として扱われる.定期的な差異は価格とRSIの間の明らかな差異を指す.隠された差異は,それらの間の比較的隠された差異を意味する.ロングまたはショートポジションは,識別されたまたは隠された定期的な上昇/下落差異信号に基づいて決定される.
利点分析
- 差異信号は比較的高い信頼性があり 勝率も高い.
- 常時と隠れた上昇/下落の差異の識別は,広範なカバーを提供します.
- 調整可能なRSIパラメータにより,異なる市場環境に適応できます.
リスク分析
- 隠された差異信号は誤判の可能性が高くなります
- 誤った信号をフィルタリングするために 手動的なレビューが必要です
- 効果はRSIパラメータ設定に依存します
オプティマイゼーションの方向性
- 最適なパラメータの組み合わせを見つけるために RSI パラメータを最適化します
- 機械学習アルゴリズムを追加して 真の信号を自動的に識別します
- 信号の信頼性を確認するためのより多くの指標を組み込む.
概要
この戦略は,ロングまたはショートポジションを決定するために,定期的および隠された上昇/下落のダイバージェンスに基づいて,RSIダイバージェンス取引信号を特定し,比較的高い勝利率を提供します.RSIパラメータを最適化し,他の検証指標を追加することで,戦略の有効性をさらに改善することができます.
/*backtest
start: 2023-12-22 00:00:00
end: 2024-01-21 00:00:00
period: 1h
basePeriod: 15m
exchanges: [{"eid":"Futures_Binance","currency":"BTC_USDT"}]
*/

//@version=5
strategy(title="Divergence Indicator")
len = input.int(title="RSI Period", minval=1, defval=14)
src = input(title="RSI Source", defval=close)
lbR = input(title="Pivot Lookback Right", defval=5)
lbL = input(title="Pivot Lookback Left", defval=5)
rangeUpper = input(title="Max of Lookback Range", defval=60)
rangeLower = input(title="Min of Lookback Range", defval=5)
plotBull = input(title="Plot Bullish", defval=true)
plotHiddenBull = input(title="Plot Hidden Bullish", defval=true)
plotBear = input(title="Plot Bearish", defval=true)
plotHiddenBear = input(title="Plot Hidden Bearish", defval=true)
bearColor = color.red
bullColor = color.green
hiddenBullColor = color.new(color.green, 80)
hiddenBearColor = color.new(color.red, 80)
textColor = color.white
noneColor = color.new(color.white, 100)
osc = ta.rsi(src, len)

plot(osc, title="RSI", linewidth=2, color=#2962FF)
hline(50, title="Middle Line", color=#787B86, linestyle=hline.style_dotted)
obLevel = hline(70, title="Overbought", color=#787B86, linestyle=hline.style_dotted)
osLevel = hline(30, title="Oversold", color=#787B86, linestyle=hline.style_dotted)
fill(obLevel, osLevel, title="Background", color=color.rgb(33, 150, 243, 90))

plFound = na(ta.pivotlow(osc, lbL, lbR)) ? false : true
phFound = na(ta.pivothigh(osc, lbL, lbR)) ? false : true
_inRange(cond) =>
	bars = ta.barssince(cond == true)
	rangeLower <= bars and bars <= rangeUpper

//------------------------------------------------------------------------------
// Regular Bullish
// Osc: Higher Low

oscHL = osc[lbR] > ta.valuewhen(plFound, osc[lbR], 1) and _inRange(plFound[1])

// Price: Lower Low

priceLL = low[lbR] < ta.valuewhen(plFound, low[lbR], 1)
// bull : 상승 Condition : 조건
bullCond = plotBull and priceLL and oscHL and plFound // 상승다이버전스?
strategy.entry("상승 다이버전스 진입", strategy.long, when = bullCond)
strategy.close("상승 다이버전스 진입", when = ta.crossover(osc, 50))
plot(
     plFound ? osc[lbR] : na,
     offset=-lbR,
     title="Regular Bullish",
     linewidth=2,
     color=(bullCond ? bullColor : noneColor)
     )

plotshape(
	 bullCond ? osc[lbR] : na,
	 offset=-lbR,
	 title="Regular Bullish Label",
	 text=" Bull ",
	 style=shape.labelup,
	 location=location.absolute,
	 color=bullColor,
	 textcolor=textColor
	 )

//------------------------------------------------------------------------------
// Hidden Bullish
// Osc: Lower Low

oscLL = osc[lbR] < ta.valuewhen(plFound, osc[lbR], 1) and _inRange(plFound[1])

// Price: Higher Low

priceHL = low[lbR] > ta.valuewhen(plFound, low[lbR], 1)
hiddenBullCond = plotHiddenBull and priceHL and oscLL and plFound
// strategy.entry("히든 상승 다이버전스 진입", strategy.long, when = hiddenBullCond)
// strategy.close("히든 상승 다이버전스 진입", when = ta.crossover(osc, 50))
plot(
	 plFound ? osc[lbR] : na,
	 offset=-lbR,
	 title="Hidden Bullish",
	 linewidth=2,
	 color=(hiddenBullCond ? hiddenBullColor : noneColor)
	 )

plotshape(
	 hiddenBullCond ? osc[lbR] : na,
	 offset=-lbR,
	 title="Hidden Bullish Label",
	 text=" H Bull ",
	 style=shape.labelup,
	 location=location.absolute,
	 color=bullColor,
	 textcolor=textColor
	 )

//------------------------------------------------------------------------------
// Regular Bearish
// Osc: Lower High

oscLH = osc[lbR] < ta.valuewhen(phFound, osc[lbR], 1) and _inRange(phFound[1])

// Price: Higher High

priceHH = high[lbR] > ta.valuewhen(phFound, high[lbR], 1)
// bear : 하락
bearCond = plotBear and priceHH and oscLH and phFound
// strategy.entry("하락 다이버전스 진입", strategy.short, when = bearCond)
// strategy.close("하락 다이버전스 진입", when = ta.crossunder(osc, 50))
plot(
	 phFound ? osc[lbR] : na,
	 offset=-lbR,
	 title="Regular Bearish",
	 linewidth=2,
	 color=(bearCond ? bearColor : noneColor)
	 )

plotshape(
	 bearCond ? osc[lbR] : na,
	 offset=-lbR,
	 title="Regular Bearish Label",
	 text=" Bear ",
	 style=shape.labeldown,
	 location=location.absolute,
	 color=bearColor,
	 textcolor=textColor
	 )

//------------------------------------------------------------------------------
// Hidden Bearish
// Osc: Higher High

oscHH = osc[lbR] > ta.valuewhen(phFound, osc[lbR], 1) and _inRange(phFound[1])

// Price: Lower High

priceLH = high[lbR] < ta.valuewhen(phFound, high[lbR], 1)

hiddenBearCond = plotHiddenBear and priceLH and oscHH and phFound
// strategy.entry("히든 하락 다이버전스 진입", strategy.short, when = hiddenBearCond)
// strategy.close("히든 하락 다이버전스 진입", when = ta.crossunder(osc, 50))
plot(
	 phFound ? osc[lbR] : na,
	 offset=-lbR,
	 title="Hidden Bearish",
	 linewidth=2,
	 color=(hiddenBearCond ? hiddenBearColor : noneColor)
	 )

plotshape(
	 hiddenBearCond ? osc[lbR] : na,
	 offset=-lbR,
	 title="Hidden Bearish Label",
	 text=" H Bear ",
	 style=shape.labeldown,
	 location=location.absolute,
	 color=bearColor,
	 textcolor=textColor
	 )
もっと
- ダイナミックなCCI支援と抵抗戦略
- QQEのモメンタム・トレード戦略
- ガウス波予測戦略
- ダイナミック・ムービング・EMAのコンビネーション・量子戦略
- ドンチアン運河の傾向 戦略をフォローする
- EMAのリボン戦略
- 正確なトレンド逆転移動平均クロスオーバー戦略
- マルチEMAの上昇傾向戦略
- S&P500 ハイブリッド 季節性取引戦略
- 偏差に基づくトレンド追跡戦略
- 多指標決定樹戦略:IMACD,EMA,イチモク
- MACD ダブルオプティマイゼーション トレーディング戦略
- EMAの双重ゴールドクロス戦略
- 多期RSIと移動平均取引戦略
- 週間のスウィング取引戦略
- EVWMA をベースとしたMACD取引戦略
- ボリンジャー・バンド チャネル・ブレイク・アウト・ミニアン・リバース・戦略
- 複数の技術指標に基づく定量的な傾向追跡戦略
- RSIとCCIの組み合わせ 量的な取引戦略
- 低リスクDCAトレンド取引戦略