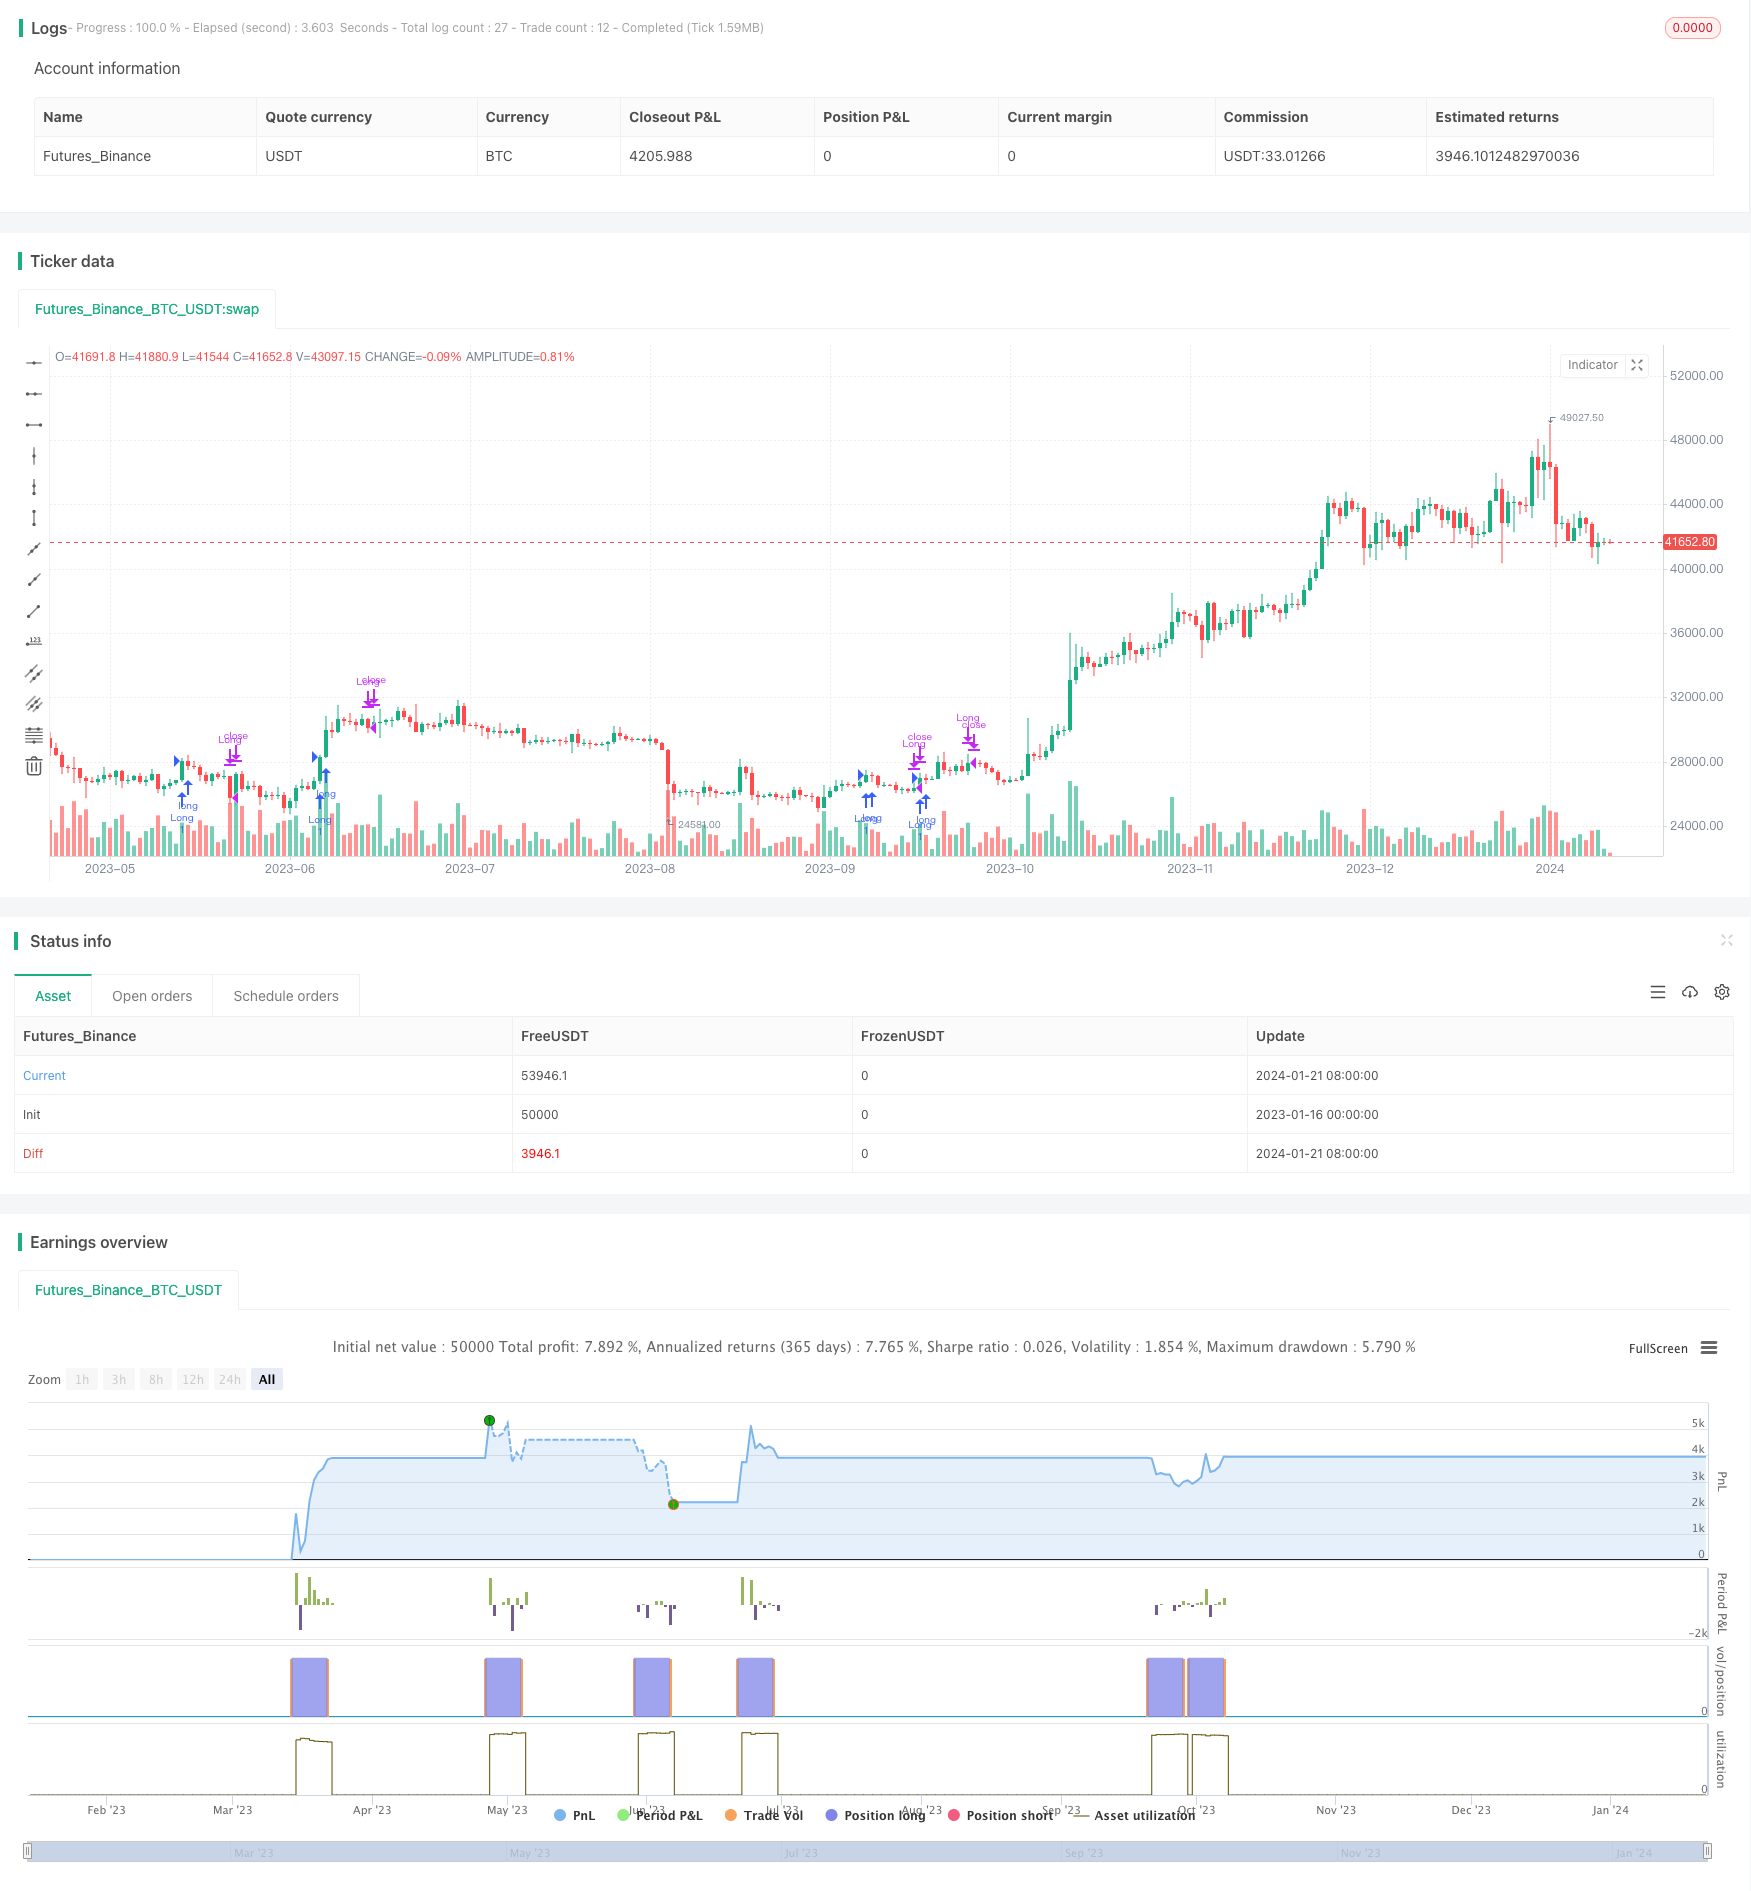
移動平均のクロスオーバー戦略
作者: リン・ハーンチャオチャン,日付: 2024-01-23 15:20:16タグ:

概要
これは移動平均クロスオーバー信号に基づいた取引戦略です. 45日間の移動平均線を主要な技術指標として使用し,価格が移動平均線を突破すると購入・売却信号を生成します.
戦略の論理
価格が45日間の移動平均線を超えて上昇し破ると,購入信号が生成されます. 8日間ポジションを保持した後,販売信号が生成されます. その後,価格が再び上昇し45日間の移動平均線を超えて破ると,新しい購入信号がトリガーされます.
具体的な論理原理は以下のとおりです.
- 45日間の移動平均線を計算します.
- 閉じる価格が移動平均線の下から上へと突破すると,買い信号が生成され,ロングになります.
- 市場への入場後 8 取引日間 ポジションを保持する.
- 8日後にロングポジションを閉じて売り信号を生成します.
- 後に閉じる価格が移動平均線の下から上へと再び突破した場合,買い信号を再生してロングポジションを再開します.
上記はこの戦略の核心的な取引論理です
利点
この戦略には以下の利点があります.
- 取引規則は単純で明快で 分かりやすく 実行できます
- 移動平均値のトレンド追跡機能を利用して 中長期トレンドを効果的に把握します.
- 8日間の保有期間は,傾向を追跡するのに十分な長さで,損失を時間内に削減するのに十分な短さです.
- 市場復帰のルールは明確で 取引頻度を制限するのに役立ちます
リスク
この戦略にはいくつかのリスクがあります:
- 移動平均値の遅れは,遅刻して入場し,早めに退場する可能性があります.
- 固定保持期間と MA パラメータは,変化する市場状況に適応できない可能性があります.
- 取引頻度が高くなり コストが上がり スリップが増加する可能性があります
- 突破信号は 誤った信号を生成し 鞭打ちが起こる可能性があります
解決策:
- MAパラメータを最適化して遅延を減らす
- 保持期間を延長するか,トレンドをより正確に追跡するために,トラッキングストップを使用します.
- MACDやKDJなどの他の指標を用いたフィルターを追加して信号を確認します.
- 周波数制御のルールを磨いて
強化 分野
主な強化分野は以下の通りです.
-
最適な組み合わせを見つけるために MA パラメータを最適化します.例えば,15日,30日,60日MAs.
-
保持期間を最適化して最適な期間を決定します.例えば,5日,10日,15日.
-
トレールストップを追加して傾向を追跡し,リスクを制御する.例えば,試行ストップやATRストップ.
-
MACD,KDJなどの他の指標を使用したフィルターを追加して 誤った信号を減らす.
-
過剰な取引を防ぐため 再入国規則を改良し,例えば冷却期間を施行する.
-
異なる市場や手段におけるテストの有効性 パラメータを異なる市場に合わせて調整する必要があります.
概要
概要すると,このMAクロスオーバー戦略は,シンプルで実践的なトレンドフォローリングシステムです.MAsのトレンド追跡能力を活用し,価格ブレイクを組み合わせて取引信号を生成します.メリットとしては,実行が簡単であり,デメリットとしては,偶発的なウィップソーです.戦略はパラメータ最適化やフィルターとして他の指標を追加することによってさらに強化できます.
/*backtest
start: 2023-01-16 00:00:00
end: 2024-01-22 00:00:00
period: 1d
basePeriod: 1h
exchanges: [{"eid":"Futures_Binance","currency":"BTC_USDT"}]
*/

//@version=5
strategy("Moving Average Crossover Strategy", overlay=true)

// Calculate the 45-day moving average
ma_length = 45
ma = ta.sma(close, ma_length)

// Track position entry and entry bar
var bool in_long_position = na
var int entry_bar = na
var int exit_bar = na

// Entry condition: Close price crosses above the 45-day moving average to enter the position
if (not in_long_position and ta.crossover(close, ma) and not na(ma[1]) and close > ma and close[1] < ma[1])
    in_long_position := true
    entry_bar := bar_index

// Exit condition: Close the position after holding for 8 trading days
if (in_long_position and bar_index - entry_bar >= 8)
    in_long_position := false
    exit_bar := bar_index

// Re-entry condition: Wait for price to cross over the 45-day moving average again
if (not in_long_position and ta.crossover(close, ma) and not na(ma[1]) and close > ma and close[1] > ma[1] and (na(exit_bar) or bar_index - exit_bar >= 8))
    in_long_position := true
    entry_bar := bar_index

// Execute long entry and exit
if (in_long_position)
    strategy.entry("Long", strategy.long)

if (not in_long_position)
    strategy.close("Long")
もっと
- ボリンジャー・バンド・リミット・マーケットメーカーの戦略
- 長期移動平均のクロスオーバーのRENKO戦略
- オンラインの新取引監視
- 双方向のトレンドトラッキング レンコの取引戦略
- 移動平均と無限のインパルス応答線戦略を組み合わせた
- 超トレンド追跡戦略
- 複数の指標によるトレンド逆転取引戦略
- ビットコインとゴールドのダブルギャップ戦略
- MACD と RSI のクロスオーバー 戦略
- モメント・プルバック・戦略
- 振動のある利益格子戦略
- 移動平均値に基づく振動突破戦略
- ZigZag パターン認識 短期取引戦略
- ウィリアムズVIXとDEMAをベースにした時間枠間の変動とトレンド追跡戦略
- 動向平均値によるサイクル判断に基づくモメントブレイク戦略
- 時間と空間を横切る5分間の戦略
- 双 EMA クロス トレンド トレーディング 戦略
- ダイナミックMACD最適化取引戦略
- VWAPとRSIの組み合わせ戦略
- RSI トレーディング 戦略