モメント トレンド 戦略
作者: リン・ハーンチャオチャン開催日:2024年1月26日11時45分55秒タグ:

概要
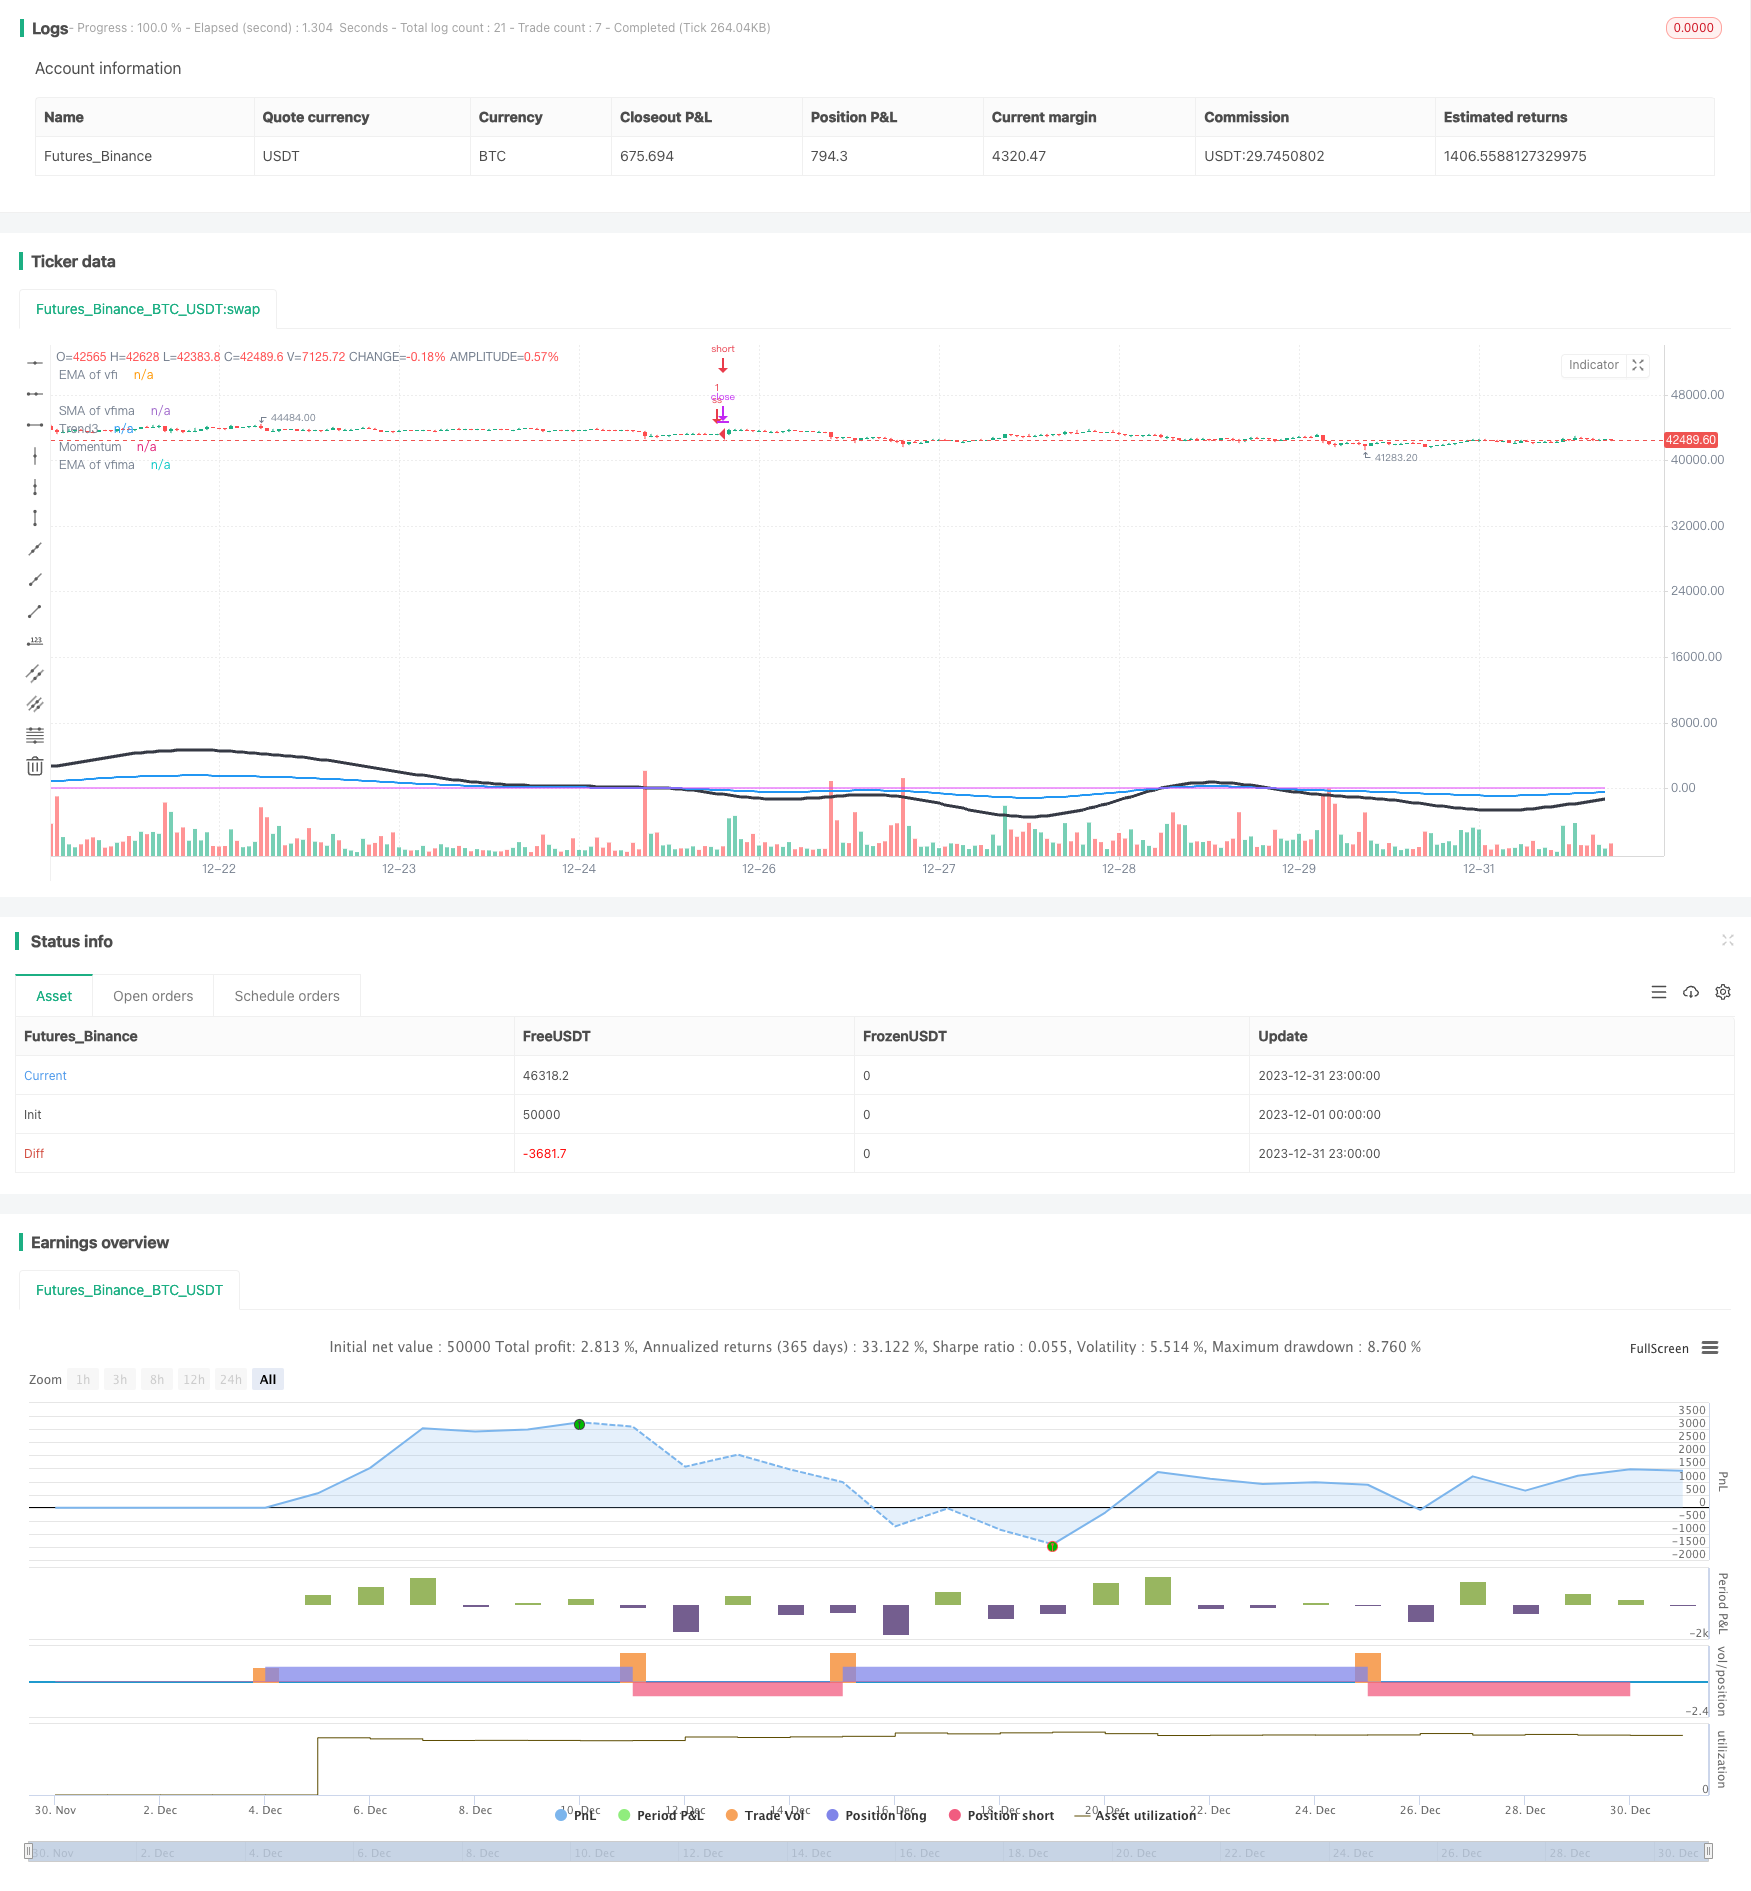
この戦略は,移動平均値,相対強度指数 (RSI),ボリューム変動指数 (VFI),真の強度指数 (TSI) などの様々な技術指標を組み合わせ,市場の全体的な勢いと傾向を決定し,中長期の価格動向を把握します.
戦略の論理
-
速線RSI (7日),正線RSI (14日),スローラインRSI (50日) の移動平均を計算して,RSIの傾向と勢いを決定します.
-
VFI EMA (25日) と VFI SMA (25日) の移動平均を計算し,資金の流入と流出を測定する.
-
市場傾向の強さを決定するために,TSIの長期移動平均と短期移動平均の比率を計算する.
-
RSI,VFIと TSIの結果を統合して,市場全体の動向方向を導き出す.
-
ダウンモメントが検出されるとショートポジションを取ります. モメントの逆転が検出されるとショートカバーします.
利点分析
-
複数の指標を組み合わせることで,市場全体の動力と傾向をより包括的かつ正確に測定できます.
-
VFIは市場資金の流れを反映し,トレンドに反する取引を避けます.
-
TSIは市場の不安定性をフィルタリングし,信号をより信頼できるものにします.
-
戦略は信頼性が高く 勝率も良好です
リスク分析
-
多指標設定から最適な結果を得るには複雑なパラメータ調整が必要です.
-
簡単な入出規則は,指標情報を完全に資本化できず,短期的な逆転損失に易しい.
-
波動する市場では 誤った信号や 小規模な引き下げ損失に 敏感です
オプティマイゼーションの方向性
-
最適なパラメータを見つけるために指標の組み合わせを最適化します
-
逆転を捉えるために指標条件に基づいた退出規則を強化する.
-
利益保護のメカニズムを構築し 混乱による損失を減らす
概要
この戦略は,市場全体の勢いを測定するために複数の指標を組み合わせ,下落勢が特定されたときにショートポジションを取ります.比較的高い信頼性がありますが,インディケーター情報を完全に活用できない簡単なエントリー/アウトリースルールがあります.パラメータとアウトリースロジックのさらなる強化は安定性と収益性を向上させることができます.
]
//@version=2
//credit to LazyBear, Lewm444, and others for direct and indirect inputs/////////////////////////////////
//script is very rough, publishing more for collaborative input value than as a finished product/////////
strategy("Momo", overlay=true)
length = input( 50 )
overSold = input( 50 )
overBought = input( 65 )
price = ohlc4

/////////////////////////////////////////////////////macd/////////////////////////////////////////////////

fastLength = input(12)
slowlength = input(26)
MACDLength = input(9)

fast = 12, slow = 26
fastMA = ema(close, fast)
slowMA = ema(close, slow)
MACD = (fastMA - slowMA)
Msignal = (sma(MACD, 9))*40
//plot(Msignal, color=blue, linewidth=3)

/////////////////////////////////////////////////rsi spread/////////////////////////////////////////////////

source = price

RSIFast  = rsi(source, input(7))
RSINorm  = rsi(source, input(14))
RSISlow = rsi(source, input(50))

//plot(RSIFast, color=silver, style=area, histbase=50)
//plot(RSINorm, color=#98b8be, style=area, histbase=50)
//plot(RSISlow, color=#be9e98, style=area, histbase=50)

//plot(RSIFast, color=gray, style=line, linewidth=1)
//plot(RSINorm, color=purple, style=line, linewidth=2)
//plot(RSISlow, color=black, style=line, linewidth=3)

exponential = input(true, title="Exponential MA")

src = (RSIFast)

ma05 = exponential ? ema(src, 05) : sma(src, 05)
ma30 = exponential ? ema(src, 30) : sma(src, 30)
ma50 = exponential ? ema(src, 50) : sma(src, 50)
ma70 = exponential ? ema(src, 70) : sma(src, 70)
ma90 = exponential ? ema(src, 90) : sma(src, 90)
ma100 = exponential ? ema(src, 100) : sma(src, 100)

exponential1 = input(true, title="Exponential MA")

src1 = (RSINorm)

ma051 = exponential1 ? ema(src1, 05) : sma(src1, 05)
ma301 = exponential1 ? ema(src1, 30) : sma(src1, 30)
ma501 = exponential1 ? ema(src1, 50) : sma(src1, 50)
ma701 = exponential1 ? ema(src1, 70) : sma(src1, 70)
ma901 = exponential1 ? ema(src1, 90) : sma(src1, 90)
ma1001 = exponential1 ? ema(src1, 100) : sma(src1, 100)


exponential2 = input(true, title="Exponential MA")

src2 = (RSINorm)

ma052 = exponential2 ? ema(src2, 05) : sma(src2, 05)
ma302 = exponential2 ? ema(src2, 30) : sma(src2, 30)
ma502 = exponential2 ? ema(src2, 50) : sma(src2, 50)
ma702 = exponential2 ? ema(src2, 70) : sma(src2, 70)
ma902 = exponential2 ? ema(src2, 90) : sma(src2, 90)
ma1002 = exponential2 ? ema(src2, 100) : sma(src2, 100)


////////////////////////////////////////////////vfi by LazyBear, modified////////////////////////////////////

VFIlength = input(130, title="VFI length")
coef = input(0.2)
vcoef = input(2.5, title="Max. vol. cutoff")
signalLength=input(10)
signalLength2 = input(100)
smoothVFI=input(false, type=bool)

ma(x,y) => smoothVFI ? sma(x,y) : x

typical=hlc3
inter = log( typical ) - log( typical[1] )
vinter = stdev(inter, 30 )
cutoff = coef * vinter * close
vave = sma( volume, VFIlength )[1]
vmax = vave * vcoef
vc = iff(volume < vmax, volume, vmax) //min( volume, vmax )
mf = typical - typical[1]
vcp = iff( mf > cutoff, vc, iff ( mf < -cutoff, -vc, 0 ) )

vfi = ma(sum( vcp , VFIlength )/vave, 3)
vfima = ema( vfi, 25 )
vfimaS = (sma(vfima, 25))
zima = ema( vfima, signalLength2 )
d=vfi-vfima
vfi_avg = avg(vfi, vfima, vfimaS)
vfi_avgS = (sma(vfi_avg,5))

plot( zima, title="EMA of vfima", color=fuchsia, linewidth=1)
plot( vfimaS, title="SMA of vfima", color=blue, linewidth=1)
plot( vfima , title="EMA of vfi", color=black, linewidth=1)
//plot( vfi, title="vfi", color=green,linewidth=1)
//plot( vfi_avg, title="vfi_avg", color=blue, linewidth=2)
//plot( vfi_avgS, title="vfi_avgS", color=maroon, linewidth=2)

/////////////////////////////////////////////////////tsi////////////////////////////////////////////////

long2 = input(title="Long Length",  defval=24)
short2 = input(title="Short Length",  defval=7)
signal2 = input(title="Signal Length",  defval=13)
pc = change(price)
double_smooth2(src, long2, short2) =>
    fist_smooth2 = ema(src, long2)
    ema(fist_smooth2, short2)
double_smoothed_pc2 = double_smooth2(pc, long2, short2)
double_smoothed_abs_pc2 = double_smooth2(abs(pc), long2, short2)
tsi_value2 = 60 * (double_smoothed_pc2 / double_smoothed_abs_pc2)
//plot( tsi_value2, title="tsi2", color=black, linewidth=1)

////////////////////////////////////////////////////////mjb////////////////////////////////////////////////

trendSignal = avg(tsi_value2, Msignal, vfi)*1.75
T1 = sma(trendSignal, 5)
T2 = ema(trendSignal, 25)
T3 = ema(T2, 25)
//plot( T1, title="Trend", color=red, linewidth=3)
plot( T3, title="Trend3", color=black, linewidth=3)

/////////////////////////////////////////////////////mjb////////////////////////////////////////////////

Momentum = avg (T3, vfimaS, vfima)
plot( Momentum, title="Momentum", color=blue, linewidth=2)
vrsi = rsi(price, length)
clearance = abs(zima - Msignal)

/////////////////////////////////////////////////////mjb////////////////////////////////////////////////

if (not na(vrsi))
    if (zima > T3) and (clearance > 5) and (falling(zima, 1) == 1) and (zima > vfimaS) and (zima > vfima) and (falling(T3, 1) == 1) and (zima > 6)
        strategy.entry("ss", strategy.short)
    if (T3 > zima) and (rising(zima, 1) == 1)
        strategy.entry("Zcover", strategy.long)
    if (strategy.openprofit > 750) and (rising(T2, 1) == 1) and (T2 > 10)
        strategy.entry("ProfitTake", strategy.long)
// strategy.risk.allow_entry_in(strategy.direction.short)
// strategy.risk.max_intraday_loss(2000, strategy.cash)
- ダイナミック・ボリンガー・ブレークアウト戦略
- 2年新高回転移動平均戦略
- 双向移動平均取引戦略
- 動的位置再バランス傾向追跡システム
- 日々のオープンリバース戦略
- ゴールデンクロス SMA トレーディング戦略
- ゴールデンクロス移動平均戦略
- MACD暗号取引戦略
- 線形回帰と二重移動平均の短期戦略
- ストカスティック・モメンタム戦略の三重重複
- モメント移動平均クロスオーバー量子戦略
- 2つの移動平均逆転とATRトライルストップの組み合わせ戦略
- マルティンゲールフューチャー取引戦略
- モメント・プルバック・戦略
- ダブルキャンドルスタイク予測 接近戦略
- ストカスティック・スーパートレンド・トラッキング・ストップ・ロスの取引戦略
- 戦略をフォローする二重逆転振動帯の傾向