平滑化されたRSIに基づく株式取引戦略
作成日:
2024-01-29 16:26:12
最終変更日:
2024-01-29 16:26:12
コピー:
0
クリック数:
666
1
フォロー
1628
フォロワー

概要
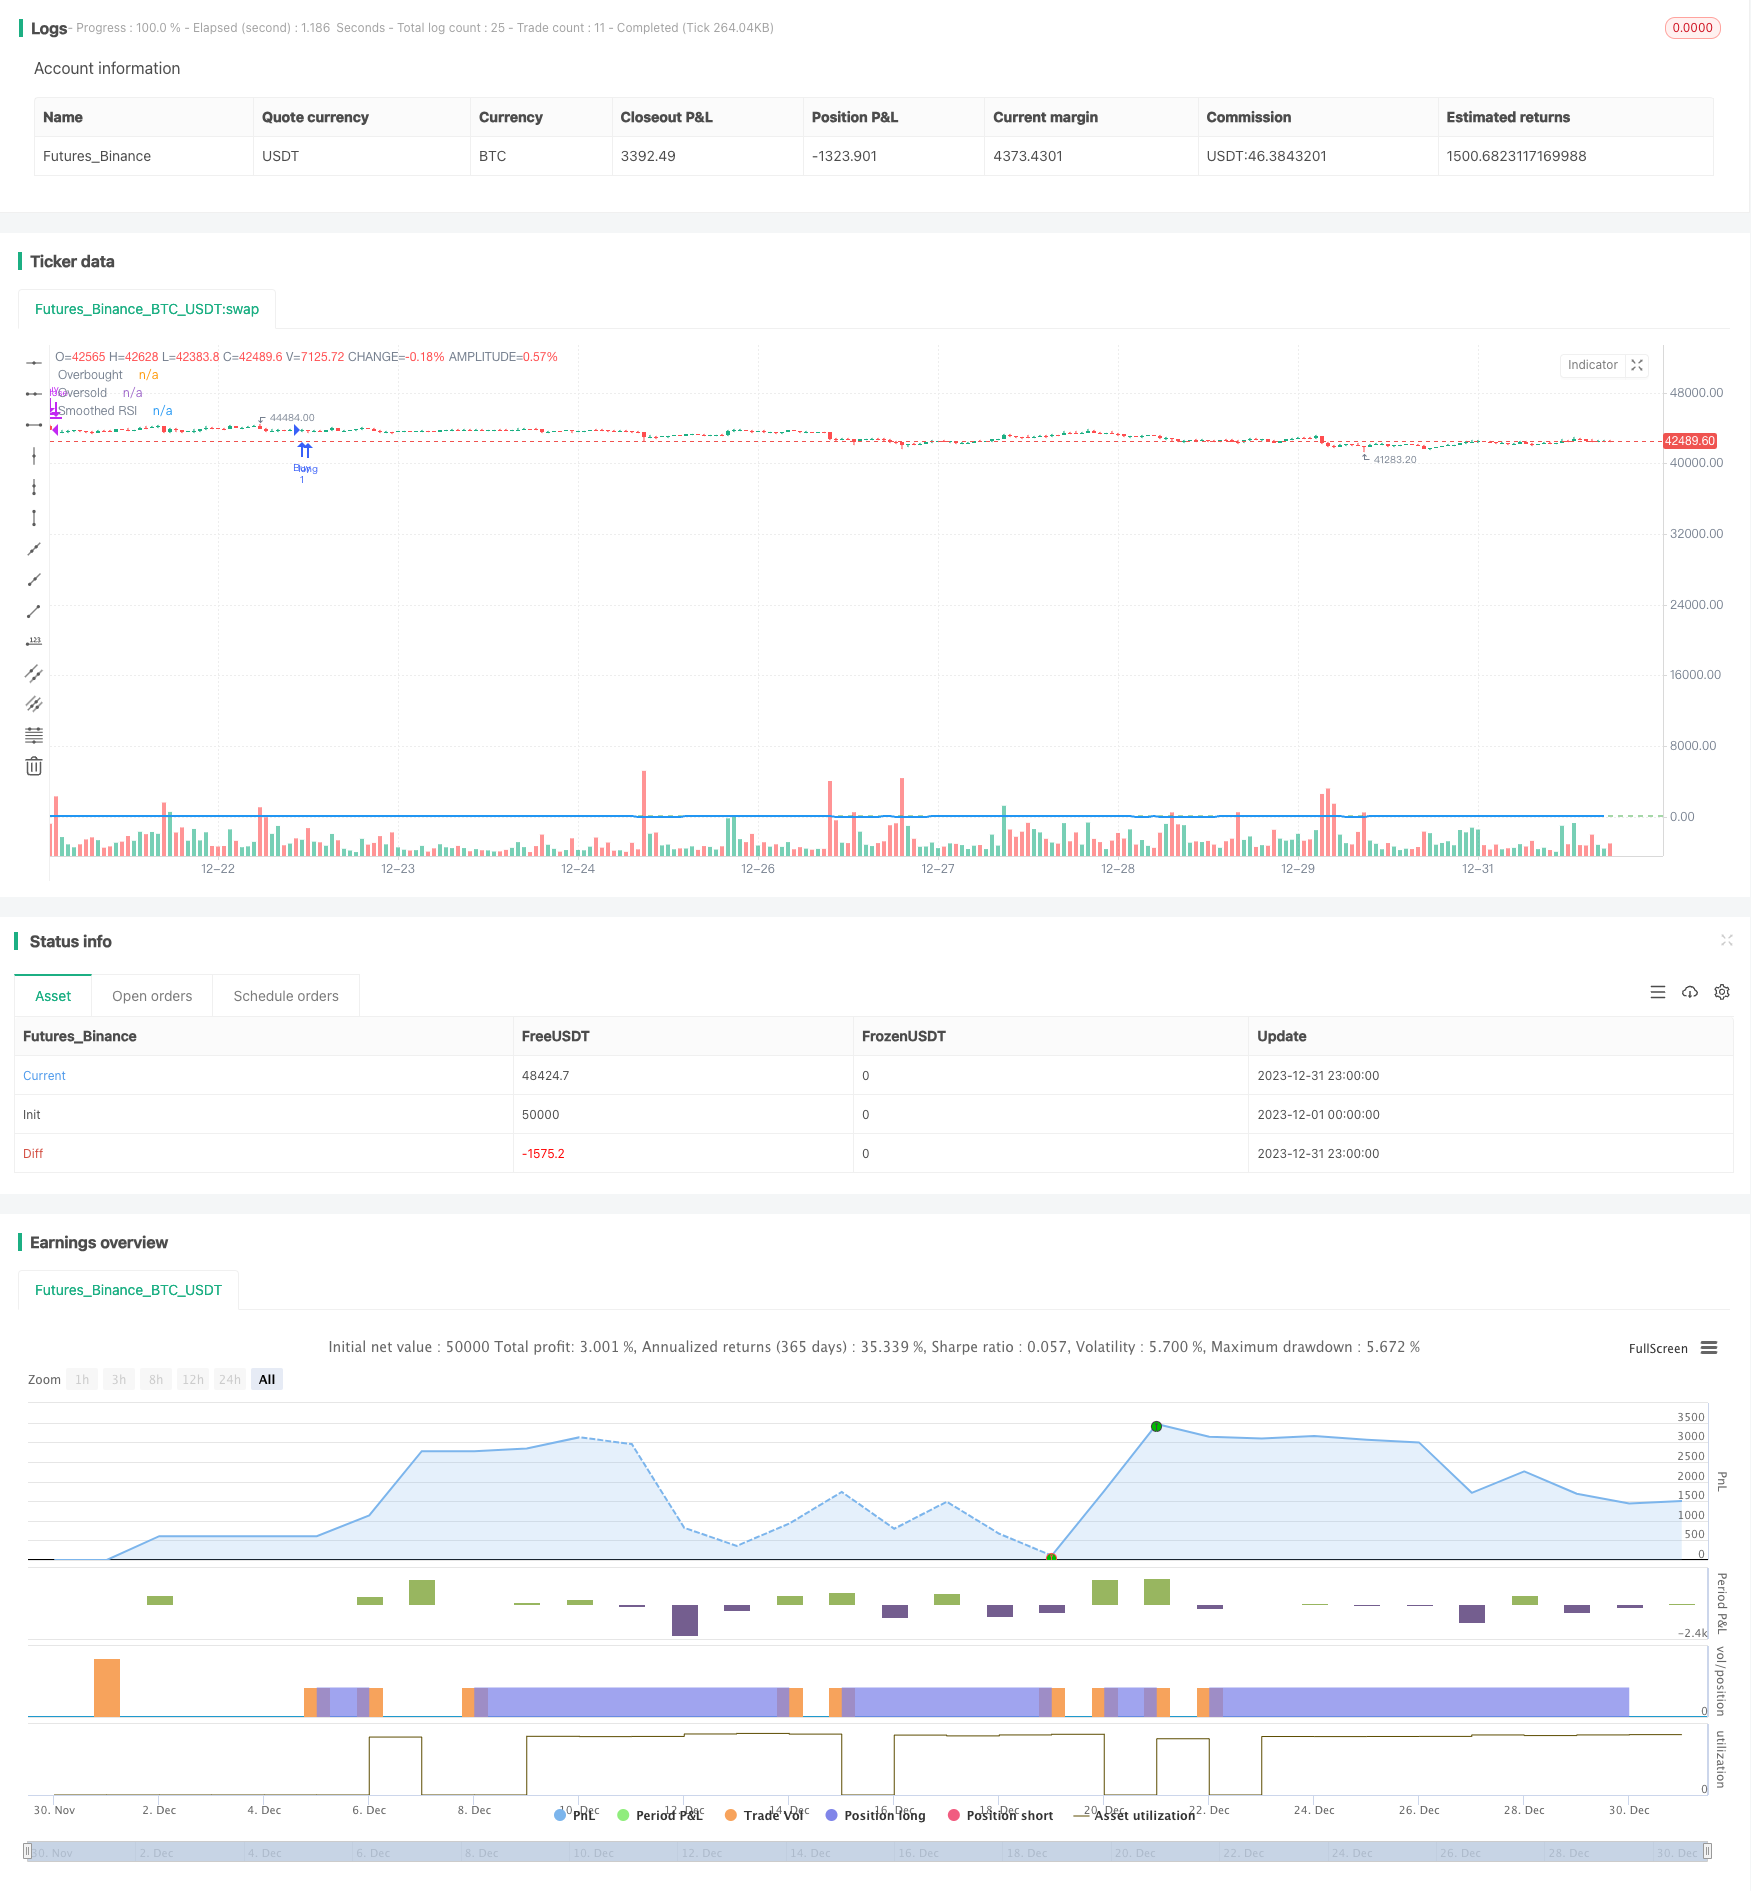
この戦略は,平滑後の比較的強い指数 ((RSI)) をベースに買いと売りのシグナルを決定し,比較的に典型的なトレンド追跡戦略の1つである.特定の期間における株式価格の急落の幅を計算することによって,投資家が市場が超買い状態にあるか超売り状態にあるかを判断して,投資決定を行うのを助ける.
戦略原則
- 株の5日間のRSIを計算する
- RSI値の5日間の移動平均で,平らなRSI指標が得られます.
- オーバーバイのラインは80で,オーバーセルのラインは40です.
- RSIの平らな線が超売れ線を突破すると,買入シグナルが生じる.
- RSIの下滑が超買いラインを突破すると,売り込み信号が生じる
この戦略の鍵は,平らなRSI指標の設定にある. RSI指標は,株価の超買い超売り状況を反映することができる. しかし,原始RSI指標は,価格とともに急激に波動し,取引シグナルを生成するのに不利である. したがって,この戦略は,これを平らにして,5日間の単純な移動平均を採用し,一部のノイズを効果的にフィルタリングし,取引シグナルをより明確にして信頼できます.
優位分析
- RSIの平らな指数は,RSIの安定性を高め,取引信号をより信頼性のあるものにします.
- RSIの平滑化には,シンプル・ムービング・アヴェアを使用し,パラメータを最適化し,限界を設定する人の制約を回避します.
- 超買いと超売り領域を組み合わせて,市場の状況を明確に判断し,買入と売却のシグナルを生成します.
- シンプルで理解し,実行できる戦略
リスクと最適化分析
- RSIの平らな指数は,RSIの感受性を低下させ,購入と販売の遅延を引き起こす可能性があります.
- 移動平均の長さと超買超売の値の設定は,戦略のパフォーマンスに影響し,パラメータの最適化が必要である
- 取引信号は偽陽性および偽陰性であり,価格動向および取引量などの要因と組み合わせて分析されるべきである.
- RSIにのみ依存することは,戦略の不安定性につながる可能性があり,他の技術指標または基本指標と組み合わせて検討することができます.
最適化の方向
- 移動平均日数と超買超売り値の調整,最適化パラメータ
- MACD,KDなどの他の技術指標を追加し,統合取引シグナルを作成します.
- 取引量のフィルタリングメカニズムを追加し,価格が異動しているのに取引量がアクティブでないときに誤ったシグナルを生じないようにします.
- 株式の基本面と業界の景気との組み合わせにより,戦略の安定性を高める
- リスク管理: 取引の損失が一定に達したときに,損失を止めて退出する戦略を追加する
要約する
この戦略は,RSI指標を計算し,平滑に処理することで,合理的な超買超売領域を設定し,より明確な買出信号を生成する.原始RSI戦略と比較して,信号がより安定し,信頼性の高い利点があります.しかし,いくつかの改善の余地があり,投資家は,パラメータを最適化したり,他の指標を追加したりなどの方法で戦略を強化し,より複雑な市場環境に対応できるようにすることができます.
ストラテジーソースコード
/*backtest
start: 2023-12-01 00:00:00
end: 2023-12-31 23:59:59
period: 1h
basePeriod: 15m
exchanges: [{"eid":"Futures_Binance","currency":"BTC_USDT"}]
*/

//@version=5
strategy("Smoothed RSI Strategy", overlay=true)

// Calculate the RSI
length = 5
rsiValue = ta.rsi(close, length)

// Smooth the RSI using a moving average
smoothedRsi = ta.sma(rsiValue, length)

// Define overbought and oversold thresholds
overbought = 80
oversold = 40

// Buy signal when RSI is in oversold zone
buyCondition = ta.crossover(smoothedRsi, oversold)

// Sell signal when RSI is in overbought zone
sellCondition = ta.crossunder(smoothedRsi, overbought)

// Plotting the smoothed RSI
// Plotting the smoothed RSI in a separate pane
plot(smoothedRsi, color=color.blue, title="Smoothed RSI", style=plot.style_line, linewidth=2)

//plot(smoothedRsi, color=color.blue, title="Smoothed RSI")
hline(overbought, "Overbought", color=color.red)
hline(oversold, "Oversold", color=color.green)

// Strategy logic for buying and selling
if (buyCondition)
    strategy.entry("Buy", strategy.long)
if (sellCondition)
    strategy.close("Buy")