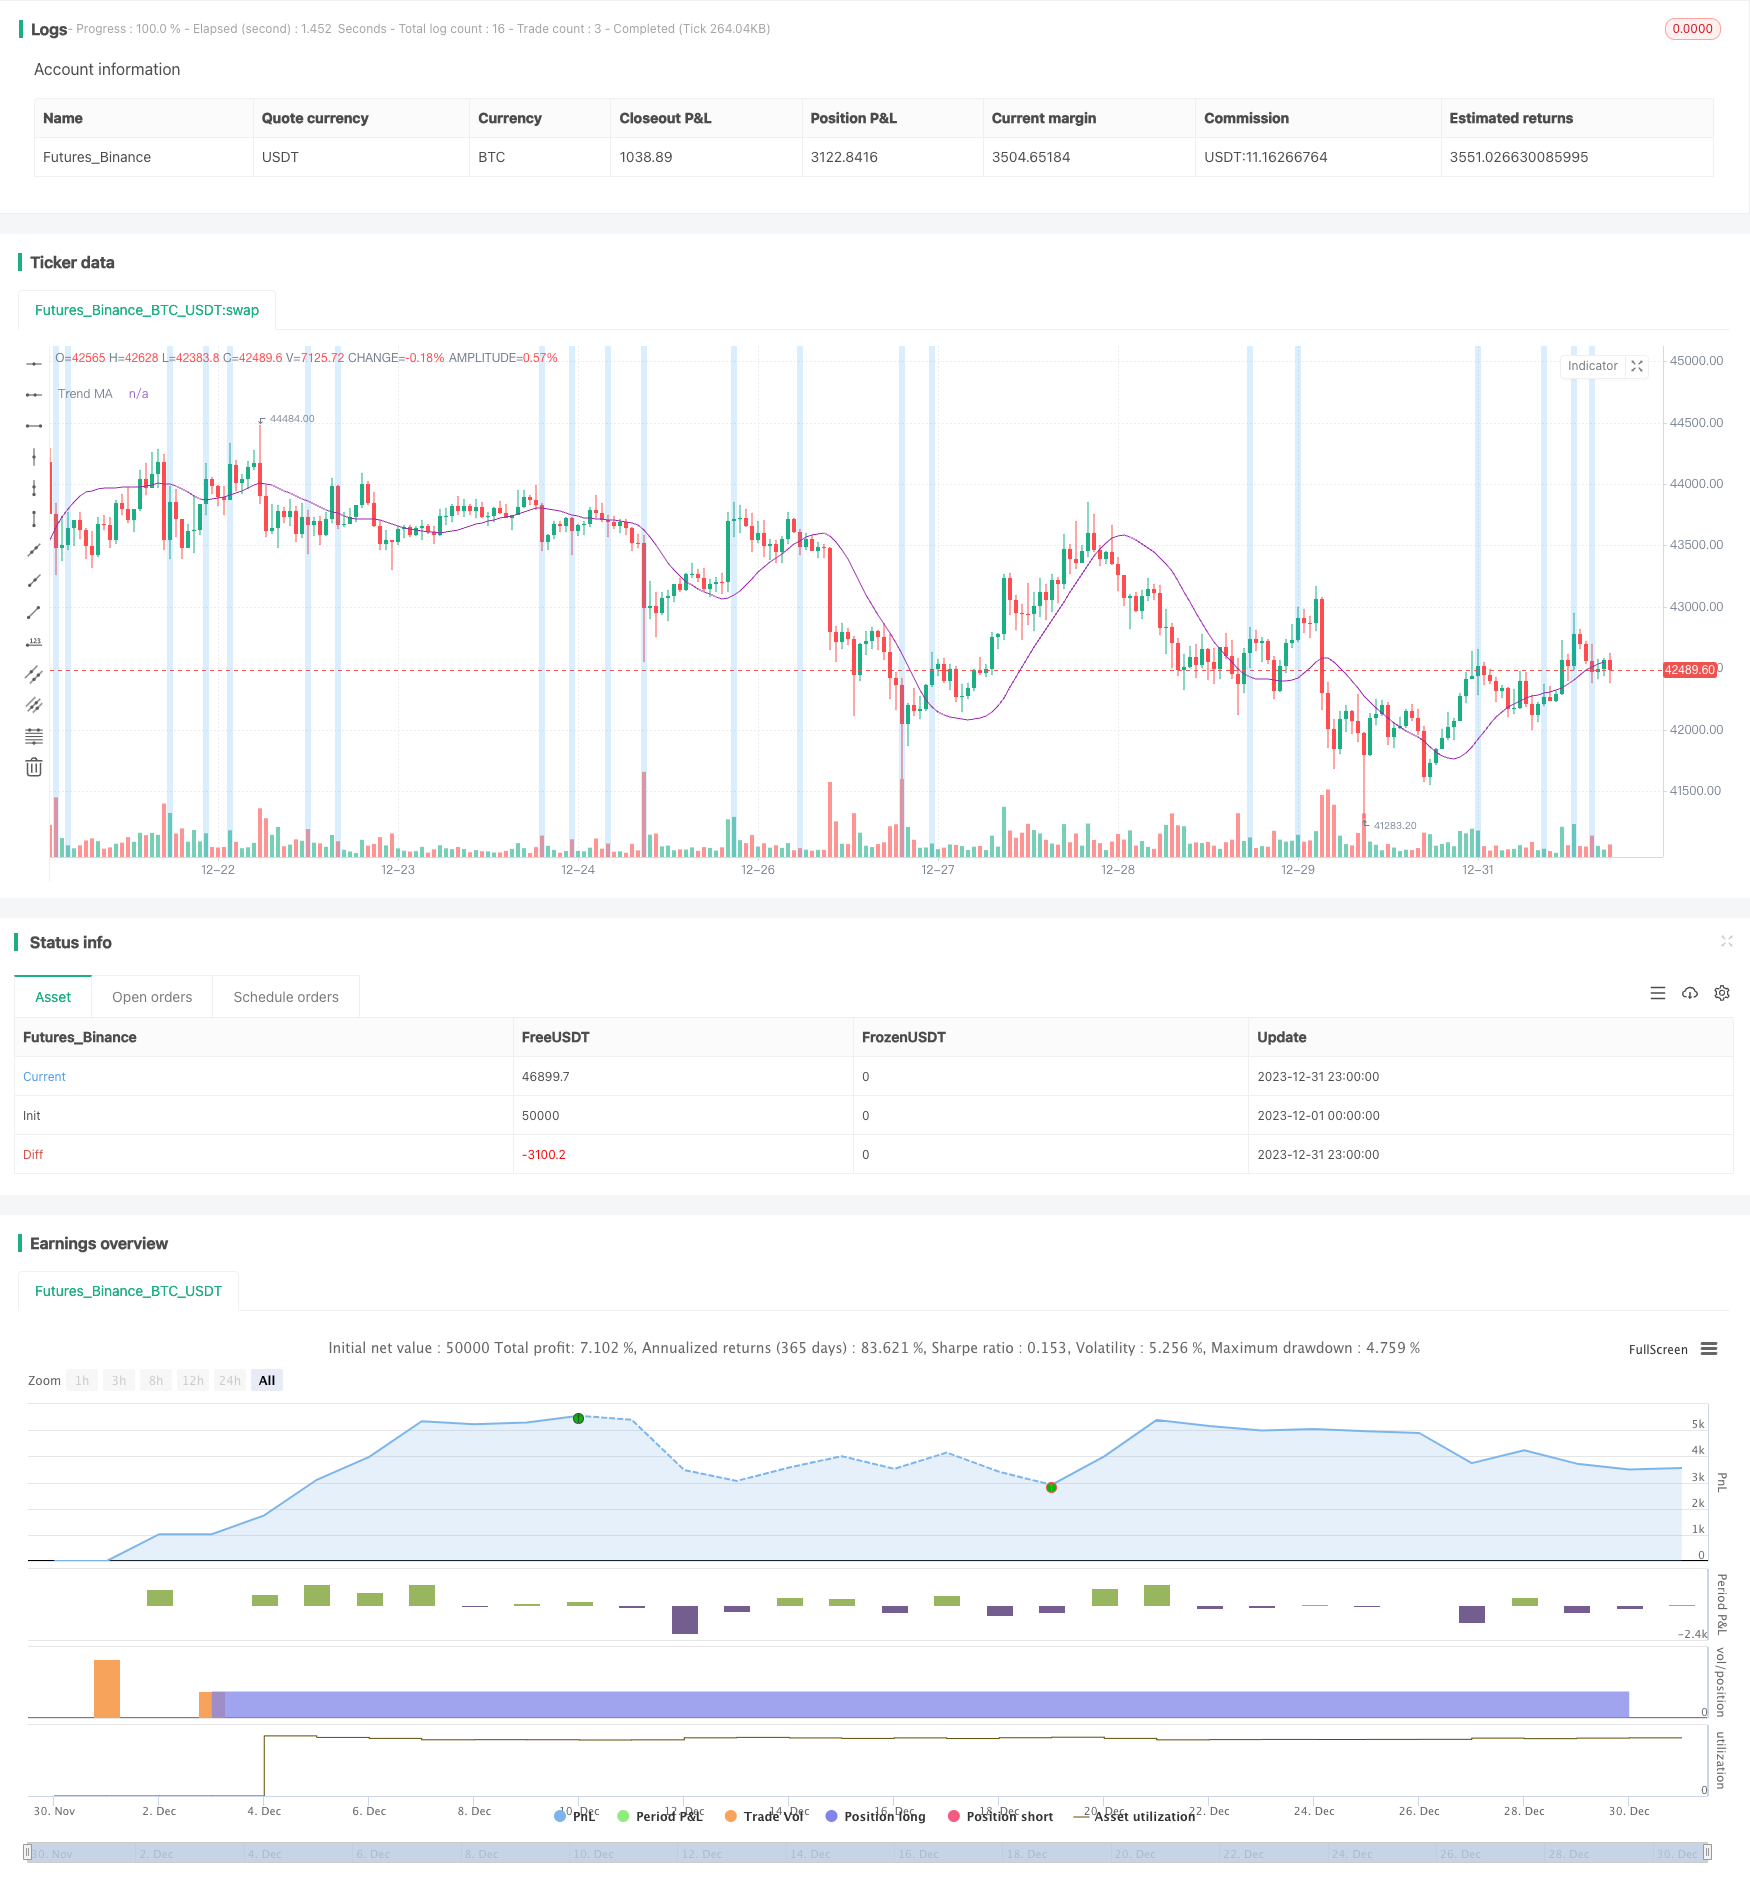
ダブルインサイドバー&トレンド戦略
作者: リン・ハーンチャオチャン, 日付: 2024-01-30 15:11:48タグ:

ダブルインサイドバー&トレンド戦略
概要
ダブルインサイドバー&トレンド戦略は,トレンドを決定するために,移動平均と組み合わせたダブルインサイドバーパターンを利用する定量的な取引戦略である.ダブルインサイドバーで高い確率の取引信号を提供し,移動平均線によって判断されるトレンドに応じて長または短に行く.
戦略の論理
- トレンド判断の指標としてハル移動平均 (HMA) を使用する.
- 内部バーのパターンは,前方のバーが最後のバーの高値と低値を取り巻くパターンです.
- 閉じる価格がMAより上であり,上昇傾向の内部バーが形成されれば,内部バーの高さの周りに買いストップオーダーを配置します.閉じる価格がMAより下であり,下落傾向の内部バーが形成されれば,内部バーの低さの周りに販売ストップオーダーを配置します.
- ストップオーダーが起動したら,前もって定義されたストップ損失率と 利益率に基づいてストップ損失と 利益率を設定します.
利点分析
- インサイドバーは反転の可能性が高い信号を提供する.ダブルインサイドバーの発生は,短期的な価格反転を示す可能性がある.
- 移動平均値で主要トレンドの方向性を追っていると 利益の確率が向上します
- トレンドの突破点の周りにストップオーダーを使うことは 良いエントリーチャンスです
リスク分析
- ランジング市場では,バー内からの取引信号はしばしば損失につながる可能性があります.
- トレンド指標としての移動平均値は,誤ったシグナルを与え,反トレンド取引による損失を引き起こす可能性があります.
- ストップ・ロスは 狭すぎると 小規模な値引きによって 引き起こす可能性があります
オプティマイゼーションの方向性
- トレンド判断指標として移動平均の異なるパラメータをテストする.
- 他の指標を組み合わせて市場をフィルタリングし,明確なトレンドのない盲目取引を避ける.
- 移動平均期,ストップ損失倍数,利益率など,ビッグデータ分析を通じてより最適なパラメータの組み合わせを得ます.
- 異なる時間枠と製品特性に適応するために,取引セッションと製品にフィルターを追加します.
概要
ダブルインサイドバー&トレンド戦略は,ダブルインサイドバーからの高い確率の取引信号を利用し,移動平均によって,主要トレンド方向を決定し,比較的安定したブレークアウト戦略になります.パラメータ最適化と論理最適化によって,この戦略の適応性と収益性が向上できます.
/*backtest
start: 2023-12-01 00:00:00
end: 2023-12-31 23:59:59
period: 1h
basePeriod: 15m
exchanges: [{"eid":"Futures_Binance","currency":"BTC_USDT"}]
*/

// This source code is subject to the terms of the Mozilla Public License 2.0 at https://mozilla.org/MPL/2.0/
// © Kaspricci

//@version=5
strategy(
     title = "Double Inside Bar & Trend Strategy - Kaspricci",
     shorttitle = "Double Inside Bar & Trend",
     overlay=true,
     initial_capital = 100000,
     currency = currency.USD,
     default_qty_type = strategy.percent_of_equity,
     default_qty_value = 100,
     calc_on_every_tick = true,
     close_entries_rule = "ANY")

// ================================================ Entry Inputs ======================================================================
headlineEntry   = "Entry Seettings"

maSource        = input.source(defval = close,             group = headlineEntry, title = "MA Source")
maType          = input.string(defval = "HMA",             group = headlineEntry, title = "MA Type", options = ["EMA", "HMA", "SMA", "SWMA", "VWMA", "WMA"])
maLength        = input.int(   defval = 45,    minval = 1, group = headlineEntry, title = "HMA Length")

float ma = switch maType
    "EMA"  => ta.ema(maSource,  maLength)
    "HMA"  => ta.hma(maSource,  maLength)
    "SMA"  => ta.sma(maSource,  maLength)
    "SWMA" => ta.swma(maSource)
    "VWMA" => ta.vwma(maSource, maLength)
    "WMA"  => ta.wma(maSource,  maLength)

plot(ma, "Trend MA", color.purple)

// ================================================ Trade Inputs ======================================================================
headlineTrade   = "Trade Seettings"

stopLossType    = input.string(defval = "ATR",                         group = headlineTrade,                 title = "Stop Loss Type",            options = ["ATR", "FIX"])
atrLength       = input.int(   defval = 50,   minval = 1,              group = headlineTrade, inline = "ATR", title = "   ATR: Length                 ")
atrFactor       = input.float( defval =  2.5, minval = 0, step = 0.05, group = headlineTrade, inline = "ATR", title = "Factor       ",             tooltip = "multiplier for ATR value")
takeProfitRatio = input.float( defval =  2.0, minval = 0, step = 0.05, group = headlineTrade,                 title = "            TP Ration",     tooltip = "Multiplier for Take Profit calculation")
fixStopLoss     = input.float( defval = 10.0, minval = 0, step = 0.5,  group = headlineTrade, inline = "FIX", title = "   FIX: Stop Loss             ") * 10 // need this in ticks
fixTakeProfit   = input.float( defval = 20.0, minval = 0, step = 0.5,  group = headlineTrade, inline = "FIX", title = "Take Profit",               tooltip = "in pips") * 10 // need this in ticks
useRiskMagmt    = input.bool(  defval = true,                          group = headlineTrade, inline = "RM",  title = "")
riskPercent     = input.float( defval = 1.0,  minval = 0., step = 0.5, group = headlineTrade, inline = "RM",  title = "Risk in %                ", tooltip = "This will overwrite quantity from startegy settings and calculate the trade size based on stop loss and risk percent") / 100

// ================================================ Filter Inputs =====================================================================
headlineFilter  = "Filter Setings"

// date filter
filterDates     = input.bool(defval = false,                                 group = headlineFilter, title = "Filter trades by dates")
startDateTime   = input(defval = timestamp("2022-01-01T00:00:00+0000"), group = headlineFilter, title = "       Start Date & Time")
endDateTime     = input(defval = timestamp("2099-12-31T23:59:00+0000"), group = headlineFilter, title = "       End Date & Time  ")

dateFilter      = not filterDates or (time >= startDateTime and time <= endDateTime)

// session filter
filterSession   = input.bool(title = "Filter trades by session", defval = false, group = headlineFilter)
session         = input(title = "       Session", defval = "0045-2245", group = headlineFilter)

sessionFilter   = not filterSession or time(timeframe.period, session, timezone = "CET")

// ================================================ Trade Entries and Exits =====================================================================

// calculate stop loss
stopLoss        = switch stopLossType
    "ATR" => nz(math.round(ta.atr(atrLength) * atrFactor / syminfo.mintick, 0), 0)
    "FIX" => fixStopLoss

// calculate take profit
takeProfit      = switch stopLossType
    "ATR" => math.round(stopLoss * takeProfitRatio, 0)
    "FIX" => fixTakeProfit


doubleInsideBar = high[2] > high[1] and high[2] > high[0] and low[2] < low[1] and low[2] < low[0]

// highlight mother candel and inside bar candles
bgcolor(doubleInsideBar ? color.rgb(33, 149, 243, 80) : na)
bgcolor(doubleInsideBar ? color.rgb(33, 149, 243, 80) : na, offset = -1)
bgcolor(doubleInsideBar ? color.rgb(33, 149, 243, 80) : na, offset = -2)

var float buyStopPrice  = na
var float sellStopPrice = na

if (strategy.opentrades == 0 and doubleInsideBar and barstate.isconfirmed)
    buyStopPrice  := high[0] // high of recent candle (second inside bar)
    sellStopPrice := low[0] // low of recent candle (second inside bar)

    tradeID = str.tostring(strategy.closedtrades + strategy.opentrades + 1)

    quantity = useRiskMagmt ? math.round(strategy.equity * riskPercent / stopLoss, 2) / syminfo.mintick : na

    commentTemplate = "{0} QTY: {1,number,#.##} SL: {2} TP: {3}"

    if (close > ma)
        longComment = str.format(commentTemplate, tradeID + "L", quantity, stopLoss / 10, takeProfit / 10)
        strategy.entry(tradeID + "L", strategy.long, qty = quantity, stop = buyStopPrice, comment = longComment)
        strategy.exit(tradeID + "SL", tradeID + "L", profit = takeProfit, loss = stopLoss, comment_loss = "SL", comment_profit = "TP")

    if (close < ma)
        shortComment = str.format(commentTemplate, tradeID + "S", quantity, stopLoss / 10, takeProfit / 10)
        strategy.entry(tradeID + "S", strategy.short, qty = quantity, stop = sellStopPrice, comment = shortComment)
        strategy.exit(tradeID + "SL", tradeID + "S", profit = takeProfit, loss = stopLoss, comment_loss = "SL", comment_profit = "TP")

// as soon as the first pending order has been entered the remaing pending order shall be cancelled
if strategy.opentrades > 0
    currentTradeID = str.tostring(strategy.closedtrades + strategy.opentrades)
    strategy.cancel(currentTradeID + "S")
    strategy.cancel(currentTradeID + "L")
もっと
- ダブル・フラクタル・ブレイクアウト戦略
- ノロは移動平均ストップ損失戦略を変えた
- 2倍指数関数移動平均RSI取引戦略
- 簡単な移動平均のクロスオーバー戦略
- 市場流動性と動向に基づいたスキルピング戦略
- 国境を越えた短期的な突破の逆転 5EMA戦略
- RSI指標に基づく株式取引ピラミッド戦略
- EMAチャネル取引戦略について
- 2階建てのRSI取引戦略
- Bollinger Bands と RSI の組み合わせ戦略
- 驚異的な価格ブレイク戦略
- 堅調なトレンドの継続戦略
- トレンドトラッキング 移動平均クロスオーバー戦略
- 突破逆転モデル トートル取引戦略に基づいた
- モメント トレンド 戦略
- 短期間の取引戦略
- 調整されたRSIベースの株式取引戦略
- スムーズ・ボラティリティ・バンド戦略
- コモディティチャネルインデックス逆転取引戦略
- ATRの時間に基づく戦略