RSI指数に基づく株式取引の双向ピラミッド戦略
作者: リン・ハーンチャオチャン,日付: 2024-01-30 15:26:49タグ:

概要
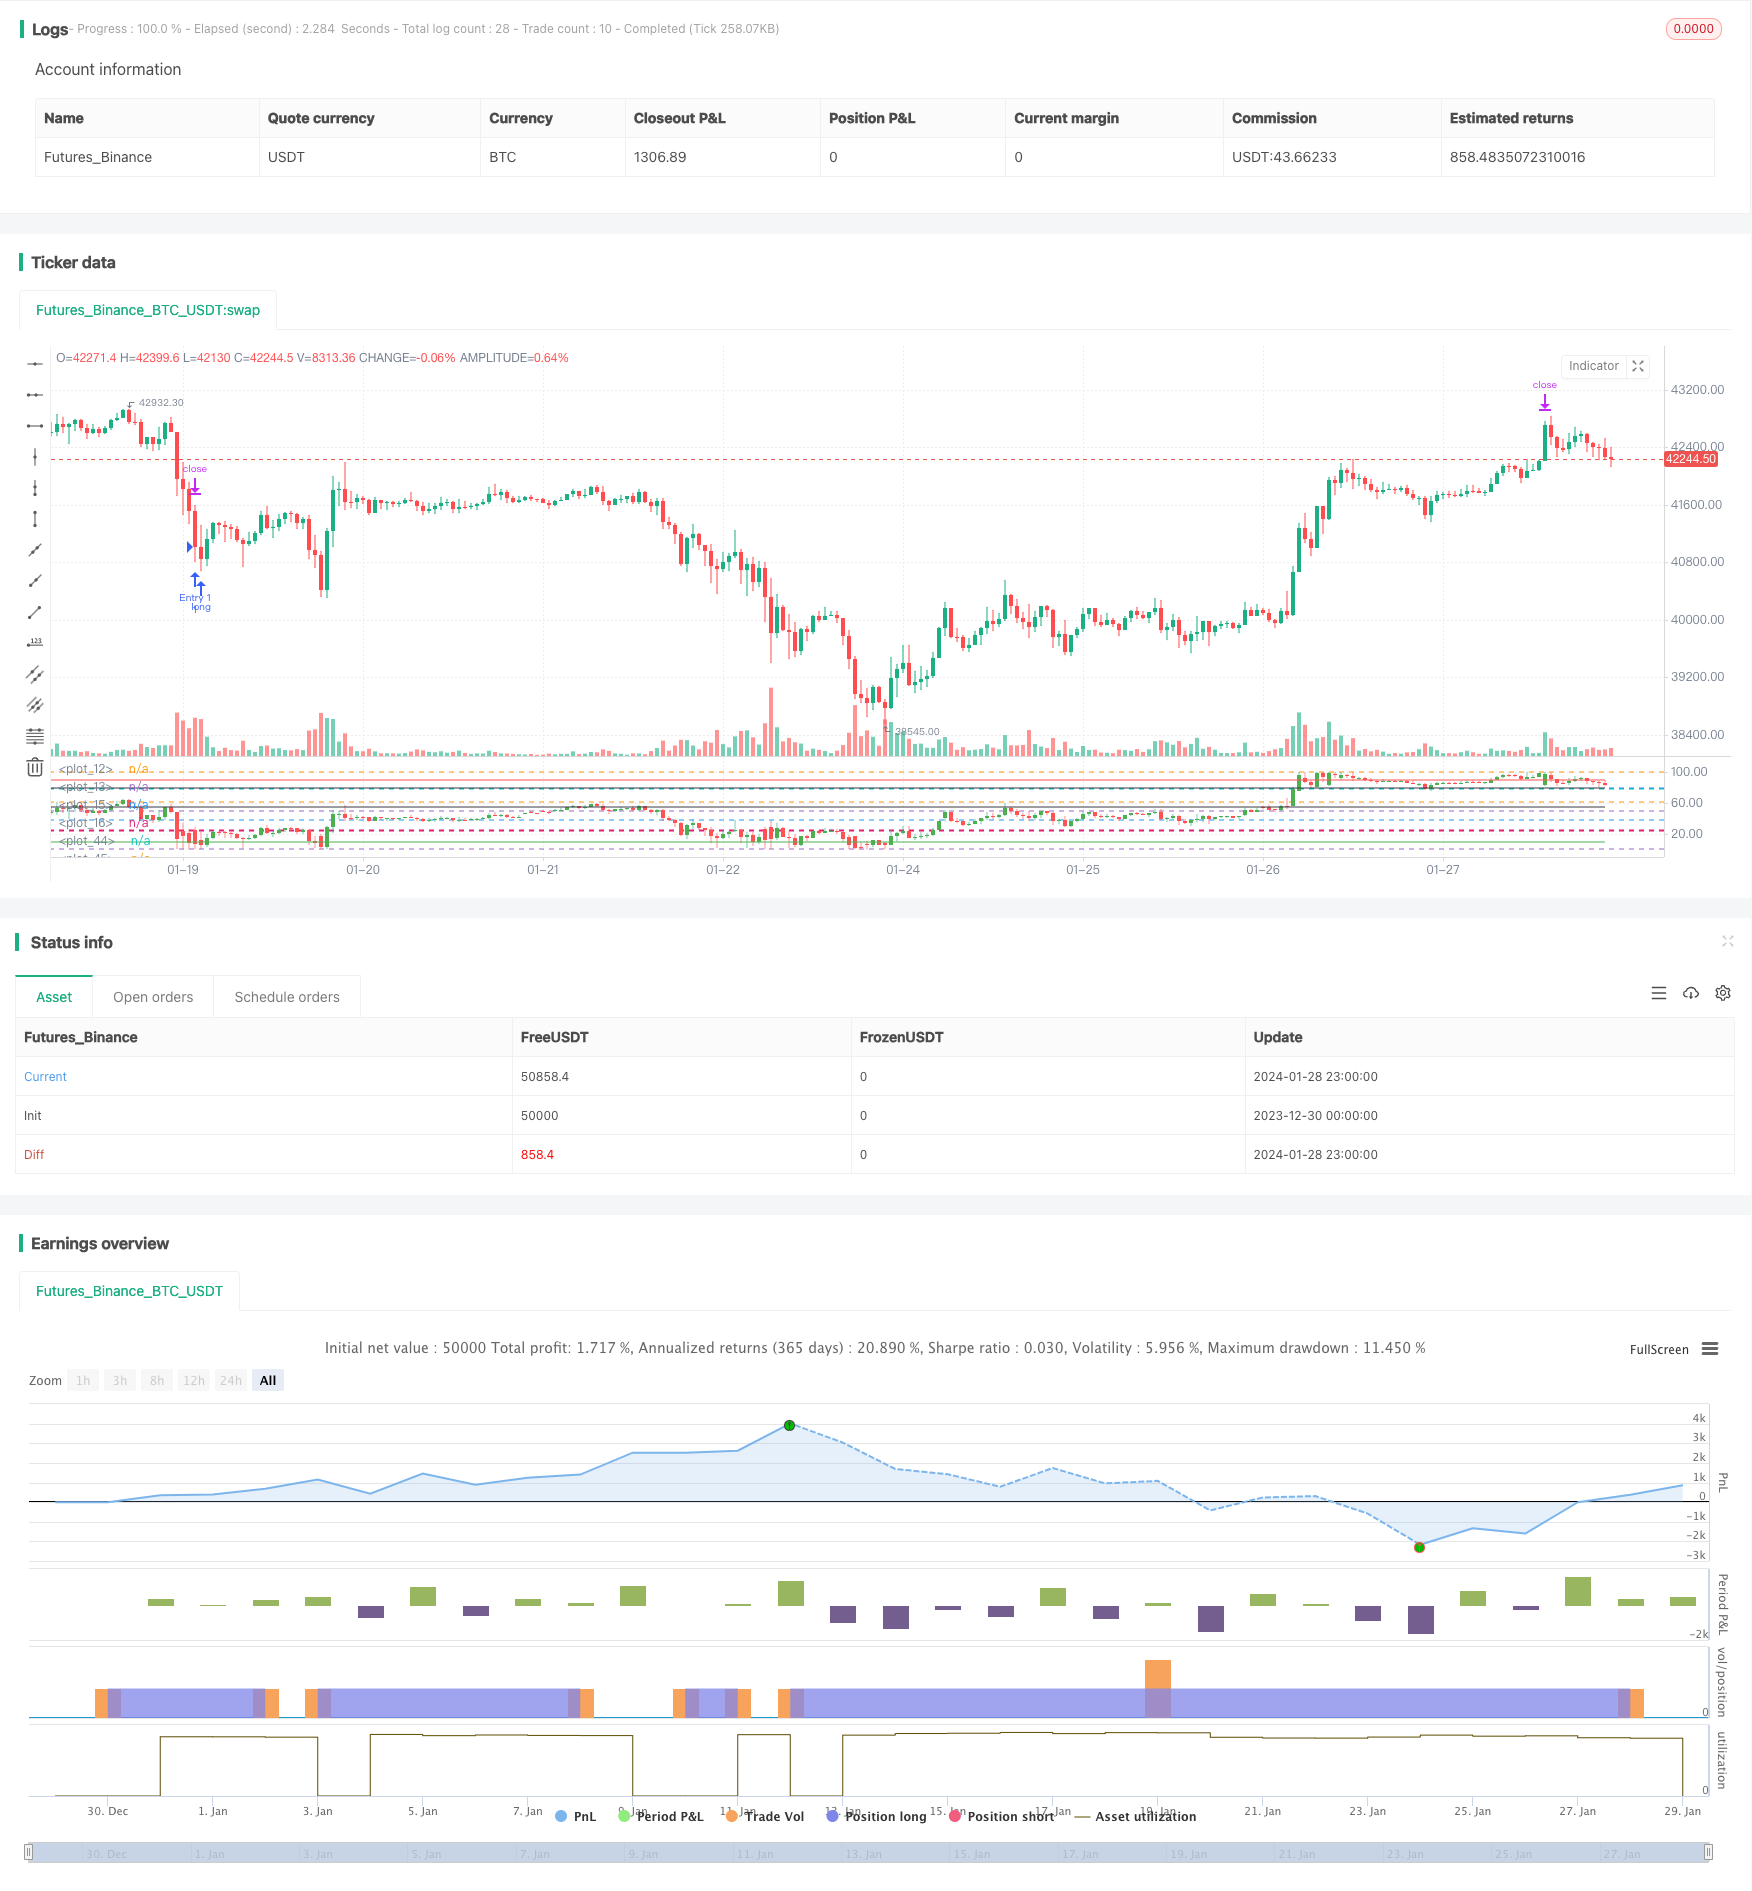
本文は,比較的強い指標 (RSI) をベースに設計された株式取引の双向ピラミッド戦略を紹介する.この戦略は,RSIを活用して,株の超買い超売地域を判断し,ピラミッド加仓原理と連携して利益を達成する.
戦略の原理
- RSIは,株がオーバーバイ・オーバーセール領域に入っているかどうかを判断する指標である. RSIが25以下ではオーバーセール,80以上ではオーバーセールである.
- RSIが超売り領域に入ると多入入を開始する.
- ピラミッド加仓の方法により,最大7回まで加仓する.各加仓後には停止・停止・損失を設定する.
優位性分析
- RSIは,超買い超売面積を判断し,より大きな価格逆転の機会を捉える.
- ピラミッド投資は,市場が正しいときより良い利回りを得ることができます.
- リスクをコントロールするために,すべての投資の後,停止停止を設定します.
リスク分析
- RSIは,過買い過売の効果が不安定で,誤った信号が出る可能性があると判断する.
- 投資の頻度を合理的に設定する必要があります. 過剰な投資リスクは増加します.
- 停止損失点設定は波動率を考慮する必要がある.
優化方向
- 他の指標と組み合わせてRSI信号をフィルタリングすることを検討し,過買過売を判断する精度を向上させることができる.例えばKDJ,BOLLなどの指標の組み合わせ.
- 浮遊停止損失を設定して価格を追跡する. 波動率とリスク制御の要求に応じて動的調整する.
- 市場状況 (牛市,熊市など) に応じて適応パラメータを使用することを検討できます.
概要
この戦略は,RSI指標とピラミッド加仓戦略を組み合わせ,過買い過売を判断する一方で,加仓によってより多くの利益を得ることができる.しかし,RSI判断の精度が改善される必要があるが,合理的なパラメータを最適化することで,他の指標と組み合わせて効果のある安定した取引戦略を形成することができる.この戦略は,比較的シンプルで直接的な量化取引方法である.
/*backtest
start: 2023-12-30 00:00:00
end: 2024-01-29 00:00:00
period: 1h
basePeriod: 15m
exchanges: [{"eid":"Futures_Binance","currency":"BTC_USDT"}]
*/

//@version=4
// This source code is subject to the terms of the Mozilla Public License 2.0 at https://mozilla.org/MPL/2.0/
// © RafaelZioni

strategy(title='Simple RSI strategy', overlay=false)

SWperiod = 1
look = 0
OverBought = input(80, minval=50)
OverSold = input(25, maxval=50)

bandmx = hline(100)
bandmn = hline(0)

band1 = hline(OverBought)
band0 = hline(OverSold)
//band50 = hline(50, color=black, linewidth=1)
fill(band1, band0, color=color.purple, transp=98)


src = close
len = input(5, minval=1, title="RSI Length")
up = rma(max(change(src), 0), len)
down = rma(-min(change(src), 0), len)
rsi = down == 0 ? 100 : up == 0 ? 0 : 100 - 100 / (1 + up / down)

p = 100

//scale
hh = highest(high, p)
ll = lowest(low, p)
scale = hh - ll

//dynamic OHLC
dyno = (open - ll) / scale * 100
dynl = (low - ll) / scale * 100
dynh = (high - ll) / scale * 100
dync = (close - ll) / scale * 100

//candle color
color_1 = close > open ? 1 : 0

//drawcandle
hline(78.6)
hline(61.8)
hline(50)
hline(38.2)
hline(23.6)
plotcandle(dyno, dynh, dynl, dync, title="Candle", color=color_1 == 1 ? color.green : color.red)
plot(10, color=color.green)
plot(55, color=color.black)
plot(80, color=color.black)
plot(90, color=color.red)

long = rsi <= OverSold ? 5 : na

//Strategy
golong = rsi <= OverSold ? 5 : na

longsignal = golong
//based on https://www.tradingview.com/script/7NNJ0sXB-Pyramiding-Entries-On-Early-Trends-by-Coinrule/
//set take profit

ProfitTarget_Percent = input(3)
Profit_Ticks = close * (ProfitTarget_Percent / 100) / syminfo.mintick

//set take profit

LossTarget_Percent = input(10)
Loss_Ticks = close * (LossTarget_Percent / 100) / syminfo.mintick


//Order Placing

strategy.entry("Entry 1", strategy.long, when=strategy.opentrades == 0 and longsignal)

strategy.entry("Entry 2", strategy.long, when=strategy.opentrades == 1 and longsignal)

strategy.entry("Entry 3", strategy.long, when=strategy.opentrades == 2 and longsignal)

strategy.entry("Entry 4", strategy.long, when=strategy.opentrades == 3 and longsignal)

strategy.entry("Entry 5", strategy.long, when=strategy.opentrades == 4 and longsignal)

strategy.entry("Entry 6", strategy.long, when=strategy.opentrades == 5 and longsignal)

strategy.entry("Entry 7", strategy.long, when=strategy.opentrades == 6 and longsignal)


if strategy.position_size > 0
    strategy.exit(id="Exit 1", from_entry="Entry 1", profit=Profit_Ticks, loss=Loss_Ticks)
    strategy.exit(id="Exit 2", from_entry="Entry 2", profit=Profit_Ticks, loss=Loss_Ticks)
    strategy.exit(id="Exit 3", from_entry="Entry 3", profit=Profit_Ticks, loss=Loss_Ticks)
    strategy.exit(id="Exit 4", from_entry="Entry 4", profit=Profit_Ticks, loss=Loss_Ticks)
    strategy.exit(id="Exit 5", from_entry="Entry 5", profit=Profit_Ticks, loss=Loss_Ticks)
    strategy.exit(id="Exit 6", from_entry="Entry 6", profit=Profit_Ticks, loss=Loss_Ticks)
    strategy.exit(id="Exit 7", from_entry="Entry 7", profit=Profit_Ticks, loss=Loss_Ticks)
もっと見る
- 牛市がショートライン戦略を撤回
- 移動平均線に適応したトレンド追跡戦略
- 真の相対運動のMAの均線戦略
- MACDとRSIをベースにした5分間の動力取引戦略
- 双重分岐突破戦略
- ノロ平移均線停止戦略
- バイインデックス移動平均RSI取引戦略
- 移動平均線の交差策
- 市場流動性とトレンドに基づいたショートライン取引戦略
- 国境を越えたショートラインは5EMA戦略を逆転させる
- 20日のEMA通路に基づく取引戦略
- 2層RSI取引戦略
- 収縮帯 ボリンガーとRSIの組み合わせ戦略
- 双面的な内包とトレンド戦略
- 価格破綻戦略
- 持続する戦略
- 傾向を追跡する均線交差戦略
- 海
トレーダーの戦略に基づいた突破型逆転モデル - 動力指標とトレンド追跡戦略
- ナッツ123 逆転とブレイク範囲のショートライン取引戦略