動的ポジション追加戦略に基づく

概要
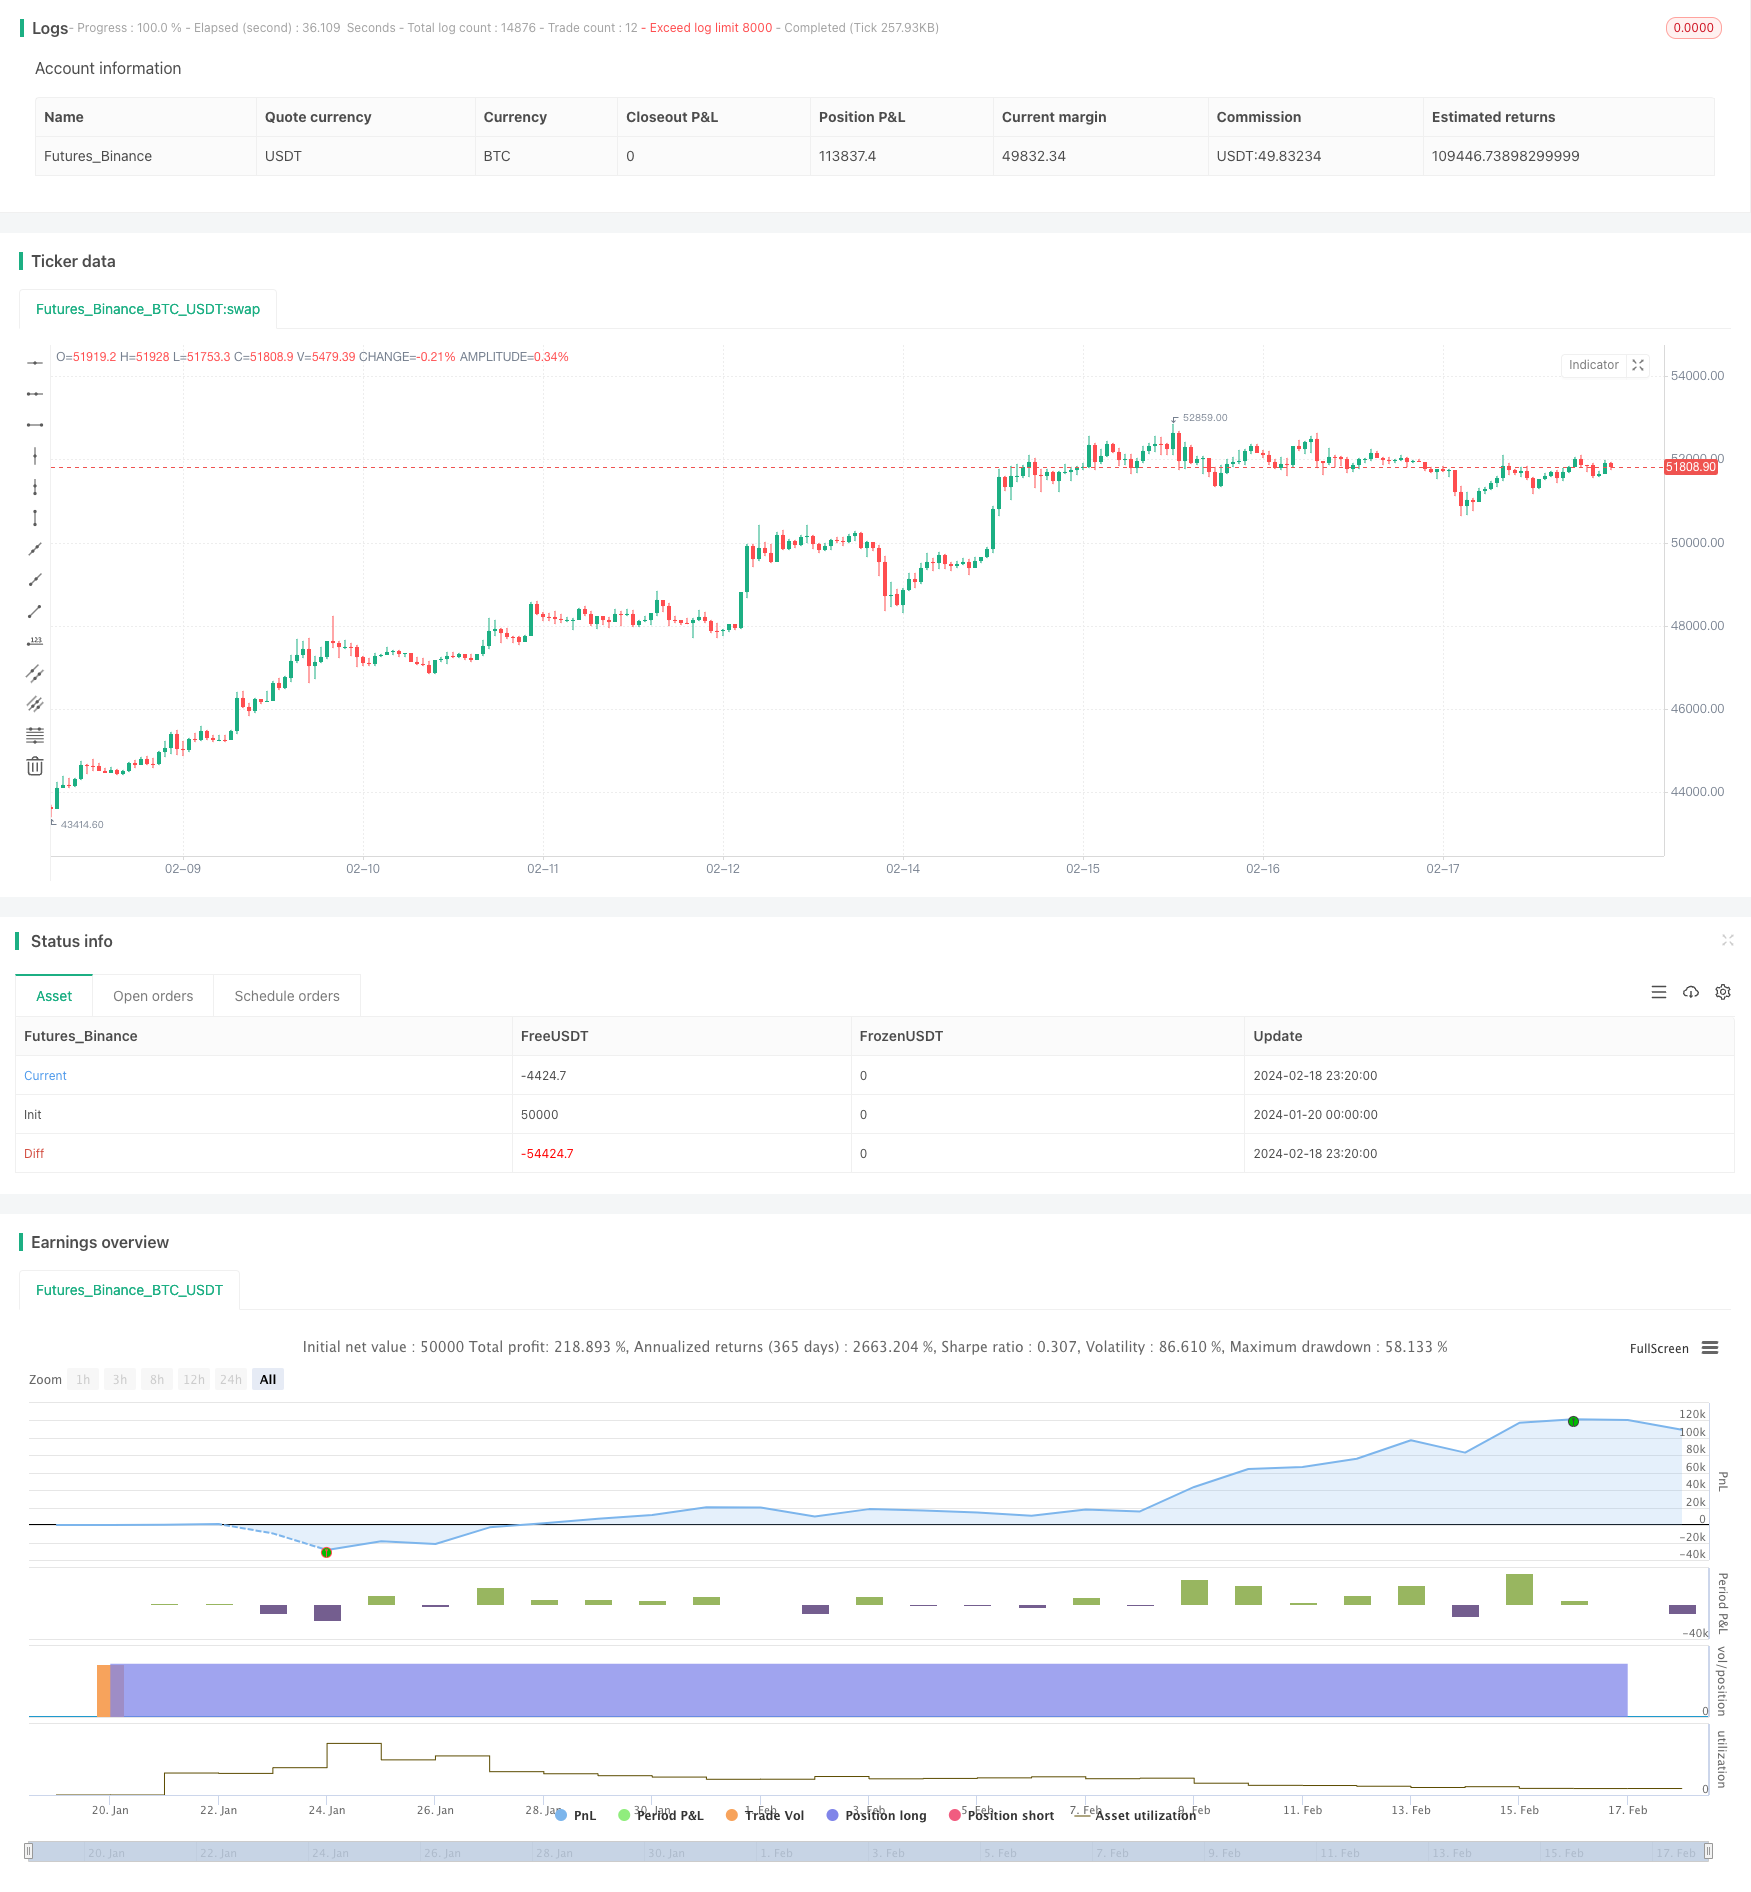
この戦略の主な考えは,システム信号の動向に基づいて加仓し,リスクをコントロールし,より低い平均入場価格を得るために,牛市で徐々にポジションを構築することである.
戦略原則
この戦略は,最初に初期資金とDCA配置パーセントを設定します. 各Kラインのクローズアップ時に,価格変化に応じて配置パーセントを調整します. 価格が上昇すると,パーセントを減少させ,価格が下がると,パーセントを増加させます.
このように,市場が波動する時に,リスクをコントロールし,より低い平均入場価格を得ることができる。同時に,平均入場価格と中位数価格を統計的に計算し,現在の入場状況を判断することができる。
優位分析
この戦略の利点は以下の通りです.
動的にポジションを増やして,下落時にポジションを増やし,上昇時にポジションを縮小して,リスクを制御する.
平均入場料は中位値より低いので,より大きな利益の余地があります.
牛市の中での波動に適した動きで,よりよいリスク/利益の比率を得ることができます.
初期資金とDCAの割合を設定し,加減するたびに加減する金額を制御し,過度のリスクを回避できます.
平均入場価格と中位数値の統計を提供することで,入場の優劣を直観的に判断できます.
リスク分析
この戦略にはいくつかのリスクがあります.
市場が崖っぷちのように下落する時には,この戦略は継続的にポジションを上げ,その結果,大きな資金損失をもたらす可能性があります. リスクを管理するために,ストップ・ロスを設定できます.
市場が急激に上昇した場合,この戦略の加仓幅は低下し,上昇の機会の大半を逃す可能性があります.このとき,他の信号を利用して,迅速なLSIを行う必要があります.
パラメータを正しく設定しない場合もリスクがあります. 初期資金が多すぎると,DCA比率が高すぎると,損失が拡大します.
最適化の方向
この戦略は,以下の点で最適化できます.
ストップロズロジックが加えられ,大幅な下落の際に加仓を停止する.
波動率または他の指標の動態に応じてDCAパーセントを調整できます.
機械学習モデルが加えられ,価格の変動を予測して,投資決定を導くことができます.
他の技術指標と組み合わせて市場構造を判断し,構造転換点で加仓を止める.
資金管理モジュールを追加して,口座の資金状況に応じて,毎回の加設資金を動的に調整できます.
要約する
この戦略は,非常に実用的なダイナミックな加仓戦略である.市場状況の変動に応じてポジションを柔軟に調整し,牛市でより低い平均入場価格を得ることができる.同時に,リスクを管理するためのパラメータ設定を内蔵している.他の技術指標またはモデルと組み合わせれば,よりよい効果を得ることができる.この戦略は,長期投資の収益を追求する投資家に適している.
/*backtest
start: 2024-01-20 00:00:00
end: 2024-02-19 00:00:00
period: 1h
basePeriod: 15m
exchanges: [{"eid":"Futures_Binance","currency":"BTC_USDT"}]
*/

// This Pine Script™ code is subject to the terms of the Mozilla Public License 2.0 at https://mozilla.org/MPL/2.0/
// © RWCS_LTD

//@version=5
strategy("DCA IN Calculator {RWCS}", overlay=true, pyramiding=999, default_qty_type=strategy.cash, initial_capital=10000, commission_value=0.02)

// User inputs
backtestStartDate = input(timestamp("1 Jan 2024"),
     title="Start Date", group="Backtest Time Period",
     tooltip="This start date is in the time zone of the exchange " +
     "where the chart's instrument trades. It doesn't use the time " +
     "zone of the chart or of your computer.")
start_date = true
starting_capital = input.float(defval=5000, title="Starting Capital")
dca_allocation_percentage = input.int(defval=10, title="DCA Allocation Percentage")

// Calculate DCA allocation based on price change
price_change_percentage = ((close - close[1]) / close[1]) * 100
adjusted_allocation_percentage = close > close[1] ? dca_allocation_percentage - price_change_percentage : dca_allocation_percentage + price_change_percentage // If price action is negative, increase allocations
adjusted_allocation_percentage1 = dca_allocation_percentage - price_change_percentage // If price action is positive, reduce allocations

// Calculate order size based on adjusted allocation percentage
order_size = (adjusted_allocation_percentage / 100) * starting_capital

// Track remaining capital
var remaining_capital = starting_capital

// Long on the close of every bar
if true
    // Ensure the order size doesn't exceed remaining capital or adjusted allocation
    order_size := math.min(order_size, remaining_capital, adjusted_allocation_percentage / 100 * starting_capital)
    // Ensure order size is not negative
    order_size := math.max(order_size, 0)

    strategy.entry("DCA", strategy.long, qty = order_size)
    remaining_capital := remaining_capital - order_size

// Plot average entry price
var float total_entry_price = 0.0
var int total_signals = 0

if start_date
    total_entry_price := total_entry_price + close
    total_signals := total_signals + 1

avg_entry_price = total_entry_price / total_signals

// Calculate and plot median price
var float median_price = na

if start_date
    var float sum_prices = 0.0
    var int num_prices = 0

    for i = 0 to bar_index
        if (time[i] >= backtestStartDate)
            sum_prices := sum_prices + close[i]
            num_prices := num_prices + 1

    median_price := sum_prices / num_prices

// Reset variables at the start of each day
if (dayofweek != dayofweek[1])
    total_entry_price := 0.0
    total_signals := 0

//table colors
borders_col = color.new(color.black, 90)
top_row_col = color.new(color.gray, 90)
size = input.string(defval='Normal', options=['Tiny', 'Small', 'Normal', 'Large'], title='Table size', inline='design', group='Table Design')
table_size = size == 'Tiny' ? size.tiny : size == 'Small' ? size.small : size == 'Normal' ? size.normal : size == 'Large' ? size.large : na

var tablee = table.new(position=position.top_right, columns=2, rows=3, frame_color=borders_col, frame_width=4, border_color=borders_col, border_width=4)

table.cell(tablee, 0, 0, "Average Entry Price", bgcolor=top_row_col, text_color=color.white, text_size=table_size)
table.cell(tablee, 1, 0, str.tostring(avg_entry_price, '#.##'), text_color=color.white, text_size=table_size)
table.cell(tablee, 0, 1, "Median Price", bgcolor=top_row_col, text_color=color.white, text_size=table_size)
table.cell(tablee, 1, 1, str.tostring(median_price, '#.##'), text_color=color.white, text_size=table_size)
table.cell(tablee, 0, 2, "Remaining Capital", bgcolor=top_row_col, text_color=color.white, text_size=table_size)
table.cell(tablee, 1, 2, str.tostring(remaining_capital, '#.##'), text_color=color.white, text_size=table_size)