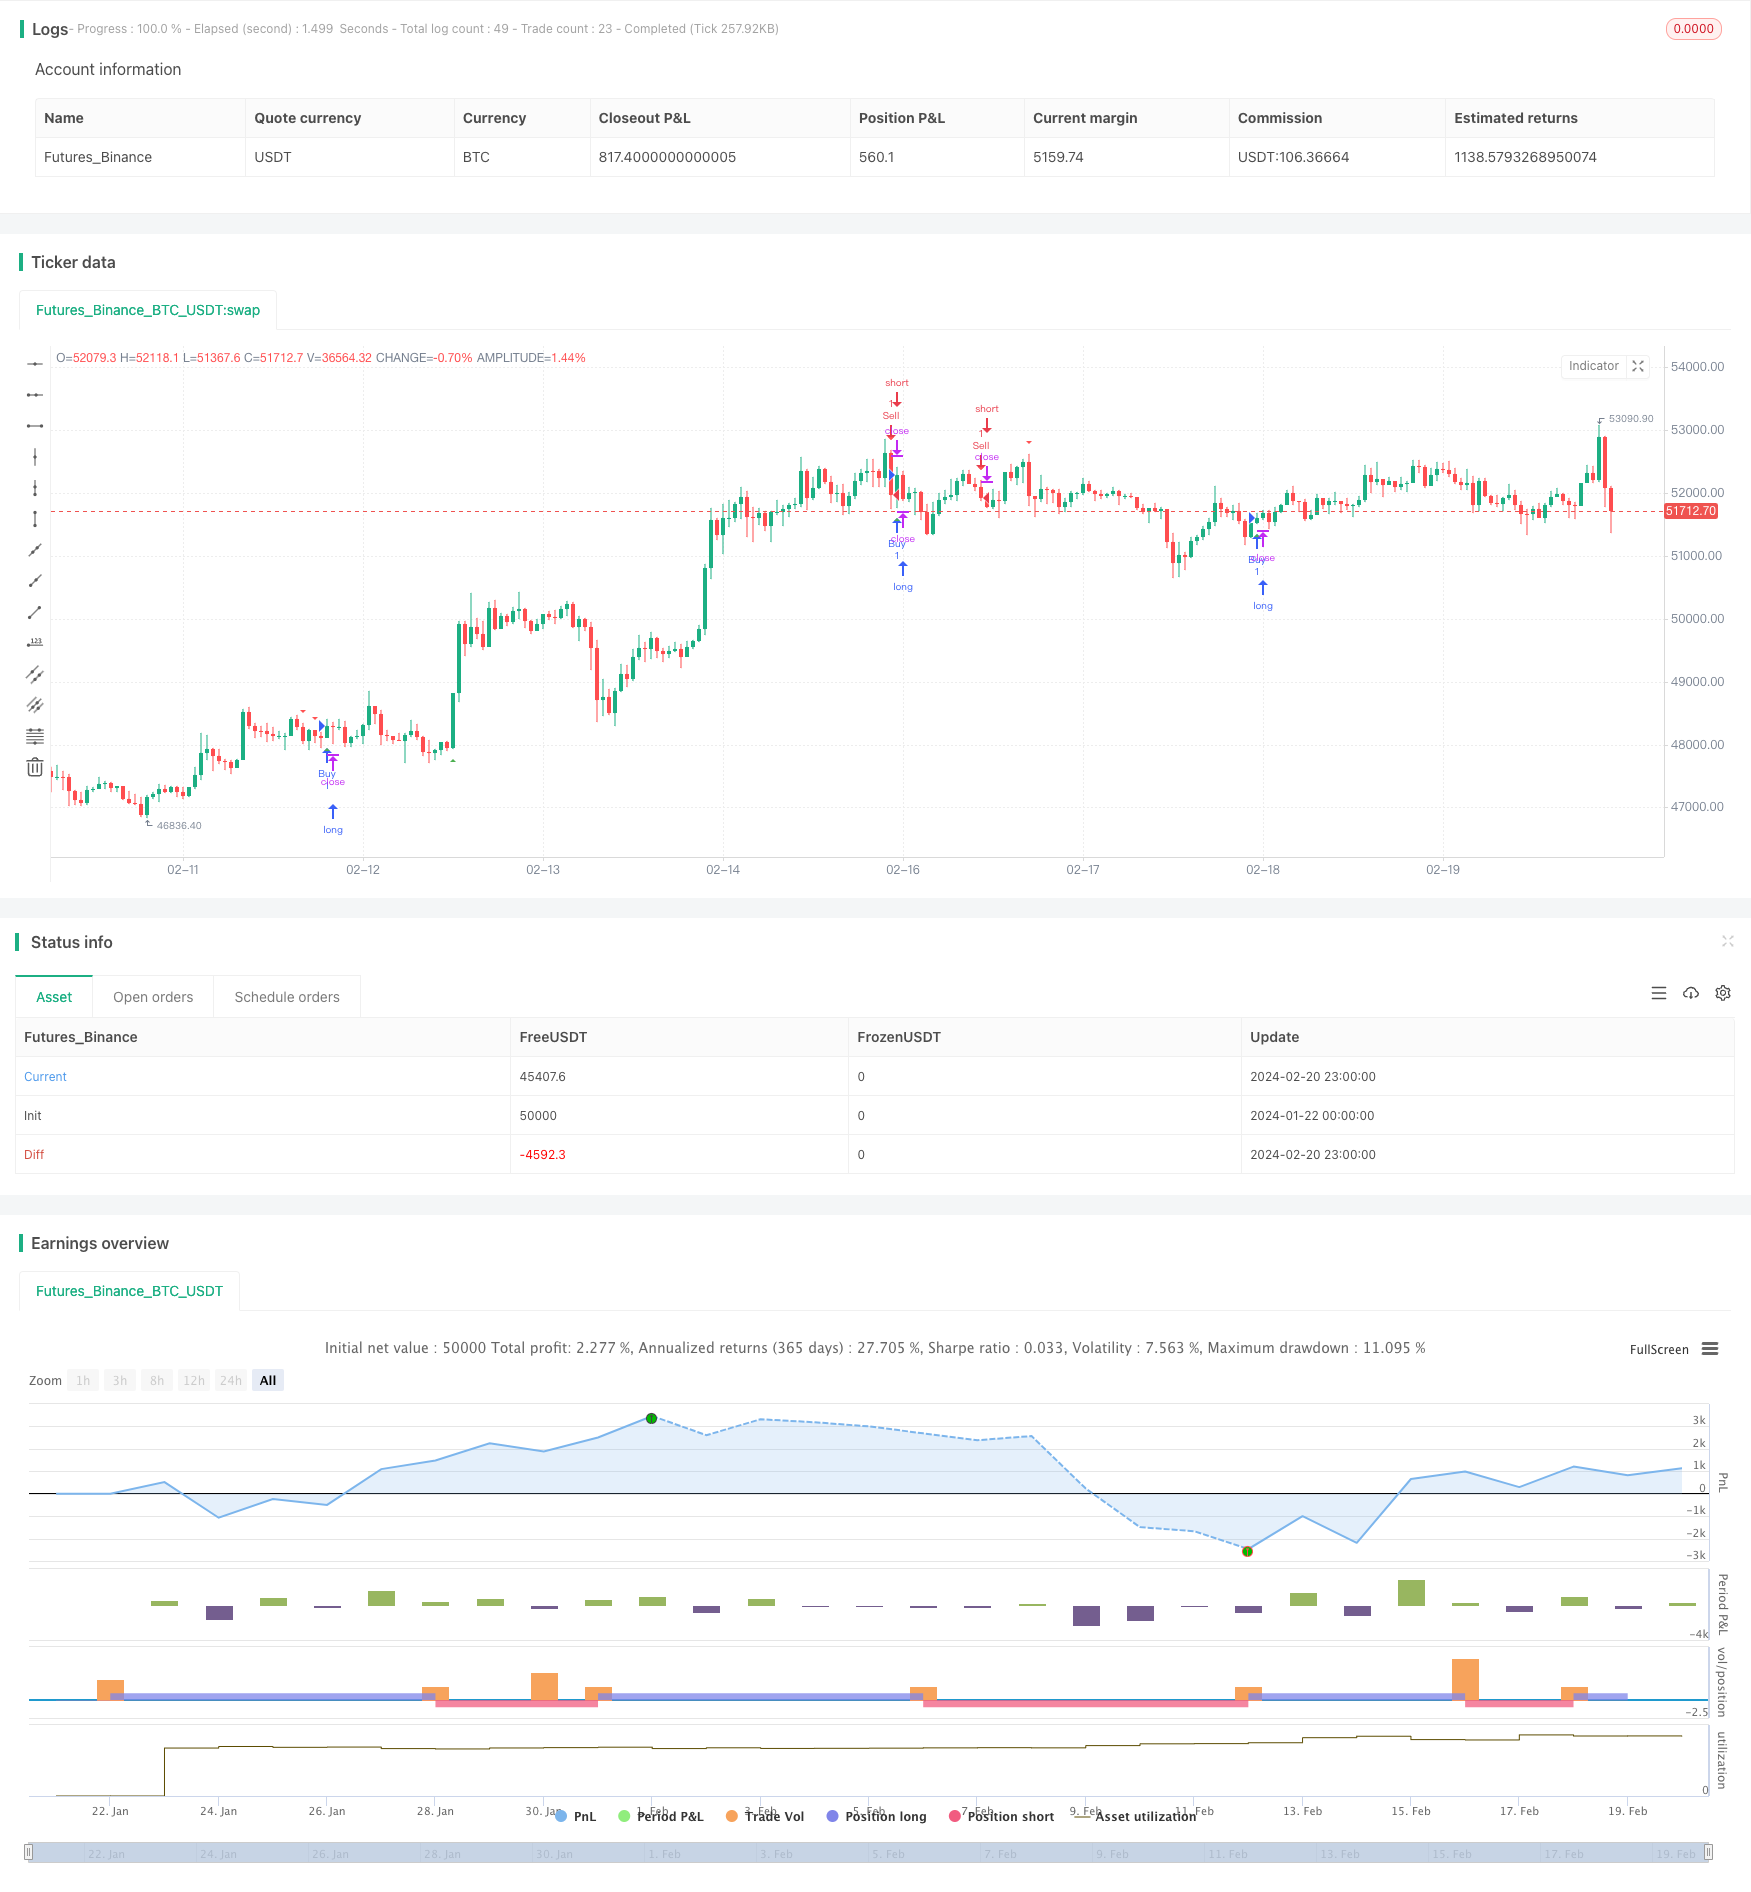
双重トレンドライン ブレイクゴールデンクロス デスクロストレンド 戦略をフォロー
作者: リン・ハーンチャオチャン,日付: 2024-02-22 16:01:12タグ:

概要
ダブルトレンドラインブレイクゴールデンクロスデスクロストレンドフォロー戦略は,トレンドフォローのための代替信号としてサポート/レジスタンストレンドラインと移動平均の両方を利用する定量的な取引戦略である.この戦略は,中長期トレンドを追跡する利益目標のために,トレンドインジケーターからのゴールデンクロスとデスクロス信号と主要なサポートとレジスタンスレベルを通じてブレイクシグナルを組み合わせ,異なるタイムフレームでの価格レベルを考慮する.
戦略原則
この戦略は4つの主要要素で構成されています.
- 過去30日間の最低値とグラフ化されたサポートライン
- 過去30週間の最高値を示した抵抗線
- 取引信号のフィルタリングの傾向を確認するために使用される10期間の単純な移動平均値
- 価格が重要なサポート/レジスタンスレベルを突破したときの取引機会を検出するためのブレークアウト識別モジュール
具体的には,この戦略は,まず,過去30日および30週間の最高値と最低値を取得するためにセキュリティリクエスト関数を使用し,動的なサポートとレジスタンスラインをプロットします.その後,10期SMAからの黄金十字と死亡十字信号を組み合わせてブレイクチャンスをフィルタリングします.価格が30日サポートレベルと10期SMAを超えるとロング信号が生成され,価格が30週間のレジスタンスレベルと10期SMAを下回るとショート信号が生成されます.
この戦略は,中期および長期間のサポート/レジスタンスレベルの両方を考慮し,より大きなトレンド機会を把握することを可能にします.移動平均フィルターを使用すると,トレンドの範囲中に誤った信号を効果的に回避できます.
利点分析
この戦略の主な利点は以下の通りである.
- 中期と長期間のサポート/レジスタンスの両方を活用して,より大きなブレイクを捕捉します.
- MAフィルターは,変動市場における誤った信号を回避することで損失を制御します.
- サポート/レジスタンスレベルを動的に更新することで,新しいトレンドの方向性を及時に把握できます.
- ストップ・ロスのリスク管理メカニズムは 利益を確保するのに役立ちます
リスク分析
この戦略には注意すべきリスクもあります.
- ブレイクアウト戦略には 精確なタイミングが必要で 超越や遅れの問題もあります
- サポート/レジスタンスレベルが失敗すると 不正のブレイクが発生し,大きな損失を引き起こす.
- 移動平均値の遅延は,トレンド逆転の遅い信号を引き起こす可能性があります.
- 借入リスクが高いため 小規模な口座には適していません
解決策:
- 突破識別ロジックを調整し フィルターを追加します
- 傾向が安定した後にしかシグナルが表示されないように,より長いMA期間を使用する.
- シングルトレードでダウンサイドを制限するために適切なストップ・ロスのレベルを設定します.
オプティマイゼーションの方向性
さらに改善の余地があります.
- ATRのような波動度計を導入して スマートなストップ・ロストと 利益拡大を図ります
- サポート/レジスタンス障害を検出するための機械学習モデルを追加します.
- 逆転の速さを把握するために 順応性移動平均を活用する
- 細かな調節パラメータを 異なる製品に合わせる
結論
ダブルトレンドラインブレイクゴールデンクロスデスクロストレンドフォロー戦略は,主要なトレンド中に収益性のシグナルをフィルタリングするために,中長期間のサポート/レジスタンスと移動平均指標を効果的に組み合わせ,比較的成熟した定量的な取引戦略となっています.ストップ損失メカニズム,適応パラメータなどを通じて最適化するにはまだ大きな余地があります.機械学習を組み込むことで,その強度も高めることができます.
/*backtest
start: 2024-01-22 00:00:00
end: 2024-02-21 00:00:00
period: 1h
basePeriod: 15m
exchanges: [{"eid":"Futures_Binance","currency":"BTC_USDT"}]
*/

// This Pine Script™ code is subject to the terms of the Mozilla Public License 2.0 at https://mozilla.org/MPL/2.0/
// © neosaid

//@version=5
strategy("Support and resistant Strategy", overlay=true)

// Function to check for breakout
f_breakoutCondition(closingPrice, highestHigh, lowestLow) =>
    closingPrice > highestHigh or closingPrice < lowestLow

// Step 1: 30 Days Trend Line (Lower Lows)
low30Days = request.security(syminfo.tickerid, "D", low)

// Step 2: 30 Weeks Upper Trend Line (Higher Highs)
high30Weeks = request.security(syminfo.tickerid, "W", high)

// Step 3: Trend Line for Lowest Low within the Last Month
var float lowestLowLastMonth = na
for i = 0 to 29
    lowestLowLastMonth := na(lowestLowLastMonth) ? low[i] : math.min(lowestLowLastMonth, low[i])

lowestLowLastMonthValue = lowestLowLastMonth[1]

// Breakout Strategy
highestHighLast3Candles = request.security(syminfo.tickerid, "D", ta.highest(close, 3))
lowestLowLast3Candles = request.security(syminfo.tickerid, "D", ta.lowest(close, 3))

// Additional conditions to filter signals
buyCondition = f_breakoutCondition(close, highestHighLast3Candles, lowestLowLast3Candles) and close > low30Days

sellCondition = f_breakoutCondition(close, highestHighLast3Candles, lowestLowLast3Candles) and close < high30Weeks

// Additional filters to reduce the number of orders
buyFilter = ta.crossover(close, ta.sma(close, 10)) // Buy only when price crosses above a 10-period SMA
sellFilter = ta.crossunder(close, ta.sma(close, 10)) // Sell only when price crosses below a 10-period SMA

buyCondition := buyCondition and buyFilter
sellCondition := sellCondition and sellFilter

// Plot Buy and Sell signals on the chart
plotshape(series=buyCondition, title="Buy Signal", color=color.green, style=shape.triangleup, location=location.belowbar)
plotshape(series=sellCondition, title="Sell Signal", color=color.red, style=shape.triangledown, location=location.abovebar)

// Strategy entries
strategy.entry("Buy", strategy.long, when = buyCondition)
strategy.entry("Sell", strategy.short, when = sellCondition)
- 移動平均のクロスオーバー取引戦略
- 移動平均のクロスオーバー金取引戦略
- EMAとMACDのトレンド 戦略をフォローする
- 移動平均クロスオーバーMACD取引戦略
- スーパートレンド・デイリー・リバース・戦略
- 双重EMAクロスオーバー戦略
- RSIとZigZag指標に基づくトレンド追跡戦略
- 移動平均のクロスオーバーブレイク戦略
- モメントブレイクバックテスト サポート抵抗戦略
- MyQuant トレンド識別子戦略
- サポートとレジスタンスレベルを伴うダイナミックなポジション調整に基づいたニフティ50量的な取引戦略
- 動的チャネル移動平均トレンド追跡戦略
- ハーモニック・ダブル・システム戦略
- ブレイクバック・コールバック・ロング・戦略
- 短期および長期移動平均のクロスオーバーに基づいたMAクロスオーバー取引戦略
- 2つの移動平均のクロスオーバー MACD量的な戦略
- 2つの移動平均圧力反発戦略
- 4つのWMAトレンド追跡戦略
- ナダラヤ・ワトソン回帰とATRチャンネルに基づく戦略の傾向
- 移動平均のクロスオーバーに基づくトレンド追跡戦略