RSI - 구매 판매 신호
저자:차오장, 날짜: 2022-05-09 14:35:23태그:RSI
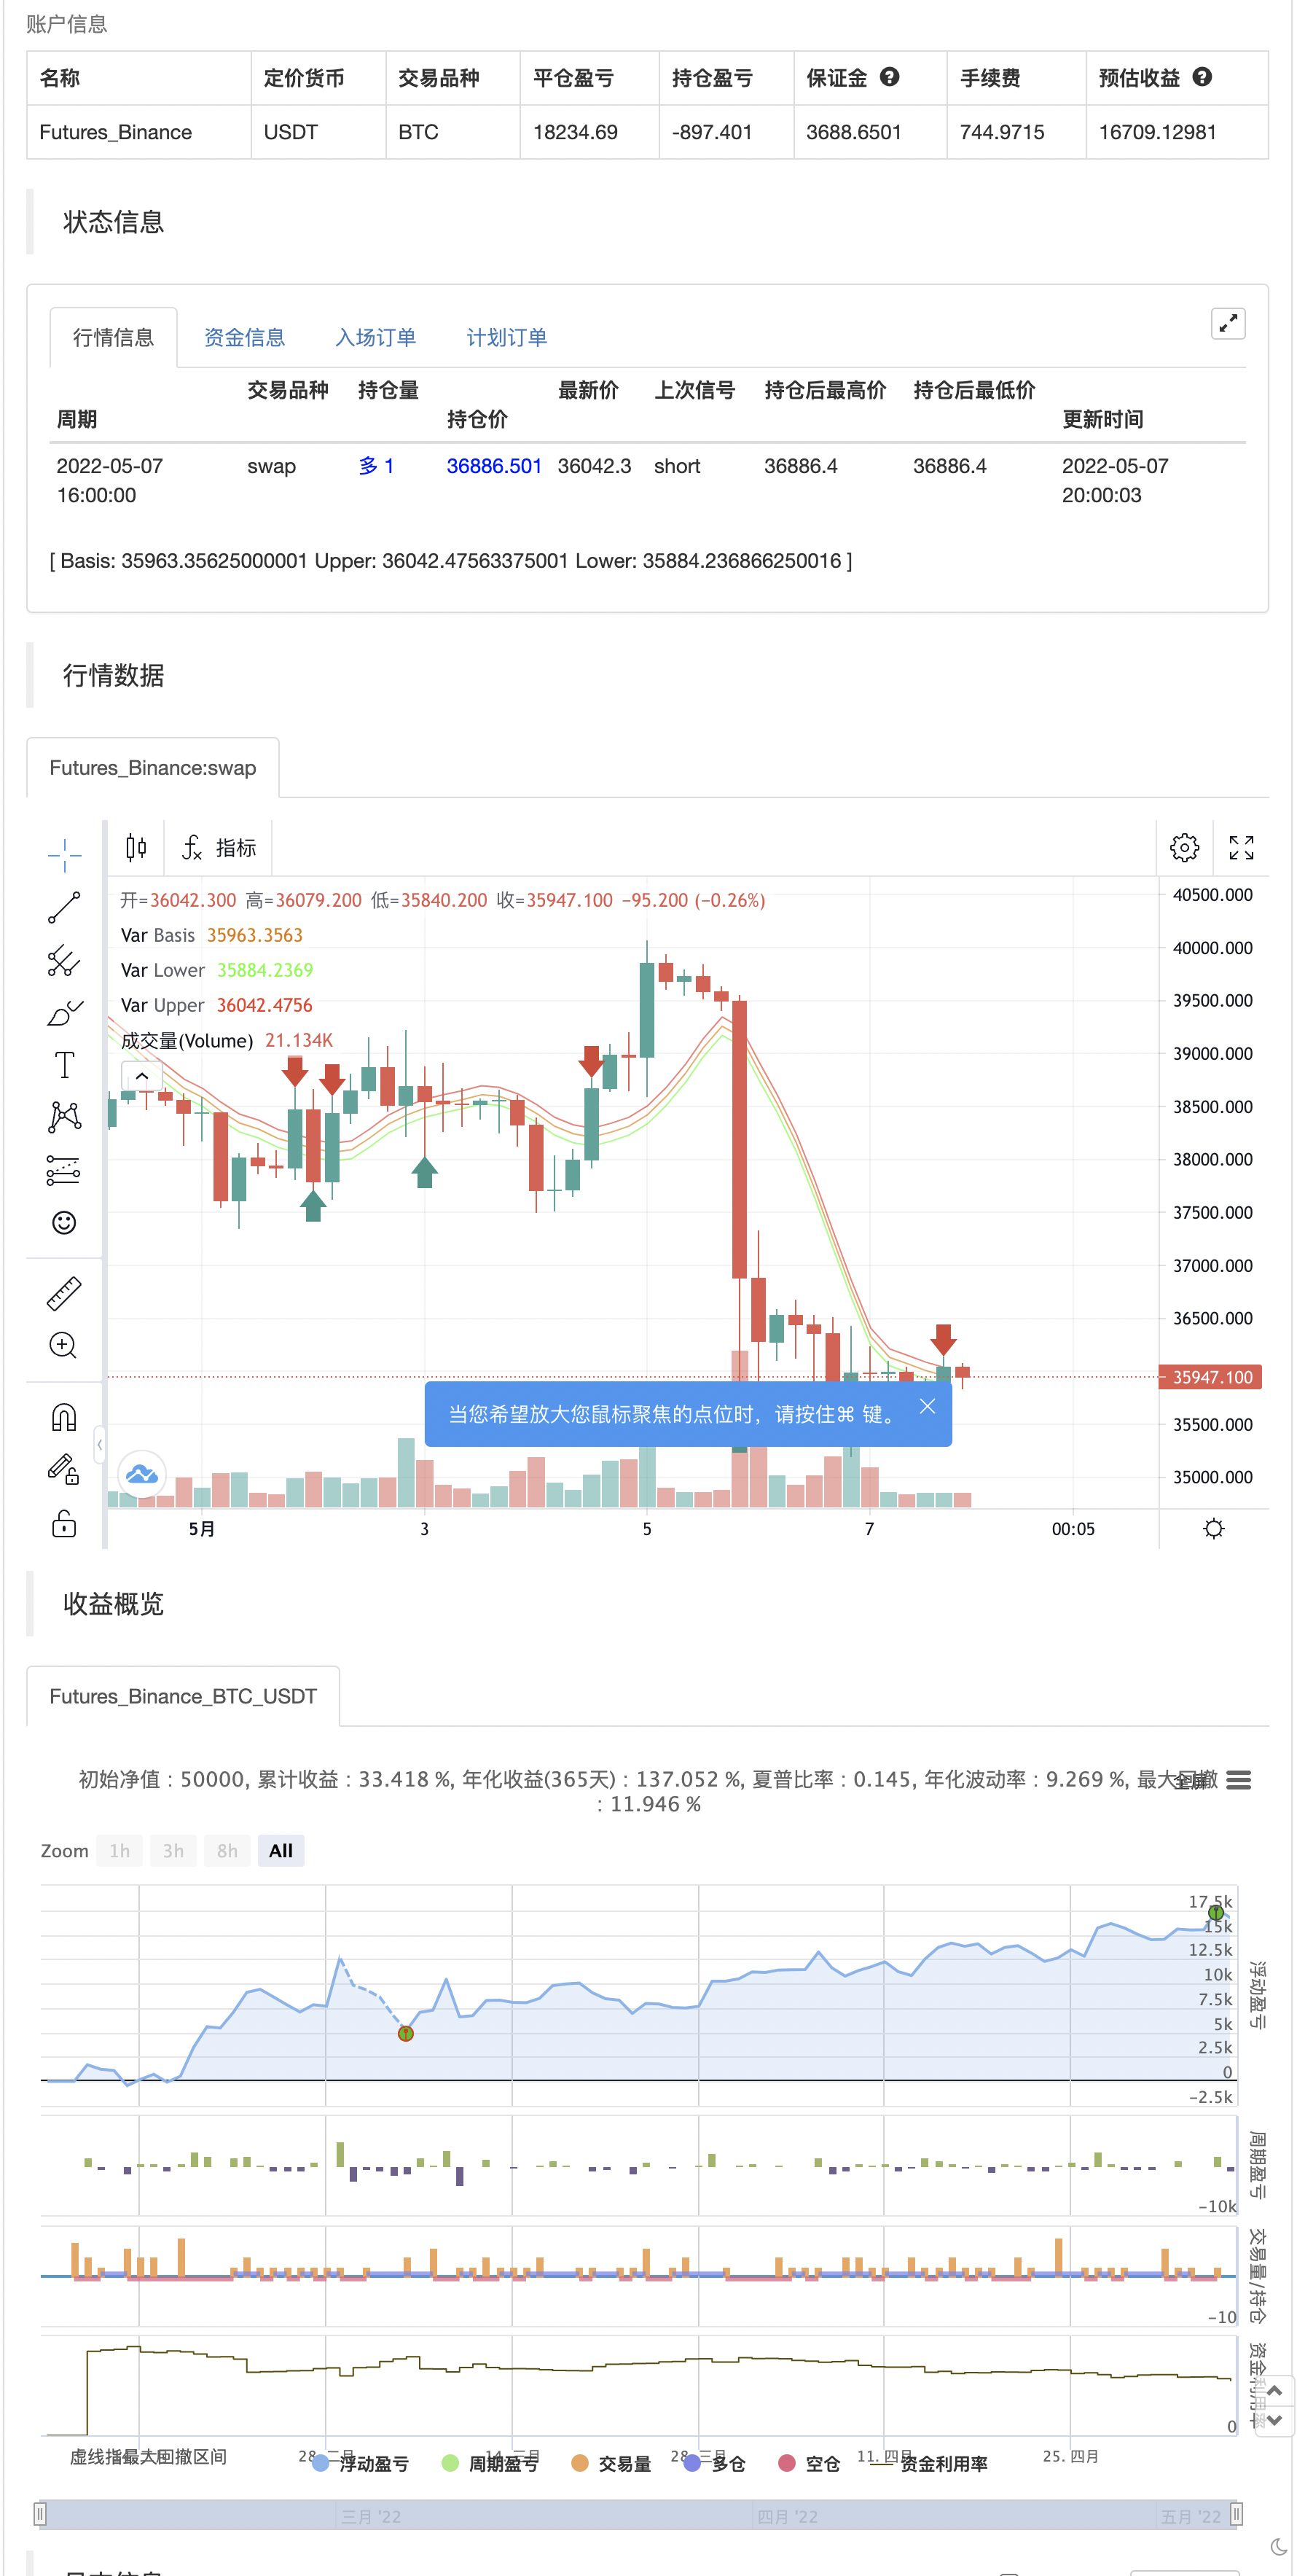
이 지표는 주로 과잉 구매와 과잉 판매를 기반으로 합니다. 단기 거래의 지표입니다. 이 방법으로 작은 하지만 수용 가능한 신호를 얻을 수 있습니다. 이 지표의 주요 기초는 다음과 같습니다. 구매하기 위해, 지표는 기기가 RSI 관점에서 과잉 판매 될 때까지 기다립니다. 그 다음, 차트가 엔벨로프 지표의 하단선을 아래에서 위로 넘으면 구매 신호가 발송됩니다. 판매를 위해, 지표는 RSI 관점에서 상품이 과잉 매입 될 때까지 기다립니다. 그 다음, 차트가 앙벨로프 지표의 상줄을 위에서 아래로 넘으면 판매 신호가 발송됩니다. 일반적인 기초는 가격과 RSI 지표의 일치입니다. 제가 직접 만든 최고의 설정입니다. 시간: 15분 과잉 구매: 80 오버셀: 25 RSI 길이: 8 다른 기기에서 할 수 있습니다. 하지만 항상 이익과 손실 한도를 설정합니다. (이 지표의 이익/손실 비율은 1: 1이 될 수 있습니다.)
배제책: 제공 된 정보 및 거래 지표 및 도구는 증권 구매 또는 판매를 위한 제안 또는 제안 요청으로 해석되어서는 안됩니다. 귀하가 결정하는 모든 투자 결정에 대해 전적으로 책임을 져야 하며 이러한 결정은 귀하의 재무 상황, 투자 목표, 위험 용도 및 유동성 필요에 대한 귀하의 평가에만 기초합니다. 나는 이 지표에 포함 된 정보의 적용으로 인해 발생할 수 있는 수익, 재정적 개선, 손실 또는 손해, 금전적 또는 기타에 대해 책임을 지지 않습니다. 개인 거래자는 개별 거래자에게 적합하고 사용할 수있는 기능과 기능을 나타내는지 결정하기 위해 특징 거래 지표, 다른 거래 도구, 웹 세미나 및 기타 교육 자료를 분석하는 데 자신의 과감한 노력을 사용해야합니다.
백테스트

/*backtest
start: 2022-02-08 00:00:00
end: 2022-05-08 00:00:00
period: 4h
basePeriod: 15m
exchanges: [{"eid":"Futures_Binance","currency":"BTC_USDT"}]
*/

// This source code is subject to the terms of the Mozilla Public License 2.0 at https://mozilla.org/MPL/2.0/
// © Saleh_Toodarvari

//@version=5
indicator(title="ENVELOPE - RSI - Buy Sell Signals", shorttitle="ENVELOPE - RSI", overlay=true)
//_________________Envelope_________________
len = input.int(8, title="Envelope Length", minval=1, group="Envelope Settings")
percent = input(0.22,title="Envelope Percent", group="Envelope Settings")
src = input(hl2, title="Envelope Source", group="Envelope Settings")
exponential = input(false)
basis = exponential ? ta.ema(src, len) : ta.sma(src, len)
k = percent/100.0
upper = basis * (1 + k)
lower = basis * (1 - k)
plot(basis, "Basis", color=#ED7300)
u = plot(upper, "Upper", color=#FF2424)
l = plot(lower, "Lower", color=#24FF24)
//fill(u, l, color=color.rgb(33, 150, 243, 95), title="Background")
cross_buy=ta.crossover(close,lower)
cross_sell=ta.crossunder(close,upper)
// _________________RSI_________________
rsiLengthInput = input.int(8, minval=1, title="RSI Length", group="RSI Settings")
rsiSourceInput = input.source(hl2, "RSI Source", group="RSI Settings")
up = ta.rma(math.max(ta.change(rsiSourceInput), 0), rsiLengthInput)
down = ta.rma(-math.min(ta.change(rsiSourceInput), 0), rsiLengthInput)
rsi = down == 0 ? 100 : up == 0 ? 0 : 100 - (100 / (1 + up / down))
Overbought_RSI = input(title="RSI OverBought Limit(Recommended: 70-85)", defval=80, group="RSI Settings")
Oversold_RSI = input(title="RSI OverSold Limit(Recommended: 20-30)", defval=25, group="RSI Settings")
condition_buy= rsi<Oversold_RSI and (ta.cross(low,lower) or ta.cross(close,lower) or ta.cross(high,lower) or ta.cross(open,lower))
condition_sell= rsi>Overbought_RSI and (ta.cross(low,upper) or ta.cross(close,upper) or ta.cross(high,upper) or ta.cross(open,upper))
if cross_sell
    strategy.entry("Enter Long", strategy.long)
else if cross_buy
    strategy.entry("Enter Short", strategy.short)

// plotshape(cross_sell ? condition_sell:na, title="Sell Label", text="Sell", location=location.abovebar, style=shape.labeldown, size=size.tiny, color=color.red, textcolor=color.white)
// sell_sig=plot(cross_sell ? high:na,color=color.new(#000000,100))
// plotshape(cross_buy ? condition_buy:na, title="Buy Label", text="Buy", location=location.belowbar, style=shape.labelup, size=size.tiny, color=color.green, textcolor=color.white)
// buy_sig=plot(cross_buy ? ohlc4:na,color=color.new(#000000,100))
// tpColor = if(cross_sell[1] or cross_sell[2] or cross_buy[1] or cross_buy[2])
//     color.new(#1DBC60, 30)
// else
//     color.new(#000000,100)
// slColor = if(cross_sell[1] or cross_sell[2] or cross_buy[1] or cross_buy[2])
//     color.new(#F74A58, 30)
// else
//     color.new(#000000,100)
// //_________________TP&SL_________________
// TP_Percent = input.float(0.15, "TP %")
// SL_Percent = input.float(0.15, "SL %")
// tp= if condition_sell
//     ohlc4-ohlc4*(TP_Percent/100)
// else if condition_buy
//     ohlc4+ohlc4*(TP_Percent/100)
// sl= if condition_sell
//     ohlc4+ohlc4*(SL_Percent/100)
// else if condition_buy
//     ohlc4-ohlc4*(SL_Percent/100)
// tp_sig=plot(tp,color=color.new(#000000,100),title="tp")
// sl_sig=plot(sl,color=color.new(#000000,100),title="tp")
// lower_plot=plot(lower,color=color.new(#000000,100))
// fill(sell_sig,tp_sig, color=tpColor)
// fill(buy_sig,tp_sig, color=tpColor)
// fill(buy_sig,sl_sig, color=slColor)
// fill(sell_sig,sl_sig, color=slColor)
- 이중 지표 동력 트렌드 정량화 전략 시스템
- 쌍평선-RSI 다중 신호 트렌드 거래 전략
- 다이내스 트레이딩 최적화 전략, RSI 동력 지표와 결합한 동력 유선 시스템
- 다중 기술 지표 횡단 동력 트렌드 추적 전략
- 동적 조정 스톱 손실 코끼리 기둥 모양 트렌드 추적 전략
- 쌍주기 RSI 추세 동력 강도 전략 피라미드 포지션 관리 시스템
- 다일리얼 크로스 보조 RSI 동적 매개 변수 정량화 거래 전략
- 동적 추세는 RSI의 교차 전략을 결정합니다.
- 다차원 K 근접 알고리즘과
타이 형태의 양적 가격 분석 거래 전략 - 적응형 다전략 동적 스위치 시스템: 융합 트렌드 추적과 구간 격변에 대한 양적 거래 전략
- 다 지표 다 차원 트렌드 크로스 고급 정량화 전략
- 미다스 Mk. II - 최고의 암호화 스윙
- TMA-레거시
- TV의 높고 낮은 전략
- 가장 좋은 트레이딩 뷰 전략
- 빅 스냅퍼 경고 R3.0 + Chaiking 변동성 상태 + TP RSI
데 크롤 스톱 - CCI + EMA와 RSI 크로스 전략
- EMA 대역 + leledc + Bollinger 대역 트렌드 포스팅 전략
- RSI MTF Ob+Os
- MACD 위일리 전략
- 하이킨-아시 추세
- HA 시장 편견
- 이치모쿠 클라우드 매끄러운 오시레이터
- 윌리엄스 %R - 부드럽다
- QQE MOD + SSL 하이브리드 + 와다 아타르 폭발
- Strat를 구매/판매
- EMA와 ADX와 함께 트리플 슈퍼트렌드
- 톰 데마크 연속 열 지도
- jma + dwma 다 곡물
- 매직 MACD