HODL 라인
저자:차오장, 날짜: 2022-05-20 16:58:28태그:HMA
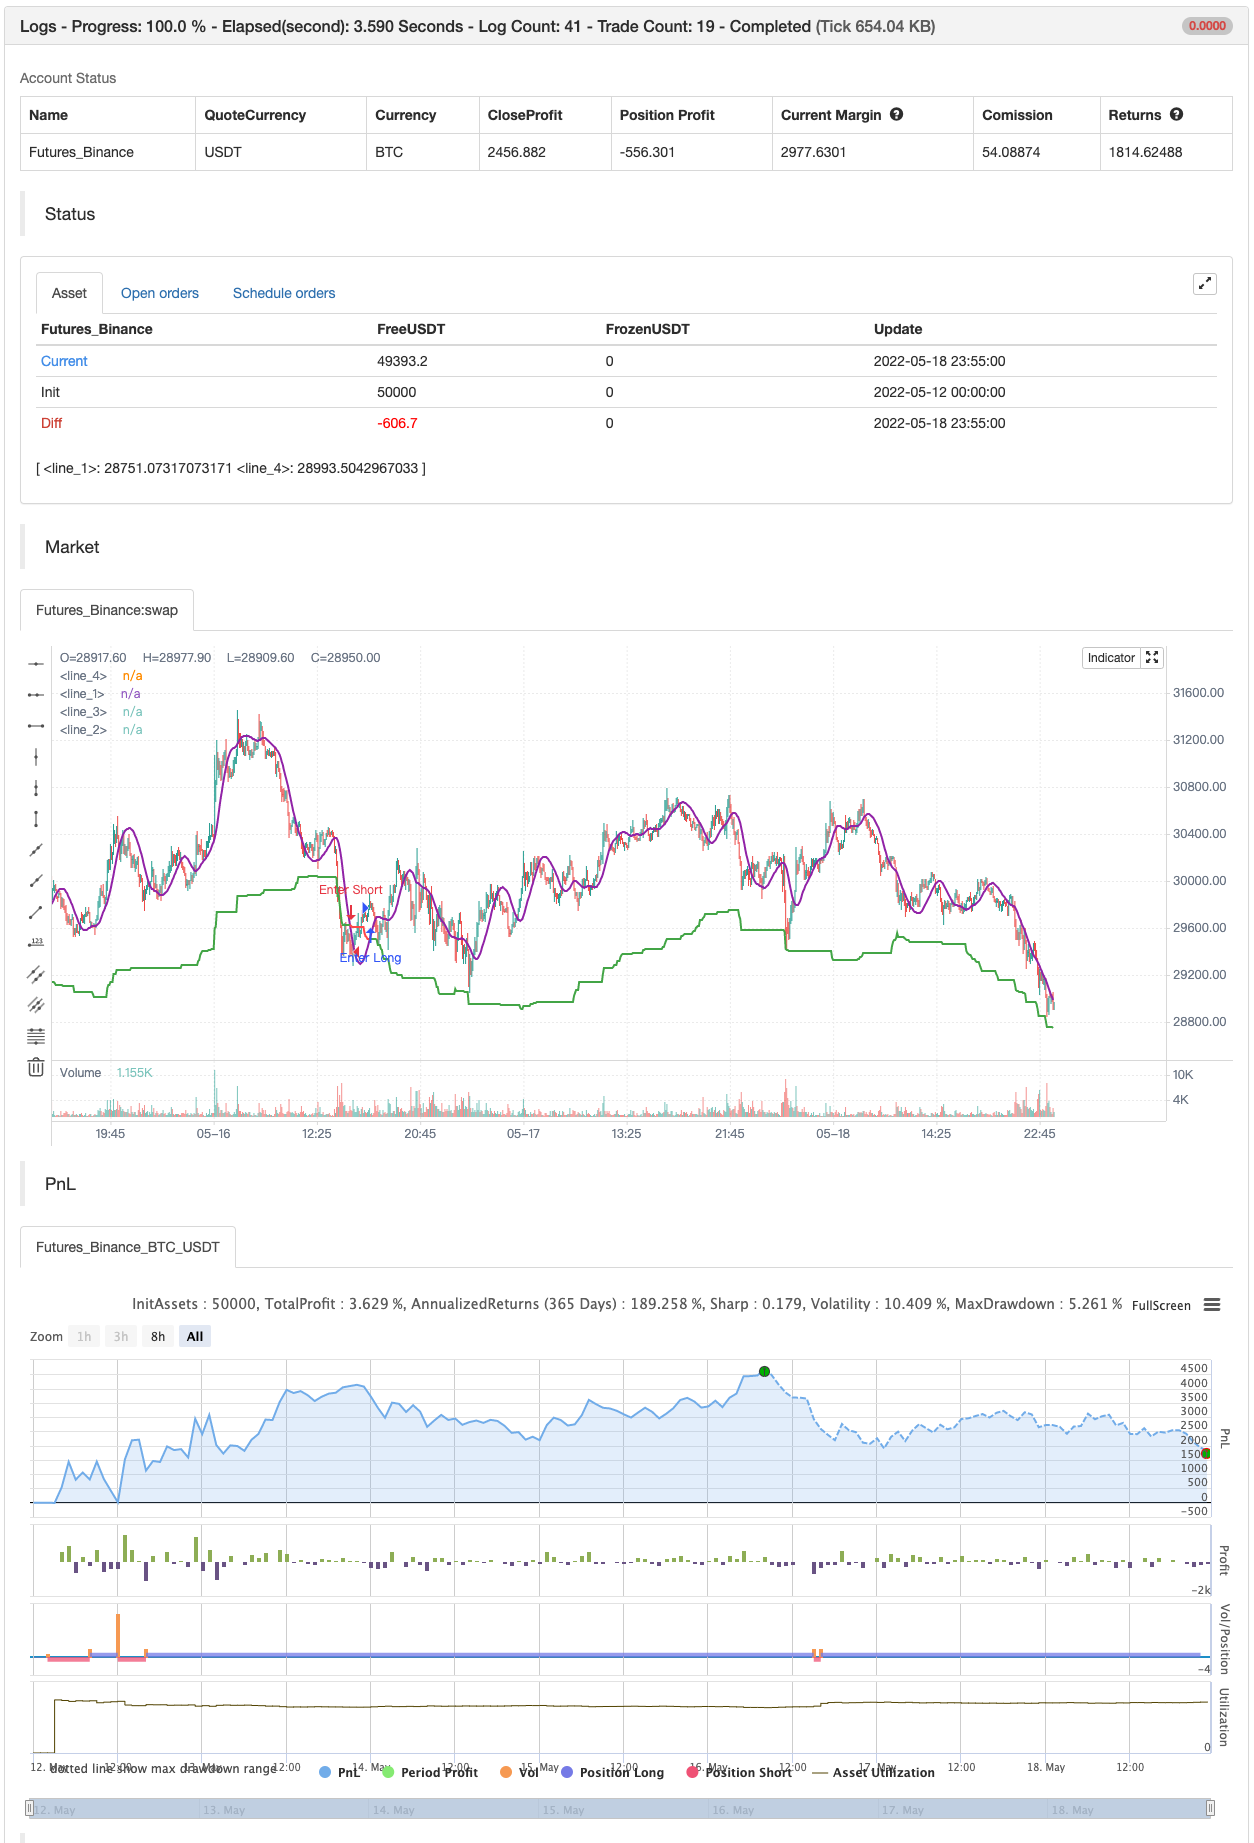
이 지표는 바이 앤 홀드 투자자가 자산을 보유 할 수있는 황소 시장 기간과 보유를 피해야 할 곰 시장 기간을 결정합니다. 주로 암호화폐를 염두에 두고 설계되었지만 모든 시장에서 성공적으로 사용할 수 있습니다. 기술적으로, 지표는 시장 매출이 상승 추세보다 급격하다는 사실을 고려하는 비대칭 트렌드 필터입니다. 알고리즘은 가격 평형화와 없이 두 가지 제도를 가지고 있습니다.
사용 방법 단계 모양의 선은 주요 트렌드 필터입니다. 상승 추세에서 녹색, 하락 추세에서 빨간색입니다. 평형이 켜졌을 때, 트렌드 필터 외에도 지표는 보라색 선을 그려냅니다. 그것은 가격의 허스 이동 평균 (HMA) 입니다. 이 경우 지표는 트렌드 필터와 교차점을 찾기 위해 가격 대신 이 선을 사용합니다. 가격 또는 매끄러운 선이 위의 트렌드 필터를 통과하면 상승세 신호입니다. 지표는 녹색 원으로 그러한 교차를 표시합니다. 또한 상승세에서 차트 배경을 녹색으로 칠합니다. 아래의 트렌드 필터를 통과하는 가격 또는 보라색 선은 하락세 신호를 의미합니다. 하락세 신호는 빨간색 원으로 표시됩니다. 하락세에서 차트 배경은 빨간색으로 변합니다.
설정
감수성
백테스트

/*backtest
start: 2022-05-12 00:00:00
end: 2022-05-18 23:59:00
period: 5m
basePeriod: 1m
exchanges: [{"eid":"Futures_Binance","currency":"BTC_USDT"}]
*/

// This source code is subject to the terms of the Mozilla Public License 2.0 at https://mozilla.org/MPL/2.0/
// © AstrideUnicorn

// Asymmetrical Trend Filter aka HODL Line

//@version=5
indicator("HODL LINE", overlay=true)

// initialize indicator period parameter and the asymmetry paramter
length = 300
asymmetry =  0.05 //input.float(defval=0.05,step=0.01, minval=0.01, maxval=0.3)

// script inputs
sensitivity = input.string(defval="Hold Short Term", title="Sensitivity", options=['Super Sensitive','Hold Short Term', 'Hold Medium Term', 'Hold Long Term'])
use_smoothing = input.bool(defval=true, title="Use Smoothing")


// Set the indicator period based on the choosen sensitivity
if sensitivity == 'Super Sensitive'
    length:=50

if sensitivity == 'Hold Short Term'
    length:=100

if sensitivity == 'Hold Medium Term'
    length:=300

if sensitivity == 'Hold Long Term'
    length:=500

// Calculate HODL Line - an assymetric trend filter
HODL_line = (ta.highest(close,length) + ta.lowest(close,length))/(2.0 + asymmetry)

// Calculate smoothed price time series
smoothed_price = ta.hma(close,50)

// Use closing price or smoothed price based on the choosen option for smoothing
price_model = use_smoothing ? smoothed_price : close

// Define conditional color for the HODL Line
hodl_line_color = price_model >= HODL_line ? color.green : color.red

// define the HODL Line crossing conditions
crossing_condition_bull = ta.crossover(price_model, HODL_line)
crossing_condition_bear = ta.crossunder(price_model, HODL_line)

// plotting
plot(HODL_line, color = hodl_line_color, linewidth = 2)

plot(crossing_condition_bull?HODL_line:na, color = color.new(color.green,40), style= plot.style_circles, linewidth = 20)
plot(crossing_condition_bear?HODL_line:na, color = color.new(color.red,40), style= plot.style_circles, linewidth = 20)

bgcolor(color.new(hodl_line_color,80))

plot(use_smoothing?price_model:na, color=color.purple, linewidth=2)

if crossing_condition_bull
    strategy.entry("Enter Long", strategy.long)
else if crossing_condition_bear
    strategy.entry("Enter Short", strategy.short)
관련 내용
- 다중 지표 융합 동적 이동 평균 크로스 양화 전략
- 여러 시간 동안의 볼링거 동력 돌파 전략은 헐 평선 전략과 결합됩니다.
- 이중평균선 교차 결합 헐 이동평균량화 전략
- 헐 이동 평균에 기초한 반사형 EMA 트렌드 결정 전략
- 플렉서블 멀티 사이클 동선 교차 전략 고급 버전
- 적응 가격의 크로스 오브 라인 거래 전략
- 다중 지표 조합 동적 스톱 손실 트렌드 추적 전략
- HMA는 다주기 양적 거래 전략을 최적화하고 동적 중지 손실을 결합합니다.
- 고도의 복합 평균과 시장 동력 추세 포착 전략
- 다주기적 Hull 이동평균 교차 전략
- RSI와 MA의 조합 전략
더 많은 내용
논 엔트로피 V2 - 수퍼트렌드 ATR TRAILING STOP LOSS
- 부피 흐름 v3
- ma & rsi - ogcheckers와 함께 암호화 선물 시간 스칼핑
- ATR 평평화
- 주문 블록 검색어
- 트렌드 스칼프-프랙탈박스-3EMA
- QQE 신호
- U비트 격자 팽창 필터링
- CM MACD 사용자 지정 지표 - 여러 시간 프레임 - V2
- 2 이동 평균 색 방향 탐지
- Scalping PullBack 도구 R1
- 매수 전략은 AO+Stoch+RSI+ATR에 달려 있습니다.
- EMA 트렌드 클라우드
- RedK 부피 가속 방향 에너지 비율
- 돈치안 브레이크아웃
- 레드K 모멘텀 바
- 슈퍼 점프 턴 백 볼링거 밴드
- 후쿠이즈 트렌드
- 조니의 BOT