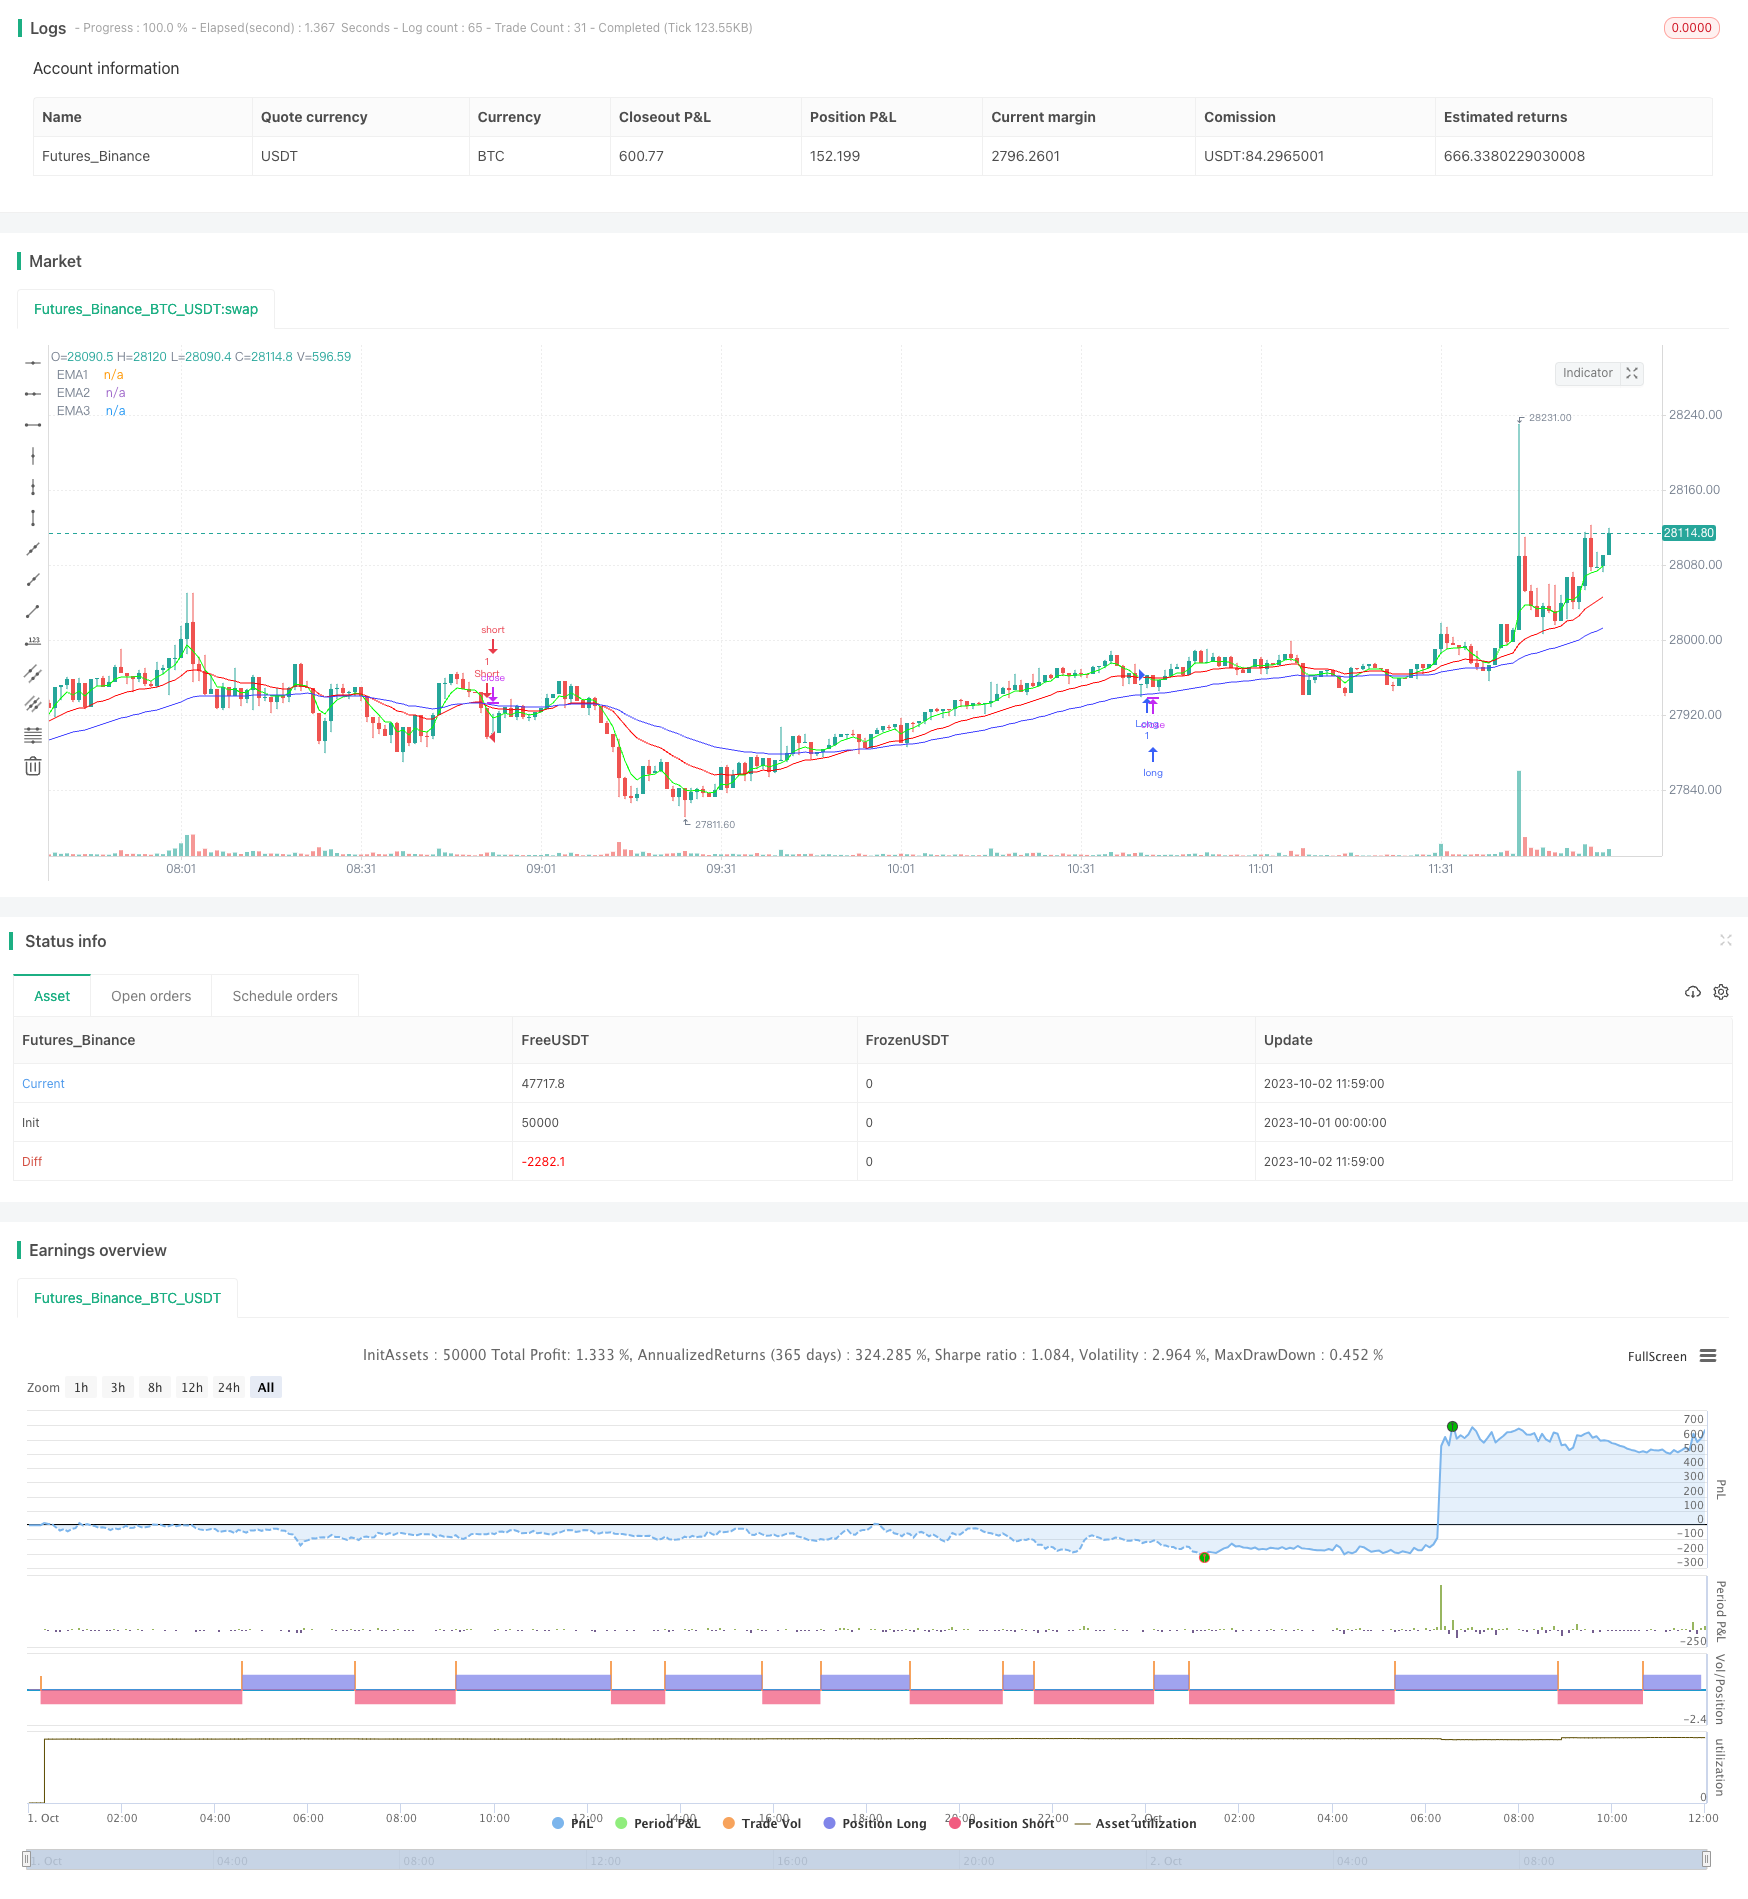
트리플 EMA와 후속 스톱 로스 전략
저자:차오장, 날짜: 2023-10-17 15:05:41태그:

전반적인 설명
이 전략은 전형적인 트리플 기하급수적 이동 평균 (EMA) 거래 시스템을 구현합니다. 빠른 5 일 EMA, 중간 20 일 EMA 및 느린 50 일 EMA를 비교하여 거래 신호를 생성합니다. 또한 가짜 신호를 필터하기 위해 이전 바와 비교하여 현재 바의 폐쇄 가격을 사용합니다. 또한 수익을 잠금하기 위해 후속 스톱 로스를 사용합니다.
원칙
5일 EMA가 20일 EMA를 넘어서고 3개의 EMA가 모두 상승률을 보이고 (5일 EMA > 20일 EMA > 50일 EMA) 현재의 마감률이 특정 지점의 이전 마감률보다 높을 때, 장차가 됩니다. 5일 EMA가 20일 EMA를 넘어서고 3개의 EMA가 모두 하향률을 보이고 (5일 EMA < 20일 EMA < 50일 EMA) 현재의 마감률이 특정 지점의 이전 마감률보다 낮을 때, 단차가 됩니다.
진입 후, 가격이 특정 틱을 실행 할 때, 더 큰 이익을 잠금하기 위해 가격 변동에 따라 중지 손실을 조정하기 위해 후속 스톱 손실이 시작됩니다.
장점
신호를 생성하기 위해 트리플 EMA를 사용하면 시장 소음을 효과적으로 필터하고 트렌드를 식별 할 수 있습니다. 빠른 EMA는 최신 변화를 반영하고, 중간 EMA는 트렌드 방향을 결정하고, 느린 EMA는 변동을 필터합니다.
현재 바
클로저를 이전 바 클로저와 비교하면 가짜 신호를 더 잘 필터링하고 불필요한 거래를 줄일 수 있습니다. 후속 스톱 로스는 가격 동작에 따라 스톱 로스를 동적으로 조정하여 수익 잠금을 극대화합니다.
이 전략의 유연한 매개 변수 설정은 매일부터 분자까지 다양한 제품과 시간 프레임에 최적화를 허용합니다.
위험성
빈번한 EMA 크로스오버는 다양한 시장에서 과도한 거래를 유발할 수 있으며 수수료와 미끄러짐으로 인한 비용을 증가시킬 수 있습니다.
트래일링 스톱 손실은 거대한 위프사우를 통해 트렌드를 조기에 종료 할 수 있습니다.
EMA 지연은 주요 전환점과 손실을 놓칠 수 있습니다.
EMA 기간, 후속 스톱 틱과 같은 매개 변수는 다른 제품과 시간 프레임에 최적화를 요구합니다.
개선 방향
MACD, KD와 같은 다른 지표를 통합하여 거래 신호를 필터합니다.
특정 제품 및 시간 프레임에 대한 매개 변수를 테스트하고 최적화하여 최상의 조합을 찾습니다.
인간 감독이나 기계 학습을 통해 파러미터를 동적으로 조정합니다.
특정 시장 조건에 따라 트레일링 스톱을 비활성화하고 풀 포지션을 유지하는 것을 고려하십시오.
간단한 트레일링 스톱 로스를 더 고급 자동 수익 취득 메커니즘으로 대체하십시오.
결론
이 전략은 EMA 크로스오버, 가격 브레이크아웃 및 트래일링 스톱 로스 (EMA crossover, price breakout, trailing stop loss) 라는 세 가지 일반적인 기술 분석 기법을 상당히 포괄적이고 견고한 트렌드 다음 거래 시스템으로 통합합니다. 매개 변수 최적화를 통해 다른 제품과 시간 프레임에 적응 할 수 있으며 강력한 트렌딩 시장에서 잘 수행합니다. 그러나 더 많은 시장 상황을 처리하기 위해 추가 최적화가 필요한 기술 분석 전략의 전형적인 약점도 있습니다. 전반적으로이 전략은 몇 가지 일반적인 전략 개념을 매우 잘 보여줌으로써 양적 거래에 대한 간단하고 실용적인 아이디어를 제공합니다.
/*backtest
start: 2023-10-01 00:00:00
end: 2023-10-02 12:00:00
period: 1m
basePeriod: 1m
exchanges: [{"eid":"Futures_Binance","currency":"BTC_USDT"}]
*/

// This source code is subject to the terms of the Mozilla Public License 2.0 at https://mozilla.org/MPL/2.0/
// © Matt Dearden - IndoPilot
// @version=4

/////////////////////////////////////////////////////// Initial Parameters ///////////////////////////////////////////////////////
SystemName = "Triple EMA Strategy"
ShortSystemName = "TEMA"
InitPosition = 0
InitCapital = 50000
InitCommission = 0.004 //approx value to compensate for Oanda spreads
InitPyramidMax = 0
CalcOnorderFills = true

strategy(title=SystemName, shorttitle=ShortSystemName, overlay=true, pyramiding=InitPyramidMax,
 default_qty_type=strategy.cash, default_qty_value=InitPosition, commission_type=strategy.commission.percent,
 commission_value=InitCommission, initial_capital=InitCapital, max_lines_count=500,
 max_labels_count=500, process_orders_on_close=false, calc_on_every_tick=false)

///////////////////////////////////////////////////////////// Inputs /////////////////////////////////////////////////////////////

DateFilter = input(false, "═════ Data Filtering ═════")
InitYear = input(title="Year", type=input.integer, defval=2021, minval=2000, maxval=2021)
InitMonth = input(title="Month (0=ALL)", type=input.integer, defval=0, minval=0, maxval=12)
InitStopLoss = input(title="Stop Loss (ticks)", type=input.integer, defval=100, minval=0, maxval=1000)
TrailingStopLoss = input(title="Trailing S/L (ticks)", type=input.integer, defval=130, minval=0, maxval=1000)
InitBuffer = input(title="Buffer (ticks)", type=input.integer, defval=15, minval=0, maxval=1000)
InitEMA1 = input(title="EMA 1", type=input.integer, defval=5, minval=0, maxval=1000)
InitEMA2 = input(title="EMA 2", type=input.integer, defval=20, minval=0, maxval=1000)
InitEMA3 = input(title="EMA 3", type=input.integer, defval=50, minval=0, maxval=1000)

//////////////////////////////////////////////////////////// Variables ///////////////////////////////////////////////////////////

var StopLoss = float(0.0)
var StartPrice = float(0.0)
//setup multipliers and catch JPY difference
Multiplier = syminfo.currency == "JPY" ? 10 : 1000
//get the daily exchange rate from yesterday
//X_rate = security(AccountCurrency+syminfo.currency, "D", close[1])
OrderQty = 1
Buffer = InitBuffer / (Multiplier * 100)

/////////////////////////////////////////////////////// Triple EMA Strategy //////////////////////////////////////////////////////

EMA1 = ema(close, InitEMA1)
EMA2= ema(close, InitEMA2)
EMA3 = ema(close, InitEMA3)

//entry conditions
longCondition = crossover(EMA1, EMA2) and close > EMA3 and EMA1 > EMA3 and EMA2 > EMA3 and close > (close[1] + Buffer)
shortCondition = crossunder(EMA1, EMA2) and close < EMA3 and EMA1 < EMA3 and EMA2 < EMA3 and close < (close[1] - Buffer)

/////////////////////////////////////////////////////// Trailing Stoploss ////////////////////////////////////////////////////////

if (strategy.position_size > 0 and (close > (StartPrice + (TrailingStopLoss / (100 * Multiplier)))))
    StopLoss := max(StopLoss, close - (TrailingStopLoss / (100 * Multiplier)))
    strategy.exit("Long Stoploss", "Long")

if (strategy.position_size < 0 and (close < (StartPrice - (InitStopLoss / (100 * Multiplier)))))
    StopLoss := min(StopLoss, close + (TrailingStopLoss / (100 * Multiplier)))
    strategy.exit("Short Stoploss", "Short")

///////////////////////////////////////////////////////// Setup entries /////////////////////////////////////////////////////////

if (longCondition)
    StartPrice := close
    StopLoss := StartPrice - (InitStopLoss / (100 * Multiplier))
    strategy.entry("Long", strategy.long, qty=OrderQty)
    strategy.exit("Long Stoploss", "Long")

if (shortCondition)
    StartPrice := close
    StopLoss := StartPrice + (InitStopLoss / (100 * Multiplier))
    strategy.entry("Short", strategy.short, qty=OrderQty)
    strategy.exit("Short Stoploss", "Short")

///////////////////////////////////////////////////////// Draw the EMAs /////////////////////////////////////////////////////////
plot(EMA1, "EMA1", color=#00FF00)
plot(EMA2, "EMA2", color=#FF0000)
plot(EMA3, "EMA3", color=#4040FF)
- MACD 트렌드 균형 전략
- EMA와 하이킨 아시 거래 전략
- 장기적 전략의 추세
- 다모델 촛불 패턴 조합 전략
- 채널 회전 거래 전략 분석
- 이중 지표 가벼운 반전 거래 전략
- 서프 라이더 전략
- 지표 통합에 기반한 모멘텀 추적 전략
- 헐크의 역전 전략
- 다중 요인 동적 돈 관리 전략
- 적응성 변동성 유한용량 요소 전략
- 트렌드 추적 네 가지 요소 전략
- 이중 이동 평균 역전 전략
- STC MA ATR 통합 트렌드 거래 전략
- 중증 상승 편향에 대한 특수 규칙과 함께 스토카스틱 RSI를 기반으로 한 황소 트렌드 라이딩 전략
- SMA 지표에 기초한 전략에 따른 중단기 동향
- 골드/실버 30m 트렌드 브레이크업 전략에 따라
- 적응 트렌드 추적 중지 손실 전략
- EMA 크로스오버와 베어 파워 지표에 기초한 단기 하향 전략
- 이중 EMA 크로스오버 거래 전략