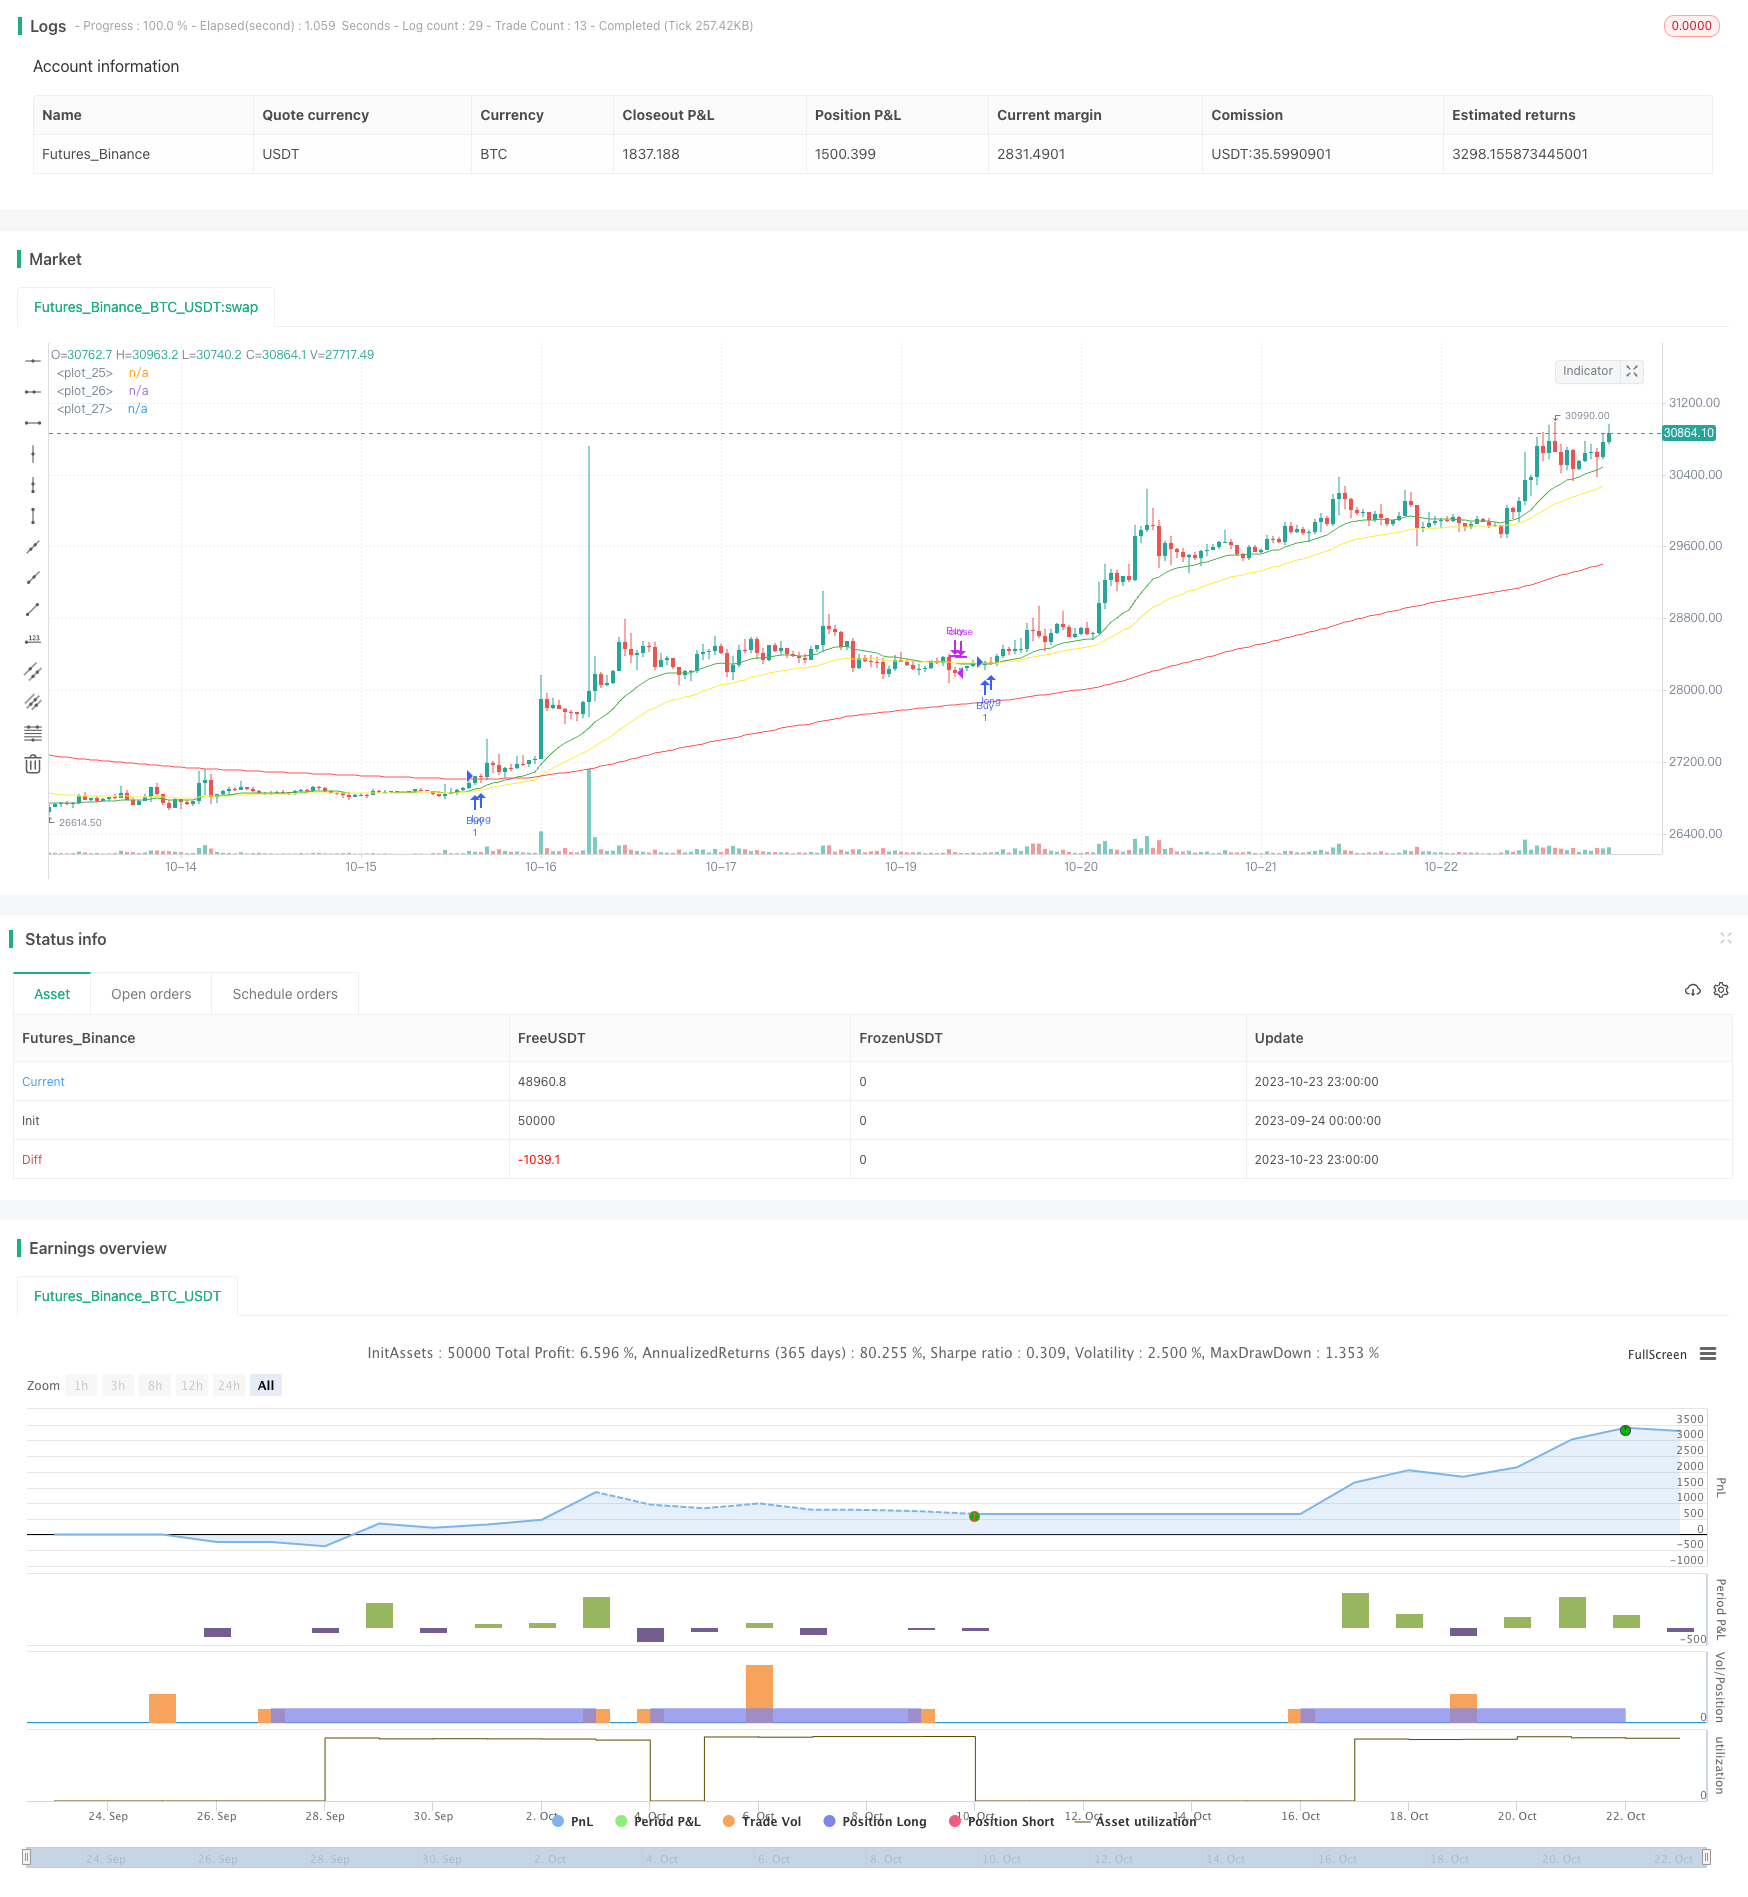
RSI EMA 크로스오버 전략
저자:차오장, 날짜: 2023-10-25 11:46:49태그:

전반적인 설명
이 전략은 기하급수적인 이동 평균 (EMA) 크로스오버의 원리를 RSI 지표와 결합하여 진입 및 출입의 트렌드 방향을 결정합니다.
전략 논리
이 전략은 빠른 EMA가 중간 EMA를 넘을 때 구매 신호가 생성되며 빠른 EMA가 중간 EMA를 넘을 때 판매 신호가 생성됩니다.
이 전략은 또한 과잉 구매 및 과잉 판매 조건을 측정하기 위해 RSI 지표를 포함합니다. RSI는 자산의 상대적 강도를 보여주기 위해 기간 동안 평균 상승일과 평균 하락일의 비율을 계산합니다. 과잉 구매 임계값 이상의 값은 과잉 구매 조건을 신호하고, 과잉 판매 임계값 이하의 값은 과잉 판매 조건을 신호합니다.
전략의 구매 조건은 다음과 같습니다.
- 빠른, 중간 및 느린 EMA 라인 위의 가격 교차
- RSI가 과판 한계점을 넘어서기
판매 조건은:
- 중간 EMA 아래로 빠른 EMA가 넘어갑니다.
- RSI가 중간선 아래로 넘어가기
트렌드 방향을 결정하기 위해 EMA 크로스오버를 사용하여 RSI와 결합하여 단기 반전 기회를 식별하는 이 전략은 트렌드 다음과 평균 반전 개념을 모두 사용합니다.
이점 분석
이 전략은 EMA 크로스오버와 RSI를 결합하여 트렌드 및 과잉 구매 / 과잉 판매 수준을 모두 측정하여 가짜 브레이크오프 및 시끄러운 거래를 필터링합니다. 3 개의 EMA 라인을 사용하면 명확한 트렌드 편향이 발생합니다.
RSI 설정은 전략이 유리한 과잉 구매/ 과잉 판매 영역에서 출입 및 출입 시간을 허용합니다.
거래에 들어가기 전에 3개의 EMA 라인을 모두 통과해야 한다는 요구는 화이트사우드를 피하는 데 도움이 됩니다.
위험 분석
모든 백트 테스트 전략과 마찬가지로, 이 전략은 백트 테스트 오버 피팅의 위험에 직면합니다. 라이브 트레이딩에서 변화하는 시장 조건은 최적화된 매개 변수를 적합하지 않게 할 수 있습니다.
다른 시장에서 전략은 잘못된 신호를 생성하고 손실을 입을 수 있습니다.
RSI 매개 변수 조정이 안되면 놓친 기회나 잘못된 신호가 발생할 수 있습니다.
더 나은 기회
-
소음을 피하기 위해 더 긴 시간 프레임에 검증을 추가하는 것을 고려하십시오.
-
신호를 확인하기 위해 거래에 들어가기 전에 EMA 라인의 재테스트를 기다립니다.
-
MACD, 볼링거 밴드 같은 다른 지표를 통합하여 신호 확인을 위해
-
기계 학습을 사용하여 견고성을 위한 매개 변수를 최적화합니다.
-
불확정 트렌드를 빨리 종료하기 위해 스톱 로스를 추가하는 것을 고려하십시오.
결론
이 전략은 EMA 크로스오버와 RSI를 결합하여 단기적 반전을 활용하면서 트렌드를 식별합니다. 트렌드 다음과 평균 반전 개념을 효율적으로 활용합니다. 신호 검증, 매개 변수 조정, 스톱 손실 등을 통해 최적화 할 수있는 여지가 있습니다. 그러나 백테스트 오버 피팅을 고려하고 라이브 성능을 평가해야합니다. 전반적으로 이것은 학습에 유용한 참조로 작용하지만 라이브 시장에서 추가 검증을 필요로합니다.
/*backtest
start: 2023-09-24 00:00:00
end: 2023-10-24 00:00:00
period: 1h
basePeriod: 15m
exchanges: [{"eid":"Futures_Binance","currency":"BTC_USDT"}]
*/

// This source code is subject to the terms of the Mozilla Public License 2.0 at https://mozilla.org/MPL/2.0/
// © chadsadachai

//@version=5
strategy("EMA Cross V1", overlay= true)

//rsi
length = input.int(title = "Rsi Lenght" , defval=26 , minval=1, maxval=50)
overS = input.int(title = "Rsi OVS line" , defval=30 , minval=1, maxval=40)
overB = input.int(title = "Rsi OVB line" , defval=70 , minval=1, maxval=100)
mLine = input.int(title = "Rsi Medium line" , defval=42 , minval=1, maxval=60)
price = close
vrsi = ta.rsi(price, length)
co = vrsi >= mLine and vrsi < overB
cu = ta.crossunder(vrsi, overB)
//ema
F = input.int(title = "EMA Fast" , defval=17 , minval=1, maxval=50)
M = input.int(title = "EMA Medium" , defval=35, minval=1, maxval=100)
S = input.int(title = "EMA Slow" , defval=142, minval=1, maxval=200)
emaF = ta.ema(price , F)
emaM = ta.ema(price , M)
emaS = ta.ema(price , S)

//plot
plot(emaF , color = color.green , linewidth=1)
plot(emaM , color = color.yellow , linewidth=1)
plot(emaS , color = color.red , linewidth=1)

//Time Stamp
start = timestamp(input.int(title = "Start Year" , defval=2011 , minval=2011, maxval=2025), input.int(title = "Start Month" , defval=1 , minval=1, maxval=12), input.int(title = "Start Day" , defval=1 , minval=1, maxval=31), 0, 0)
end = timestamp(input.int(title = "End Year" , defval=2025 , minval=2011, maxval=2025), input.int(title = "End Month" , defval=1 , minval=1, maxval=12), input.int(title = "End Day" , defval=1 , minval=1, maxval=31), 0, 0)
// years = input.int(title = "Year" , defval=2018 , minval=2011, maxval=2025)
// months = input.int(title = "Month" , defval=1 , minval=1, maxval=12)
// days = input.int(title = "Day" , defval=1 , minval=1, maxval=31)

//longCondition Default
// longCondition1 = EMA_Fast >= EMA_Slow and EMA_Fast >= EMA_Medium//ta.crossover(EMA_Fast, EMA_Slow)  EMA_Fast > EMA_Slow and EMA_Medium > EMA_Slow
// longCondition3 = price >= EMA_Medium and price > EMA_Slow
// longCondition2 = vrsi >= overSold and vrsi <= overBought

//longCondition & shortCondition ETHUSD
// 1.price > emaF > emaM > emaS
// 2.rsi overcross overS
longC1 = price > emaF and price > emaM and price > emaS
// longC1 = ta.crossover(emaF, emaM)
longC2 = if longC1
    co
// shortC1 = EMA_Fast < EMA_Medium //and EMA_Fast < EMA_Slow and EMA_Medium < EMA_Slow //and cu
// shortC2 = overBought > vrsi //and vrsi < overBought //overSold < vrsi and vrsi < mediumLine

// exitLong Condition
// 1.price < emaF < emaM < emaS
// 2.rsi overcross mediumLine
exitLong1 = ta.crossunder(emaF, emaM) //or emaF < emaM//and price < emaM and price < emaF
exitLong2 = ta.crossunder(vrsi,mLine)
//exitLong3 = price < emaM
//strategy.entry
if time >=start and time <=end
    strategy.entry("Buy", strategy.long , when = longC1 and longC2)

// if(exitLong1 or exitLong2)
strategy.close("Buy" , when = exitLong1 or exitLong2)

// exitShort1 = EMA_Fast > EMA_Medium
// //exitShort2 = ta.crossover(vrsi , mediumLine)
// exitShort2 = ta.crossunder (vrsi,mediumLine)
// strategy.close("Short" , when = exitShort1 or exitShort2)
// //shortCondition = cu


// //if (shortCondition1 and shortCondition2)
//     //strategy.entry("My Short Entry Id", strategy.short)
- 볼링거 대역 폭 스칼링 이중 이동 평균 트렌드 필터 전략
- 그라디언트 트레일링 스톱 로스 전략
- 볼링거 밴드 및 RSI 지표 전략
- 단기 거래 전략
- 이치모쿠 밸런스 라인 전략 추세
- 이중 EMA 스프레드 파업 전략
- 역동적인 브레이크업 거래 전략
- 윌리엄스 VIX 수정 전략
- RSI 이중 경로 오시슬레이션 라인 긴 및 짧은 양방향 거래 전략
- 다중 요인 운동 회전 전략
- 이중 이동 평균 전략에 따른 경향
- 글로리 홀 탈출 전략
- MACD 필터 V3와 함께 하이켄 아시 이동 평균 크로스오버 전략
- RSI 횡단주기 거래 전략
- 슈퍼트렌드 강화된 피브트 역전 전략
- 모멘텀 중재 전략 역 테스트 분석
- 평균 반전 볼링거 밴드 전략
- 선형 회귀 이동 평균 거래 전략
- 듀얼 밴드 패스 필터 전략
- 이중 이동 평균 교차 시장 거래 전략