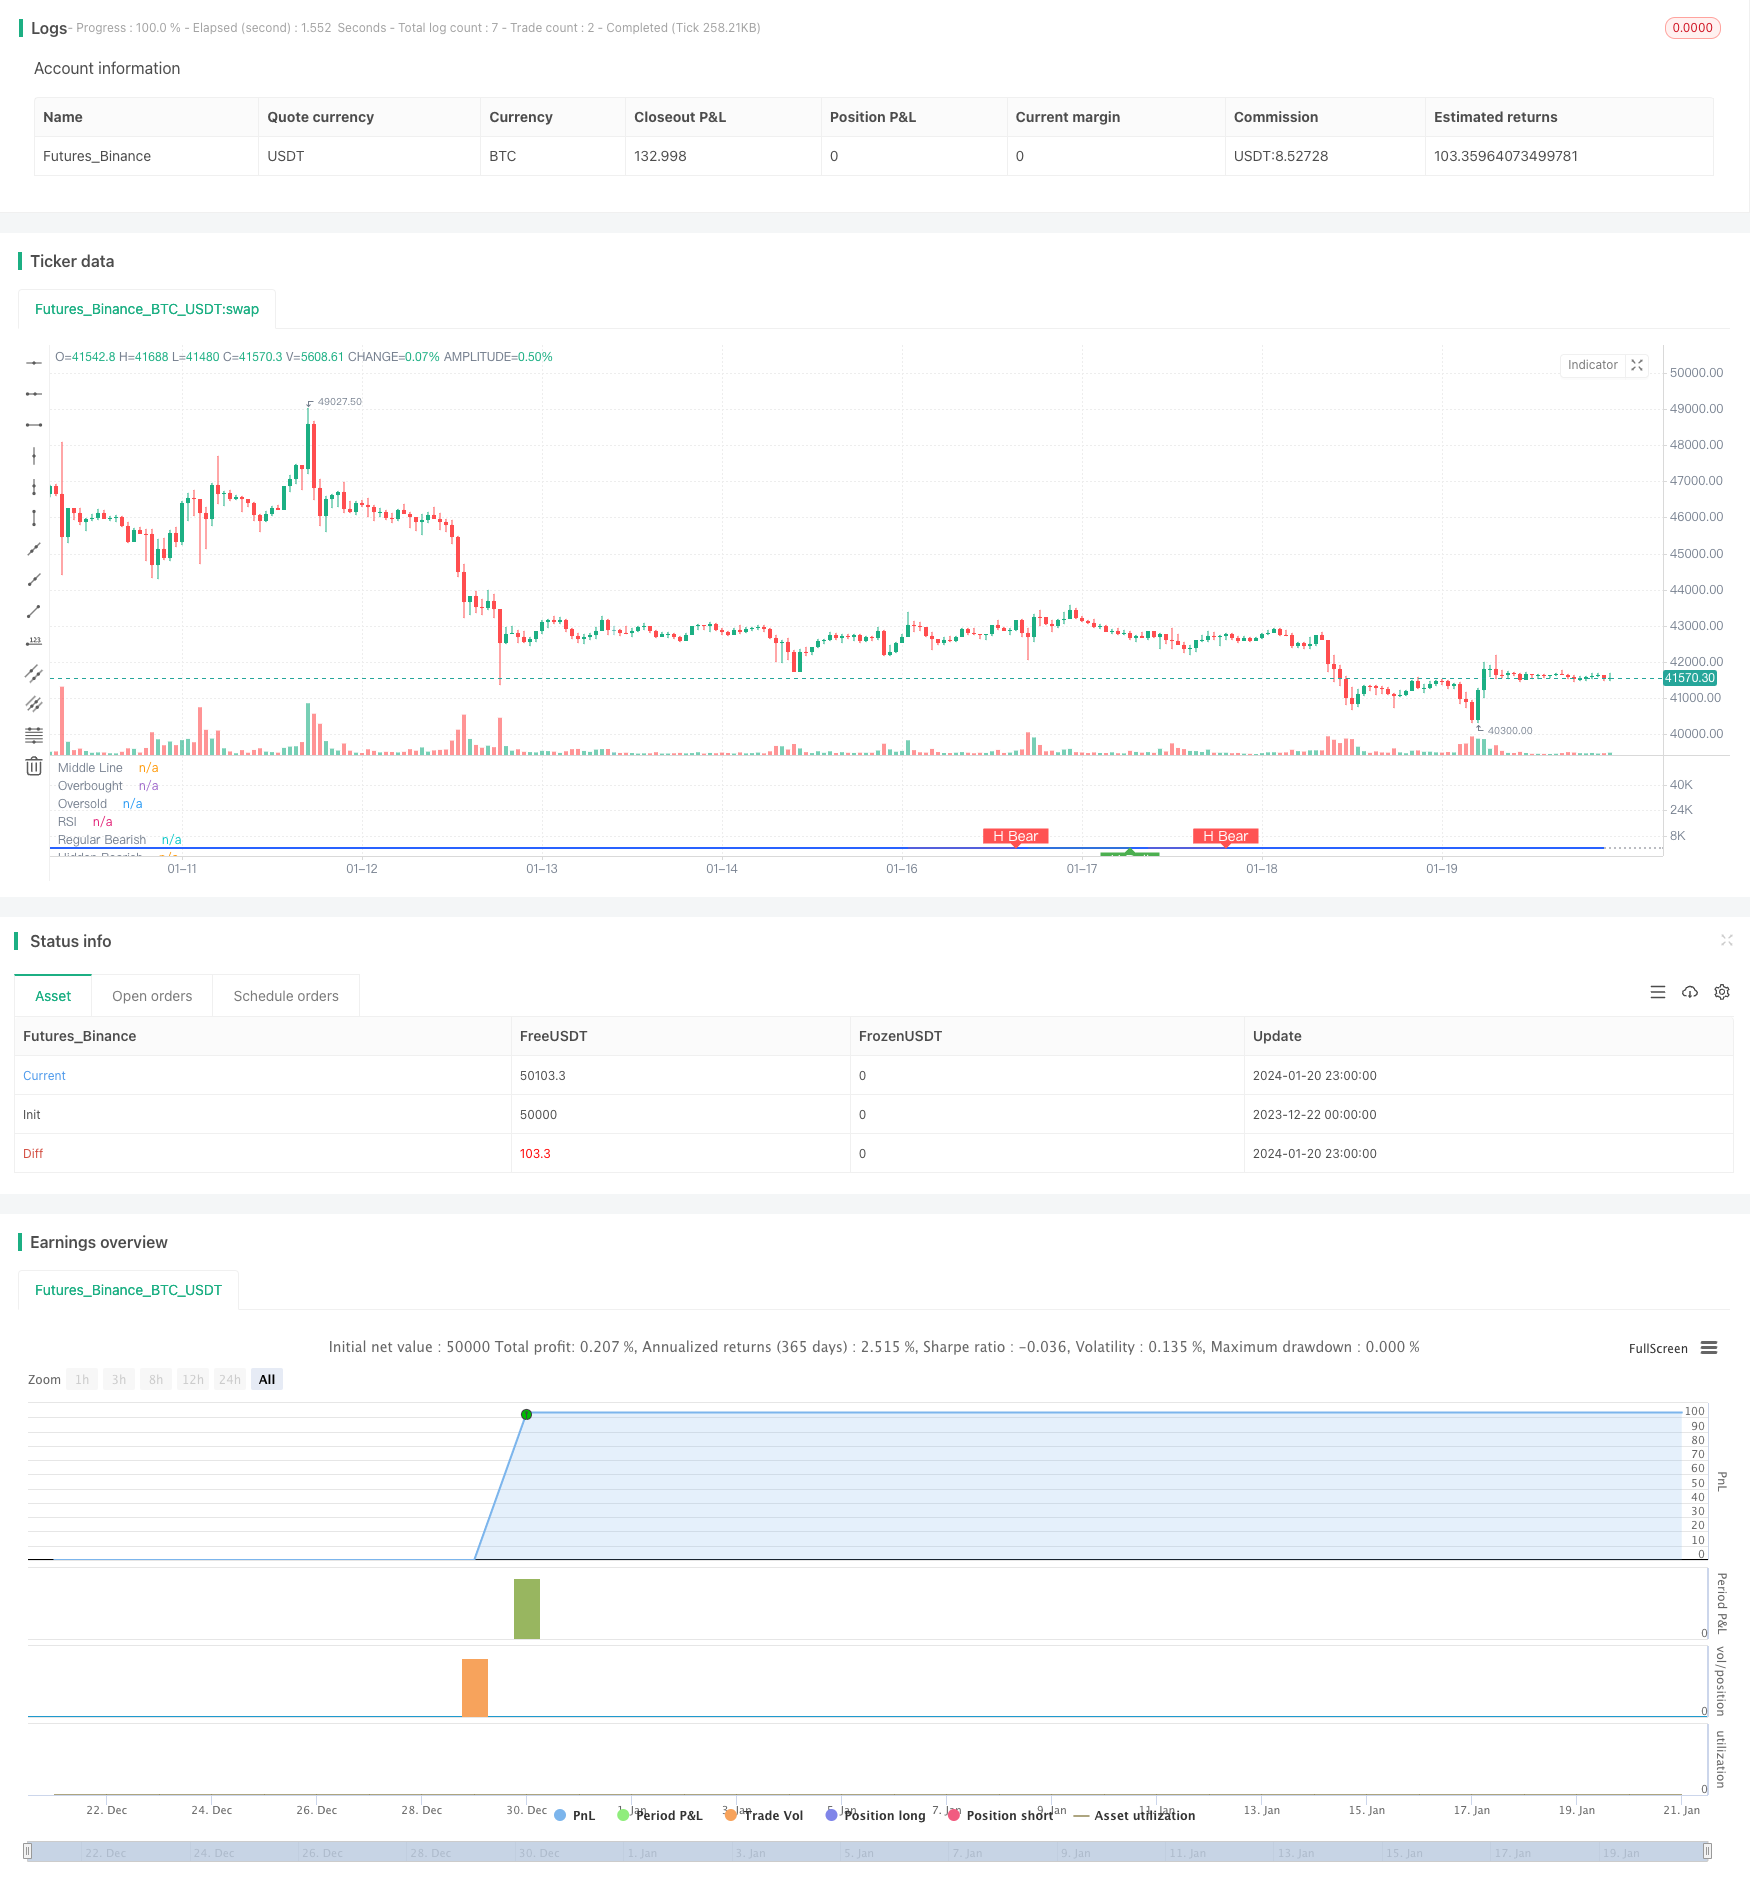
RSI 격차 거래 전략
저자:차오장, 날짜: 2024-01-22 11:45:25태그:

전략 이름
RSI 상승/하락 격차 거래 전략
전반적인 설명
이 전략은 긴 포지션과 짧은 포지션을 결정하기 위해 규칙적이고 숨겨진 상승/하락 RSI 디버전스 신호를 식별합니다.
원칙
가격으로 인해 새로운 최고치를 달성하고 RSI가 새로운 최고치를 달성하지 못하면 상승차분차가 형성되며 판매 신호로 간주됩니다. 가격으로 인해 새로운 최저치를 달성하고 RSI로 인해 새로운 최저치를 달성하지 못하면 하향차분차가 형성되며 구매 신호로 간주됩니다. 규칙적인 차분차는 가격과 RSI 사이의 명백한 차분차를 의미하며 숨겨진 차분차는 상대적으로 숨겨진 차분차를 의미합니다. 긴 또는 짧은 포지션은 확인되거나 숨겨진 규칙적인 상승/하향차분차 신호에 따라 결정됩니다.
이점 분석
- 디버전스 신호는 상대적으로 높은 신뢰성을 가지고 있으며 높은 승률을 가지고 있습니다.
- 일반적 및 숨겨진 상승/하락 오차를 식별하면 광범위한 커버리지를 제공합니다.
- 조정 가능한 RSI 매개 변수는 다른 시장 환경에 적응 할 수 있습니다.
위험 분석
- 숨겨진 오차 신호는 잘못된 판단의 확률이 높습니다.
- 잘못 판단된 신호를 필터링하기 위해 수동 검토가 필요합니다.
- 효과는 RSI 매개 변수 설정에 달려 있습니다.
최적화 방향
- 가장 좋은 매개 변수 조합을 찾기 위해 RSI 매개 변수를 최적화합니다.
- 실제 신호를 자동으로 식별할 수 있는 기계 학습 알고리즘을 추가합니다.
- 신호 신뢰성을 확인하기 위해 더 많은 지표를 포함합니다.
요약
이 전략은 긴 또는 짧은 포지션을 결정하기 위해 규칙적이고 숨겨진 상승/하락 오차를 기반으로 RSI 분차 거래 신호를 식별하여 상대적으로 높은 승률을 제공합니다. RSI 매개 변수를 최적화하고 다른 검증 지표를 추가함으로써 전략 효과에 대한 추가 개선이 달성 될 수 있습니다.
/*backtest
start: 2023-12-22 00:00:00
end: 2024-01-21 00:00:00
period: 1h
basePeriod: 15m
exchanges: [{"eid":"Futures_Binance","currency":"BTC_USDT"}]
*/

//@version=5
strategy(title="Divergence Indicator")
len = input.int(title="RSI Period", minval=1, defval=14)
src = input(title="RSI Source", defval=close)
lbR = input(title="Pivot Lookback Right", defval=5)
lbL = input(title="Pivot Lookback Left", defval=5)
rangeUpper = input(title="Max of Lookback Range", defval=60)
rangeLower = input(title="Min of Lookback Range", defval=5)
plotBull = input(title="Plot Bullish", defval=true)
plotHiddenBull = input(title="Plot Hidden Bullish", defval=true)
plotBear = input(title="Plot Bearish", defval=true)
plotHiddenBear = input(title="Plot Hidden Bearish", defval=true)
bearColor = color.red
bullColor = color.green
hiddenBullColor = color.new(color.green, 80)
hiddenBearColor = color.new(color.red, 80)
textColor = color.white
noneColor = color.new(color.white, 100)
osc = ta.rsi(src, len)

plot(osc, title="RSI", linewidth=2, color=#2962FF)
hline(50, title="Middle Line", color=#787B86, linestyle=hline.style_dotted)
obLevel = hline(70, title="Overbought", color=#787B86, linestyle=hline.style_dotted)
osLevel = hline(30, title="Oversold", color=#787B86, linestyle=hline.style_dotted)
fill(obLevel, osLevel, title="Background", color=color.rgb(33, 150, 243, 90))

plFound = na(ta.pivotlow(osc, lbL, lbR)) ? false : true
phFound = na(ta.pivothigh(osc, lbL, lbR)) ? false : true
_inRange(cond) =>
	bars = ta.barssince(cond == true)
	rangeLower <= bars and bars <= rangeUpper

//------------------------------------------------------------------------------
// Regular Bullish
// Osc: Higher Low

oscHL = osc[lbR] > ta.valuewhen(plFound, osc[lbR], 1) and _inRange(plFound[1])

// Price: Lower Low

priceLL = low[lbR] < ta.valuewhen(plFound, low[lbR], 1)
// bull : 상승 Condition : 조건
bullCond = plotBull and priceLL and oscHL and plFound // 상승다이버전스?
strategy.entry("상승 다이버전스 진입", strategy.long, when = bullCond)
strategy.close("상승 다이버전스 진입", when = ta.crossover(osc, 50))
plot(
     plFound ? osc[lbR] : na,
     offset=-lbR,
     title="Regular Bullish",
     linewidth=2,
     color=(bullCond ? bullColor : noneColor)
     )

plotshape(
	 bullCond ? osc[lbR] : na,
	 offset=-lbR,
	 title="Regular Bullish Label",
	 text=" Bull ",
	 style=shape.labelup,
	 location=location.absolute,
	 color=bullColor,
	 textcolor=textColor
	 )

//------------------------------------------------------------------------------
// Hidden Bullish
// Osc: Lower Low

oscLL = osc[lbR] < ta.valuewhen(plFound, osc[lbR], 1) and _inRange(plFound[1])

// Price: Higher Low

priceHL = low[lbR] > ta.valuewhen(plFound, low[lbR], 1)
hiddenBullCond = plotHiddenBull and priceHL and oscLL and plFound
// strategy.entry("히든 상승 다이버전스 진입", strategy.long, when = hiddenBullCond)
// strategy.close("히든 상승 다이버전스 진입", when = ta.crossover(osc, 50))
plot(
	 plFound ? osc[lbR] : na,
	 offset=-lbR,
	 title="Hidden Bullish",
	 linewidth=2,
	 color=(hiddenBullCond ? hiddenBullColor : noneColor)
	 )

plotshape(
	 hiddenBullCond ? osc[lbR] : na,
	 offset=-lbR,
	 title="Hidden Bullish Label",
	 text=" H Bull ",
	 style=shape.labelup,
	 location=location.absolute,
	 color=bullColor,
	 textcolor=textColor
	 )

//------------------------------------------------------------------------------
// Regular Bearish
// Osc: Lower High

oscLH = osc[lbR] < ta.valuewhen(phFound, osc[lbR], 1) and _inRange(phFound[1])

// Price: Higher High

priceHH = high[lbR] > ta.valuewhen(phFound, high[lbR], 1)
// bear : 하락
bearCond = plotBear and priceHH and oscLH and phFound
// strategy.entry("하락 다이버전스 진입", strategy.short, when = bearCond)
// strategy.close("하락 다이버전스 진입", when = ta.crossunder(osc, 50))
plot(
	 phFound ? osc[lbR] : na,
	 offset=-lbR,
	 title="Regular Bearish",
	 linewidth=2,
	 color=(bearCond ? bearColor : noneColor)
	 )

plotshape(
	 bearCond ? osc[lbR] : na,
	 offset=-lbR,
	 title="Regular Bearish Label",
	 text=" Bear ",
	 style=shape.labeldown,
	 location=location.absolute,
	 color=bearColor,
	 textcolor=textColor
	 )

//------------------------------------------------------------------------------
// Hidden Bearish
// Osc: Higher High

oscHH = osc[lbR] > ta.valuewhen(phFound, osc[lbR], 1) and _inRange(phFound[1])

// Price: Lower High

priceLH = high[lbR] < ta.valuewhen(phFound, high[lbR], 1)

hiddenBearCond = plotHiddenBear and priceLH and oscHH and phFound
// strategy.entry("히든 하락 다이버전스 진입", strategy.short, when = hiddenBearCond)
// strategy.close("히든 하락 다이버전스 진입", when = ta.crossunder(osc, 50))
plot(
	 phFound ? osc[lbR] : na,
	 offset=-lbR,
	 title="Hidden Bearish",
	 linewidth=2,
	 color=(hiddenBearCond ? hiddenBearColor : noneColor)
	 )

plotshape(
	 hiddenBearCond ? osc[lbR] : na,
	 offset=-lbR,
	 title="Hidden Bearish Label",
	 text=" H Bear ",
	 style=shape.labeldown,
	 location=location.absolute,
	 color=bearColor,
	 textcolor=textColor
	 )
더 많은
- 역동적인 CCI 지원 및 저항 전략
- QQE 모멘텀 거래 전략
- 가우스파 예측 전략
- 동적 이동 EMA 조합 양성 전략
- 도치안 채널 트렌드 전략
- EMA 리본 전략
- 정확한 트렌드 역전 이동 평균 크로스오버 전략
- 다중 EMA 상승 트렌드 전략
- S&P500 하이브리드 계절 거래 전략
- 오차 기반 트렌드 추적 전략
- 다중 지표 결정 트리 전략: IMACD, EMA 및 Ichimoku
- MACD 이중 최적화 거래 전략
- 이중 EMA 골든 크로스 전략
- 다중 시간 프레임 RSI 및 이동 평균 거래 전략
- 주간 스윙 거래 전략
- EVWMA 기반의 MACD 거래 전략
- 볼링거 밴드 채널 브레이크오웃 평균 역전 전략
- 다중 기술 지표에 기초한 양적 추세 추적 전략
- RSI와 CCI 조합 양적 거래 전략
- 저위험 DCA 트렌드 거래 전략