비트코인과 금의 이중 격차 전략
저자:차오장날짜: 2024-01-23 15:28:56태그:

전반적인 설명
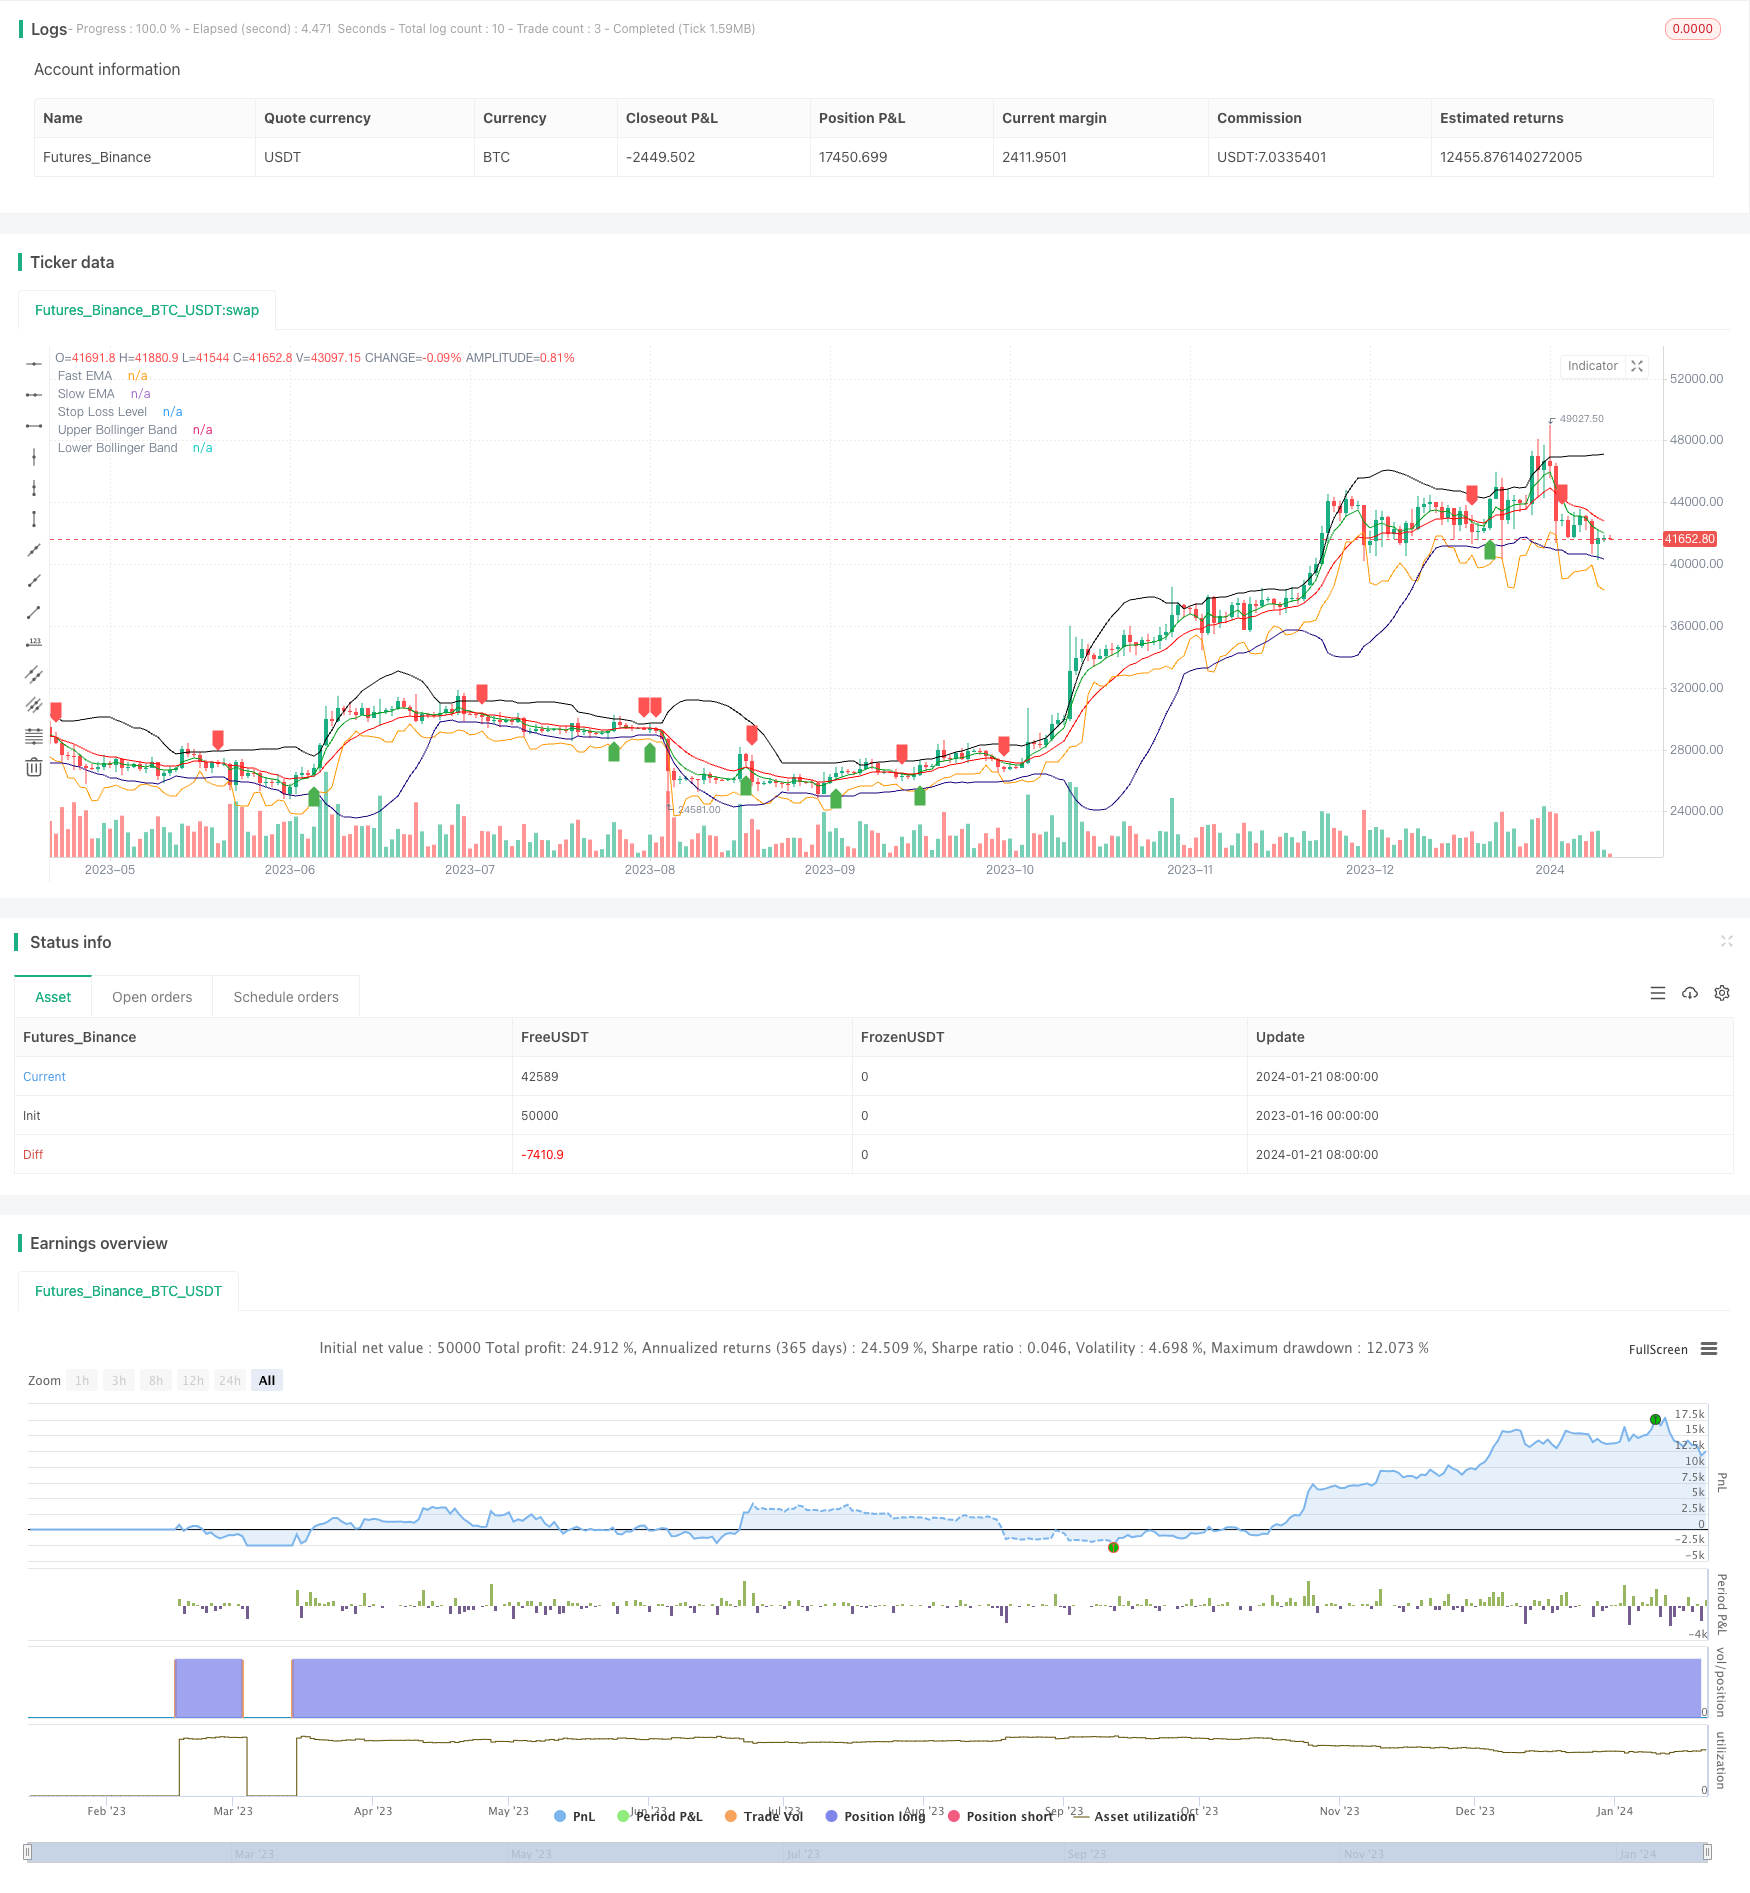
이중 간격 전략 (Double Gap strategy) 은 비트코인과 금의 단기 거래에 사용되는 양적 전략이다. 이 전략은 이동 평균, 볼링거 밴드 및 ATR 스톱을 결합하여 브레이크 아웃 신호를 식별하고 위험을 관리한다.
전략 논리
이중 간격 전략은 트렌드 방향을 결정하기 위해 빠른 EMA와 느린 EMA 크로스오버를 사용합니다. 빠른 EMA가 느린 EMA를 넘을 때 구매 신호가 생성되며 빠른 EMA가 느린 EMA를 넘을 때 판매 신호가 생성됩니다. 잘못된 브레이크오버를 피하기 위해 전략은 크로스오버가 상부 또는 중부 볼링거 밴드 근처에서 일어나도록 요구합니다. 여기서
특히, 구매 신호를 결정하려면 다음 두 가지 조건이 모두 충족되어야합니다: 1) 빠른 EMA가 느린 EMA보다 높습니다; 2) 폐쇄 가격은 상부 또는 중부 볼링거 밴드 근처 또는 아래에 있습니다. 판매 신호를 판단하는 것은 비슷합니다. 빠른 EMA가 느린 EMA 아래를 넘어서 하부 또는 중부 볼링거 밴드 근처에 있어야합니다.
또한, 이중 간격 전략은 각 거래의 위험을 제어하기 위해 동적 스톱 손실을 계산하기 위해 ATR 지표를 사용합니다. 특정 스톱 레벨은 가장 최근의 두 바 마이너스 N 곱하기 ATR의 가장 낮은 수준입니다.
장점
- 이중 필터를 사용하여 높은 확률의 브레이크오웃을 식별합니다.
- 빠른 EMA 크로스오버가 주요 트렌드를 판단하고 볼링거 밴드는 가짜 브레이크를 필터합니다.
- 동적 ATR 중지 단일 무역 위험을 효과적으로 제어
- BTC와 같은 높은 변동성 상품의 단기 거래에 적합합니다.
위험성
- 부적절한 빠르고 느린 EMA 매개 변수는 과도한 잘못된 신호를 생성할 수 있습니다.
- 부적절한 볼링거 밴드 매개 변수 또한 필터링 효과를 크게 줄일 것입니다.
- 스톱 로스 설정이 너무 좁으면 트리거 될 확률이 높아집니다.
- 높은 거래 빈도가 요구되며 작은 계좌에 적합하지 않습니다.
최적화
이중 격차 전략은 다음과 같은 측면에서 최적화 될 수 있습니다.
- 가장 빠른 EMA와 느린 EMA 조합을 찾기 위해 이동 평균 매개 변수를 최적화
- 가짜 브레이크업 비율을 줄이기 위해 볼링거 밴드 매개 변수를 최적화합니다.
- 각기 다른 제품 및 시장 체제에 따라 ATR 정지 곱셈을 조정합니다.
- 정지 후 재입구 신호를 추가
- 확인으로 RSI, KD 등과 같은 다른 지표와 결합
결론
이중 격차 전략은 트렌드 추적 및 브레이크아웃 필터링을 모두 사용하여 단기 기회를 효과적으로 식별합니다. 동적 스톱 로스 관리를 통해 높은 변동성 디지털 통화 및 귀금속의 단기 거래에 적합합니다. 매개 변수 및 논리 최적화로 안정성과 수익성이 더욱 향상 될 수 있습니다.
/*backtest
start: 2023-01-16 00:00:00
end: 2024-01-22 00:00:00
period: 1d
basePeriod: 1h
exchanges: [{"eid":"Futures_Binance","currency":"BTC_USDT"}]
*/

// This source code is subject to the terms of the Mozilla Public License 2.0 at https://mozilla.org/MPL/2.0/
// © singhak8757

//@version=5
strategy("Bitcoin and Gold 5min Scalping Strategy2.0", overlay=true)


// Input parameters
fastLength = input(5, title="Fast EMA Length")
slowLength = input(13, title="Slow EMA Length")
bollingerLength = input(20, title="Bollinger Band Length")
bollingerMultiplier = input(2, title="Bollinger Band Multiplier")
stopLossMultiplier = input(1, title="Stop Loss Multiplier")

// Calculate EMAs
fastEMA = ta.ema(close, fastLength)
slowEMA = ta.ema(close, slowLength)

// Calculate Bollinger Bands
basis = ta.sma(close, bollingerLength)
upperBand = basis + bollingerMultiplier * ta.stdev(close, bollingerLength)
lowerBand = basis - bollingerMultiplier * ta.stdev(close, bollingerLength)

// Buy condition
buyCondition = ta.crossover(fastEMA, slowEMA) and (close <= upperBand or close <= basis)

// Sell condition
sellCondition = ta.crossunder(fastEMA, slowEMA) and (close >= lowerBand or close >= basis)

// Calculate stop loss level
stopLossLevel = ta.lowest(low, 2)[1] - stopLossMultiplier * ta.atr(14)

// Plot EMAs
plot(fastEMA, color=color.rgb(0, 156, 21), title="Fast EMA")
plot(slowEMA, color=color.rgb(255, 0, 0), title="Slow EMA")

// Plot Bollinger Bands
plot(upperBand, color=color.new(#000000, 0), title="Upper Bollinger Band")
plot(lowerBand, color=color.new(#1b007e, 0), title="Lower Bollinger Band")

// Plot Buy and Sell signals
plotshape(series=buyCondition, title="Buy Signal", color=color.green, style=shape.labelup, location=location.belowbar)
plotshape(series=sellCondition, title="Sell Signal", color=color.red, style=shape.labeldown, location=location.abovebar)

// Plot Stop Loss level
plot(stopLossLevel, color=color.orange, title="Stop Loss Level")

// Strategy logic
strategy.entry("Buy", strategy.long, when = buyCondition)
strategy.exit("Stop Loss/Close", from_entry="Buy", loss=stopLossLevel)
strategy.close("Sell", when = sellCondition)
- RSI CCI Williams%R 양적 거래 전략
- 역동적 위험 조정 동력 거래 전략
- 동력 이동 평균 크로스오버 거래 전략
- 볼링거 대역 제한 시장 제작자 전략
- 장기 이동평균 크로스오버 렌코 전략
- 신규 거래에 대한 온라인 감시
- 양방향 트렌드 추적 렌코 거래 전략
- 결합된 이동 평균 및 무한 충동 반응 라인 전략
- 슈퍼트렌드 추적 전략
- 다중 지표 트렌드 역전 거래 전략
- MACD와 RSI의 크로스오버 전략
- 모멘텀 풀백 전략
- 이동 평균 크로스오버 전략
- 오시슬레이션과 함께 수익 그리드 전략
- 이동평균에 기초한 오스실레이션 돌파 전략
- 지그자그 패턴 인식 단기 거래 전략
- 윌리엄스 VIX와 DEMA를 기반으로 시간 프레임에 걸쳐 변동성 및 트렌드 추적 전략
- 이동평균을 이용한 사이클 판단에 기초한 모멘텀 브레이크 전략
- 돈 흐름 지수 5분 전략 시간 및 공간
- 이중 EMA 트렌드 트레이딩 전략