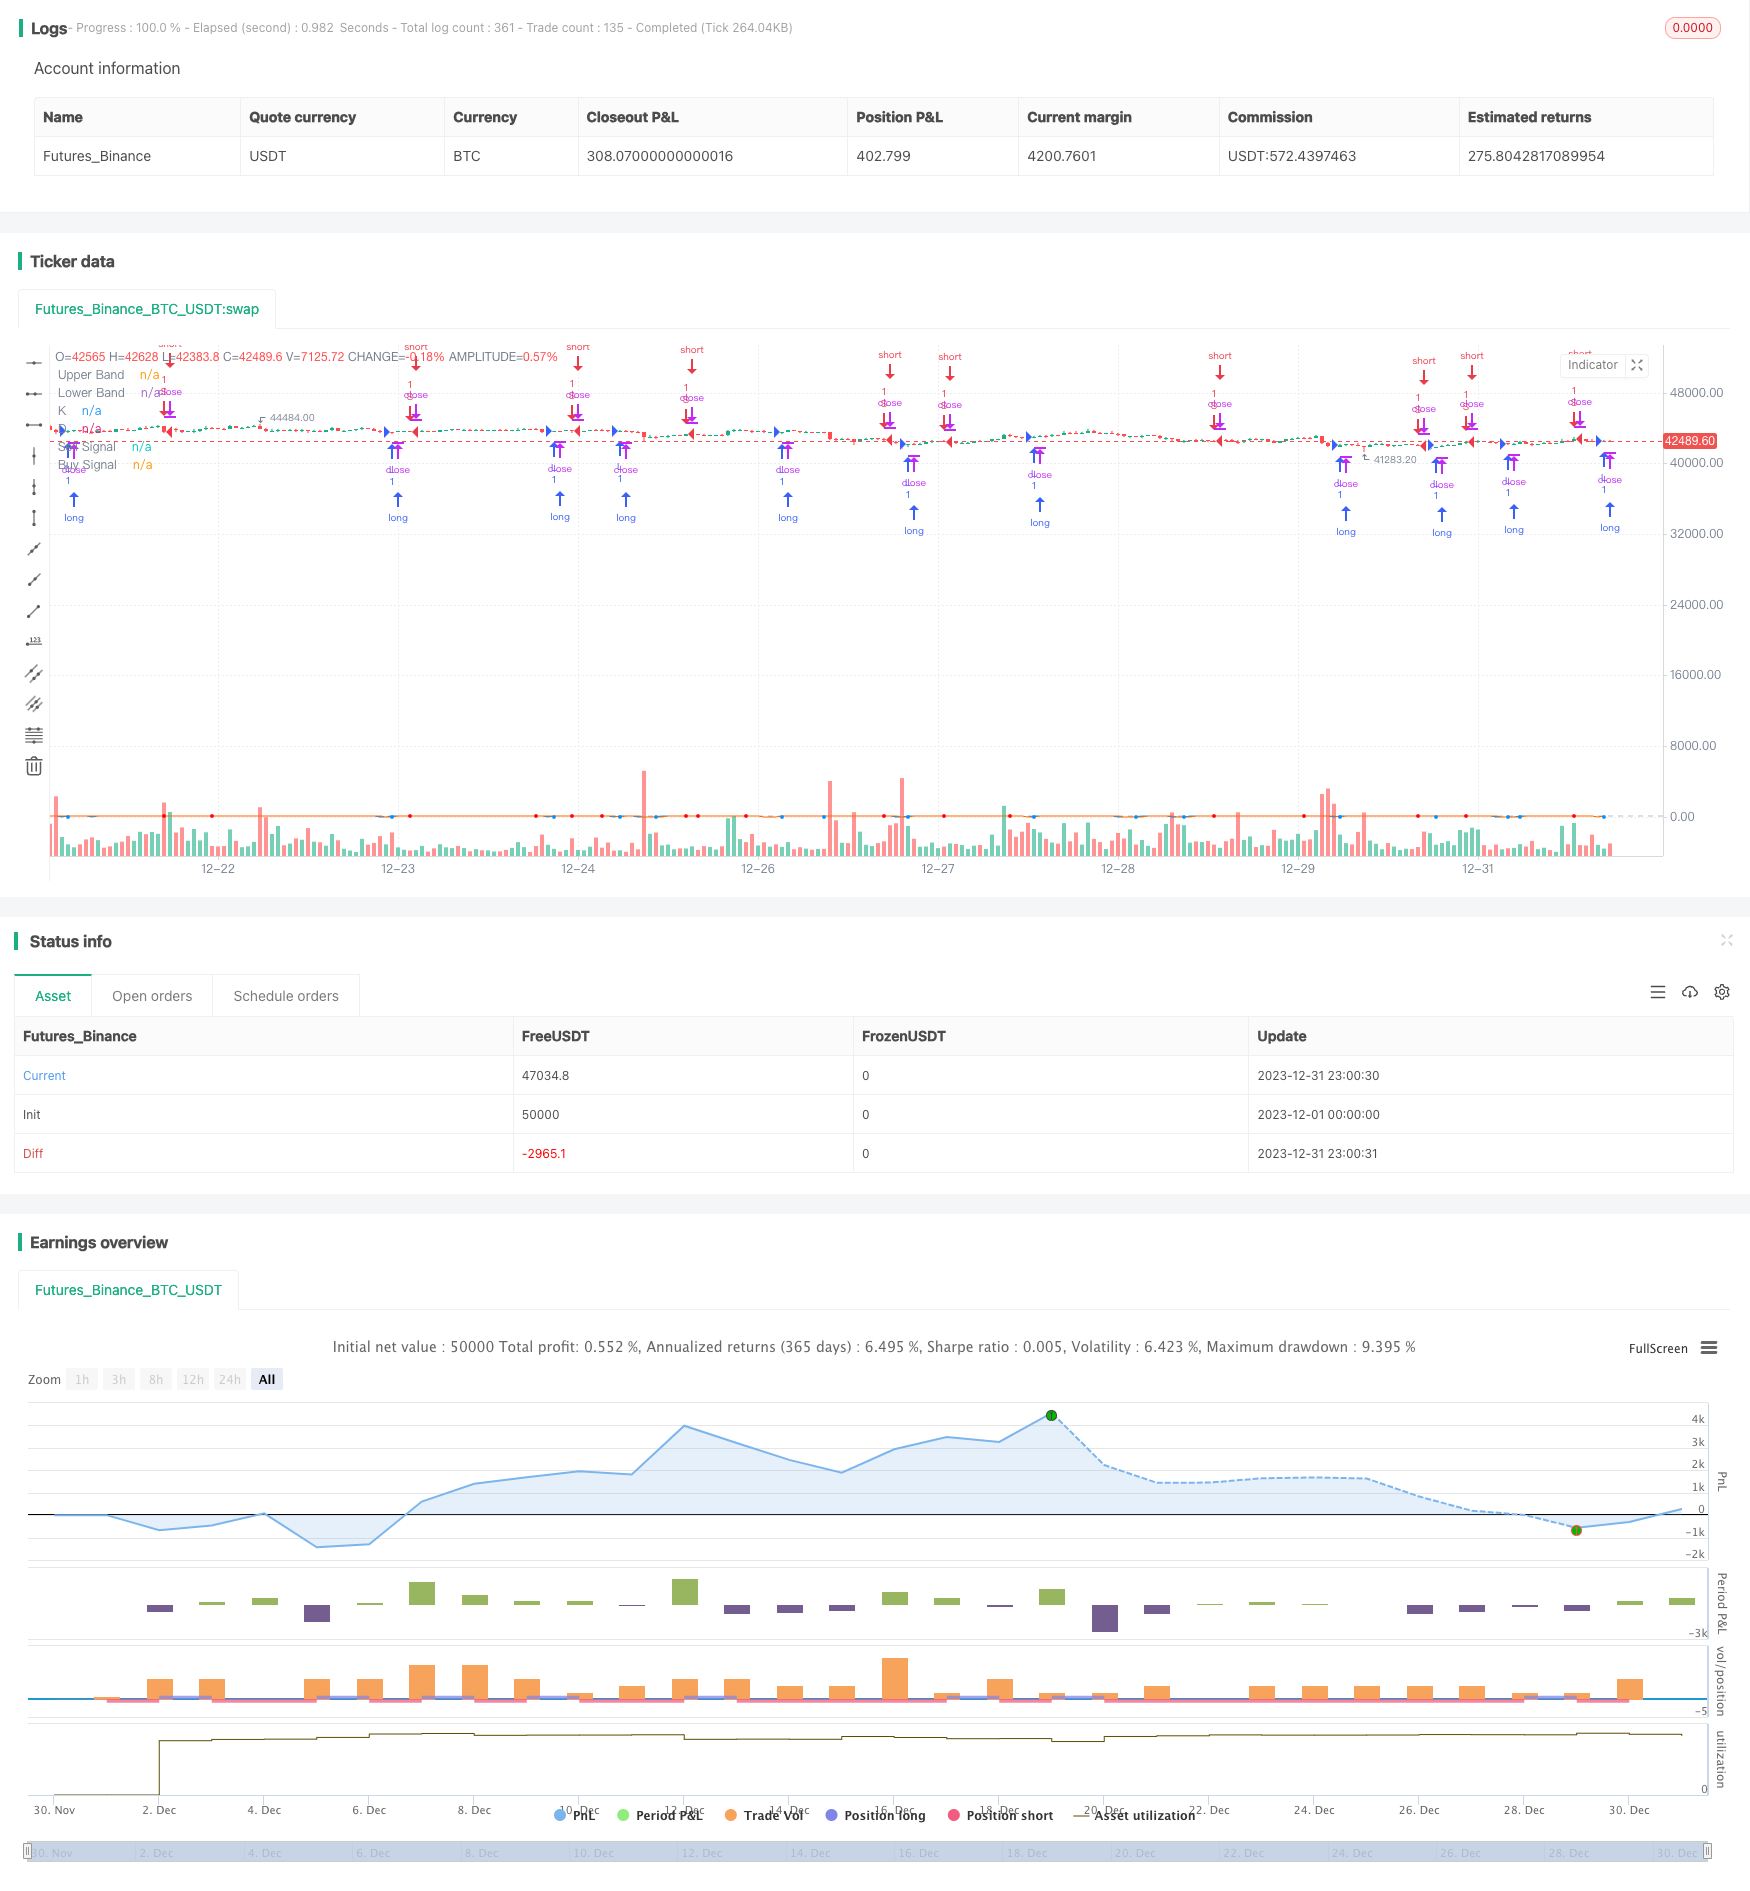
Ehlers-Smoothed 스토카스틱 RSI 전략
저자:차오장날짜: 2024-01-26 15:58:48태그:

전반적인 설명
전략 논리
이점 분석
위험 분석
최적화 방향
이 전략의 주요 최적화 방향은 다음과 같습니다.
-
매개 변수 설정을 최적화합니다. 광범위한 백테스팅을 통해 스토카스틱 RSI의 길이와 평평화 상수와 같은 매개 변수를 최적화합니다.
-
다른 지표 또는 패턴과 결합합니다. 여러 필터 조건을 추가하고 위험을 더 줄이기 위해 변동성 지표, 이동 평균 등과 결합하는 것을 고려하십시오.
요약
/*backtest
start: 2023-12-01 00:00:00
end: 2023-12-31 23:59:59
period: 1h
basePeriod: 15m
exchanges: [{"eid":"Futures_Binance","currency":"BTC_USDT"}]
*/

//@version=3
strategy("ES Stoch RSI Strategy [krypt]", overlay=true, calc_on_order_fills=true, calc_on_every_tick=true, initial_capital=10000, currency='USD')

//Backtest Range
FromMonth = input(defval = 06, title = "From Month", minval = 1)
FromDay   = input(defval = 1, title = "From Day", minval = 1)
FromYear  = input(defval = 2018, title = "From Year", minval = 2014)
ToMonth   = input(defval = 7, title = "To Month", minval = 1)
ToDay     = input(defval = 30, title = "To Day", minval = 1)
ToYear    = input(defval = 2018, title = "To Year", minval = 2014)

PI = 3.14159265359

drop1st(src) =>
    x = na
    x := na(src[1]) ? na : src

xlowest(src, len) =>
    x = src
    for i = 1 to len - 1
        v = src[i]
        if (na(v))
            break
        x := min(x, v)
    x

xhighest(src, len) =>
    x = src
    for i = 1 to len - 1
        v = src[i]
        if (na(v))
            break
        x := max(x, v)
    x

xstoch(c, h, l, len) =>
    xlow = xlowest(l, len)
    xhigh = xhighest(h, len)
    100 * (c - xlow) / (xhigh - xlow)

Stochastic(c, h, l, length) =>
    rawsig = xstoch(c, h, l, length)
    min(max(rawsig, 0.0), 100.0)

xrma(src, len) =>
    sum = na
    sum := (src + (len - 1) * nz(sum[1], src)) / len

xrsi(src, len) =>
    msig = nz(change(src, 1), 0.0)
    up = xrma(max(msig, 0.0), len)
    dn = xrma(max(-msig, 0.0), len)
    rs = up / dn
    100.0 - 100.0 / (1.0 + rs)

EhlersSuperSmoother(src, lower) =>
	a1 = exp(-PI * sqrt(2) / lower)
	coeff2 = 2 * a1 * cos(sqrt(2) * PI / lower)
	coeff3 = -pow(a1, 2)
	coeff1 = (1 - coeff2 - coeff3) / 2
	filt = na
	filt := nz(coeff1 * (src + nz(src[1], src)) + coeff2 * filt[1] + coeff3 * filt[2], src)

smoothK = input(7, minval=1, title="K")
smoothD = input(2, minval=1, title="D")
lengthRSI = input(10, minval=1, title="RSI Length")
lengthStoch = input(3, minval=1, title="Stochastic Length")
showsignals = input(true, title="Buy/Sell Signals")
src = input(close,  title="Source")

ob = 80
os = 20
midpoint = 50

price = log(drop1st(src))
rsi1 = xrsi(price, lengthRSI)
rawsig = Stochastic(rsi1, rsi1, rsi1, lengthStoch)
sig = EhlersSuperSmoother(rawsig, smoothK)
ma = sma(sig, smoothD)

plot(sig, color=#0094ff, title="K", transp=0)
plot(ma, color=#ff6a00, title="D", transp=0)
lineOB = hline(ob, title="Upper Band", color=#c0c0c0)
lineOS = hline(os, title="Lower Band", color=#c0c0c0)
fill(lineOB, lineOS, color=purple, title="Background")

// Buy/Sell Signals

// use curvature information to filter out some false positives
mm1 = change(change(ma, 1), 1)
mm2 = change(change(ma, 2), 2)
ms1 = change(change(sig, 1), 1)
ms2 = change(change(sig, 2), 2)

sellsignals = showsignals and (mm1 + ms1 < 0 and mm2 + ms2 < 0) and crossunder(sig, ma) and sig[1] > ob
buysignals = showsignals and (mm1 + ms1 > 0 and mm2 + ms2 > 0) and crossover(sig, ma) and sig[1] < os

ploff = 4
plot(buysignals ? sig[1] - ploff : na, style=circles, color=#008fff, linewidth=3, title="Buy Signal", transp=0)
plot(sellsignals ? sig[1] + ploff : na, style=circles, color=#ff0000, linewidth=3, title="Sell Signal", transp=0)

longCondition = buysignals
if (longCondition)
    strategy.entry("L", strategy.long, comment="Long", when=(buysignals))

shortCondition = sellsignals
if (shortCondition)
    strategy.entry("S", strategy.short, comment="Short", when=(sellsignals))
더 많은
- 상대적 추진력 전략
- 양자 전략에 따른 파동 트렌드 및 VWMA 기반 트렌드
- 이중 이동 평균 및 윌리엄스 평균 조합 전략
- 이동 평균 크로스오버 전략
- 다중 지표량 거래 전략
- 시장 암호파 B 자동 거래 전략
- 핵심 역전 역 테스트 전략
- 반전 촛불 역 테스트 전략
- Swing High Low Price 채널 전략 V.1
- 동력 역전 거래 전략
- 적응형 선형 회귀 채널 전략
- 이동 평균 차이 제로 크로스 전략
- 여러 지표가 전략을 따르고
- 전략에 따른 탄탄한 추세
- 전략에 따라 가격 이동 평균 트렌드를 넘기기
- 이중 EMA 골든 크로스 브레이크업 전략
- 단계적 BB KC 트렌드 전략
- 트리플 SMA 자동 추적 전략