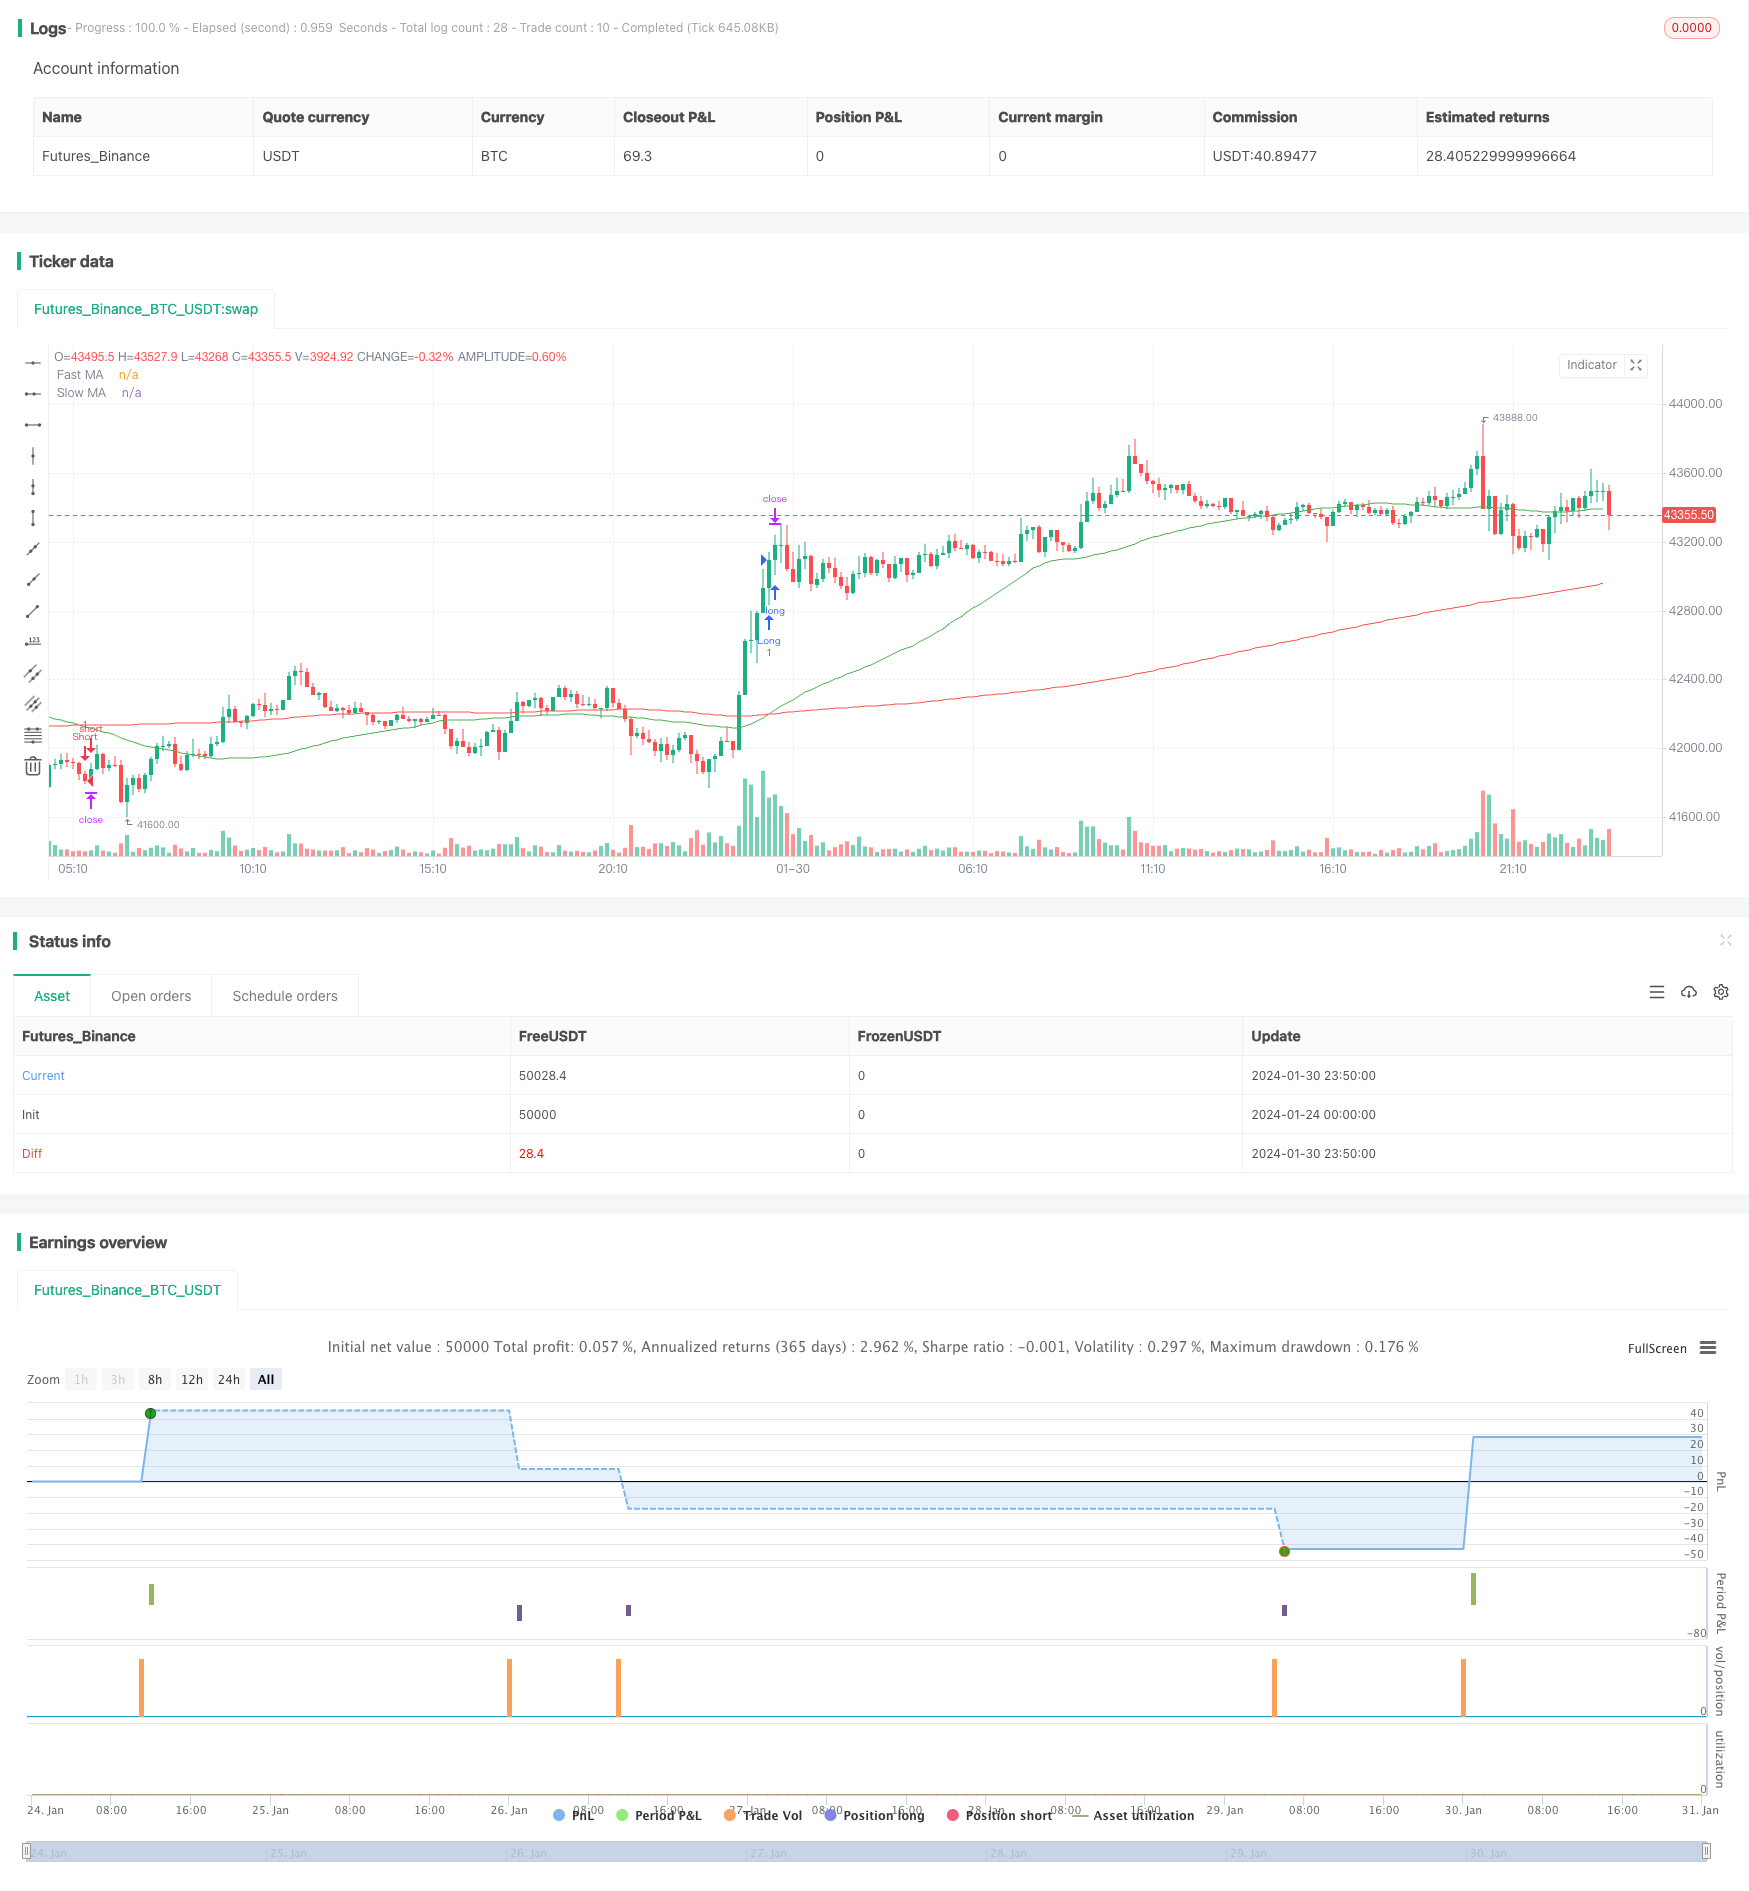
전략에 따른 이동 평균 트렌드
저자:차오장, 날짜: 2024-02-01 10:18:53태그:

전반적인 설명
이 전략은 빠른 이동 평균 (Fast MA) 과 느린 이동 평균 (Slow MA) 을 계산하고 추세를 따라 긴 또는 짧은 포지션을 구현하기 위해 비교하여 시장 트렌드 방향을 판단합니다. 빠른 MA가 느린 MA를 넘을 때, 길게 가십시오. 빠른 MA가 느린 MA를 넘을 때, 짧게 가십시오. 한편, 스톱 손실과 수익을 취하면 위험을 제어 할 수 있습니다.
원칙
이 전략의 핵심 논리는 움직이는 평균의 황금 십자와 죽은 십자에 기반합니다. 움직이는 평균은 평균 시장 가격의 변화를 매우 잘 반영 할 수 있습니다. 빠른 평균은 짧은 기간을 가지고 있으며 가격 변화에 신속하게 대응 할 수 있습니다. 느린 평균은 더 긴 기간을 가지고 있으며 더 넓은 시장 트렌드 방향을 나타냅니다. 빠른 MA가 느린 MA를 넘을 때 시장이 상승 추세를 시작하는 것을 나타냅니다. 빠른 MA가 느린 MA보다 낮을 넘을 때 시장이 하향 추세를 시작하는 것을 나타냅니다.
특히, 이 전략은 각각 50주기 빠른 MA와 200주기 느린 MA를 계산한다. 각 촛불
포지션을 입력 한 후, 트레일 스톱은 스톱 로스를 추적하고 이익을 잠금하는 데 사용됩니다. 또한, 스톱 로스와 수익은 ATR 값을 기반으로 설정됩니다.
장점
이것은 다음과 같은 장점을 가진 전형적인 트렌드를 따르는 전략입니다.
- 트렌드 방향을 결정하기 위해 이동 평균을 사용하는 것은 높은 정확성과 좋은 승률을 가지고 있습니다.
- 빠르고 느린 이동 평균 조합을 채택하면 시장 소음을 효과적으로 필터하고 주요 추세를 파악 할 수 있습니다.
- 손해를 멈추고 이익을 취하는 것을 설정하면 단일 손실을 제어하고 수익 확률을 높일 수 있습니다.
- 백테스트 결과는 좋고, 수용 가능한 최대 마취량과 샤프 비율이 있습니다.
- 전략 논리는 간단하고 이해하기 쉽다, 매개 변수는 조정에 유연하며 평균 트레이더에 적합합니다
위험성
이 전략에는 몇 가지 위험도 있습니다.
- 이동 평균에 의해 생성되는 신호는 지연될 수 있으며 극심한 시장 변동이 발생했을 때 거짓 파업에 의해 영향을 받을 수 있습니다.
- 스톱 로스 또는 영업 취득의 부적절한 설정은 손실 또는 손실 수익을 초래할 수 있습니다.
- 파라미터 설정에 지나치게 의존하여, 부적절한 파라미터 전략 성능에 큰 영향을 미칠 것입니다
- 가격 조사 및 인하로 인한 작은 손실을 완벽하게 피할 수 없습니다.
- 시장에 대한 근본적인 정보 및 중요한 뉴스 이벤트의 영향을 고려하지 않습니다.
해결책:
- 합리적으로 이동 평균 사이클 매개 변수를 평가하고 설정
- 수동 설정 오류를 피하기 위해 적응 스톱 손실을 채택하고 이익을 취합니다.
- 복잡성 분석과 백테스트를 통해 매개 변수를 최적화
- 적절한 스톱 로스 범위를 확장하고 포지션 크기를 증가
- 대응 계획을 수립하기 위해 기본 분석과 주요 이벤트를 포함합니다.
최적화 방향
이 전략은 더 이상 최적화 할 수 있습니다.
- 여러 사이클의 이동 평균의 조합을 증가시켜 여러 신호 그룹을 형성합니다.
- 트렌드 신호의 정확성을 확인하기 위해 볼륨과 변동성 같은 지표를 추가
- 매개 변수를 동적으로 최적화하기 위해 기계 학습 방법을 사용
- 적응적 인 스톱 손실 및 수익 메커니즘을 설정하십시오.
- 시장 정서, 투자자 관심 지표를 결합하는 것을 고려하십시오.
- 다양한 제품에서 다양성을 테스트합니다.
- 더 복잡한 브레이크아웃 지표 또는 모델을 포함합니다.
요약
요약하자면, 이 전략은 간단한 이동 평균 황금 십자가와 죽은 십자가를 사용하여 시장 추세를 판단하고 따르며 합리적인 스톱 손실과 수익을 취함으로써 위험을 제어합니다. 그것은 초보자을위한 트렌드를 따르는 전략으로 구현하기 쉽습니다. 매개 변수, 스톱 손실 메커니즘, 전략 성능을 향상시키기 위해 최적화 방법과 같은 측면에 대한 추가 연구와 최적화를받을 자격이 있습니다.
/*backtest
start: 2024-01-24 00:00:00
end: 2024-01-31 00:00:00
period: 10m
basePeriod: 1m
exchanges: [{"eid":"Futures_Binance","currency":"BTC_USDT"}]
*/

// This Pine Script™ code is subject to the terms of the Mozilla Public License 2.0 at https://mozilla.org/MPL/2.0/
// © KasperKvist

//@version=4
strategy("EURCHF Smart Money Strategy", overlay=true)

// Input Parameters
fastLength = input(50, title="Fast MA Length")
slowLength = input(200, title="Slow MA Length")
riskRewardRatio = input(2, title="Risk-Reward Ratio")

// Calculate Moving Averages
fastMA = sma(close, fastLength)
slowMA = sma(close, slowLength)

// Strategy Conditions
longCondition = crossover(fastMA, slowMA)
shortCondition = crossunder(fastMA, slowMA)

// Execute Strategy
strategy.entry("Long", strategy.long, when = longCondition)
strategy.entry("Short", strategy.short, when = shortCondition)

// Set Stop Loss and Take Profit
atrValue = atr(14)
stopLoss = atrValue * 1
takeProfit = atrValue * riskRewardRatio

strategy.exit("ExitLong", from_entry="Long", loss=stopLoss, profit=takeProfit)
strategy.exit("ExitShort", from_entry="Short", loss=stopLoss, profit=takeProfit)

// Plot Moving Averages
plot(fastMA, color=color.green, title="Fast MA")
plot(slowMA, color=color.red, title="Slow MA")
- 스톱 로스 추적 전략과 동적 가격 채널
- 동적 스톱 로스 볼링거 밴드 전략
- 반전 브레이크아웃 밴드패스 컴보 전략
- 동적 이동 평균 크로스오버 전략
- 전략에 따른 EMA의 크로스오버 트렌드
- RSI와 SMA를 기반으로 한 단기 거래 전략
- 모멘텀 브레이크업 내일 거래 전략
- KDJ 골든 크로스 장기 진입 전략
- 숨겨진 기회 에서의 돌파구 폭풍 전략
- 크로스 타임프레임 모멘텀 추적 전략
- 여러 시간 프레임에 걸쳐 피보트 슈퍼 트렌드 전략
- 양적 촛불 패턴 및 트렌드 다음 전략
- 슈퍼트렌드와 RSI 양적 거래 전략 결합
- 케이프타운 15분 촛불 발사 전략
- 이중 ATR 후속 정지 전략
- 쿨라마기 탈출 추적 전략
- 노로의 트렌드 이동 평균 전략의 극단적인 버전
- 재발동 모멘텀 거래 전략
- 전략에 따른 돈치안 트렌드
- 슈퍼트렌드 RSI EMA 크로스오버 전략