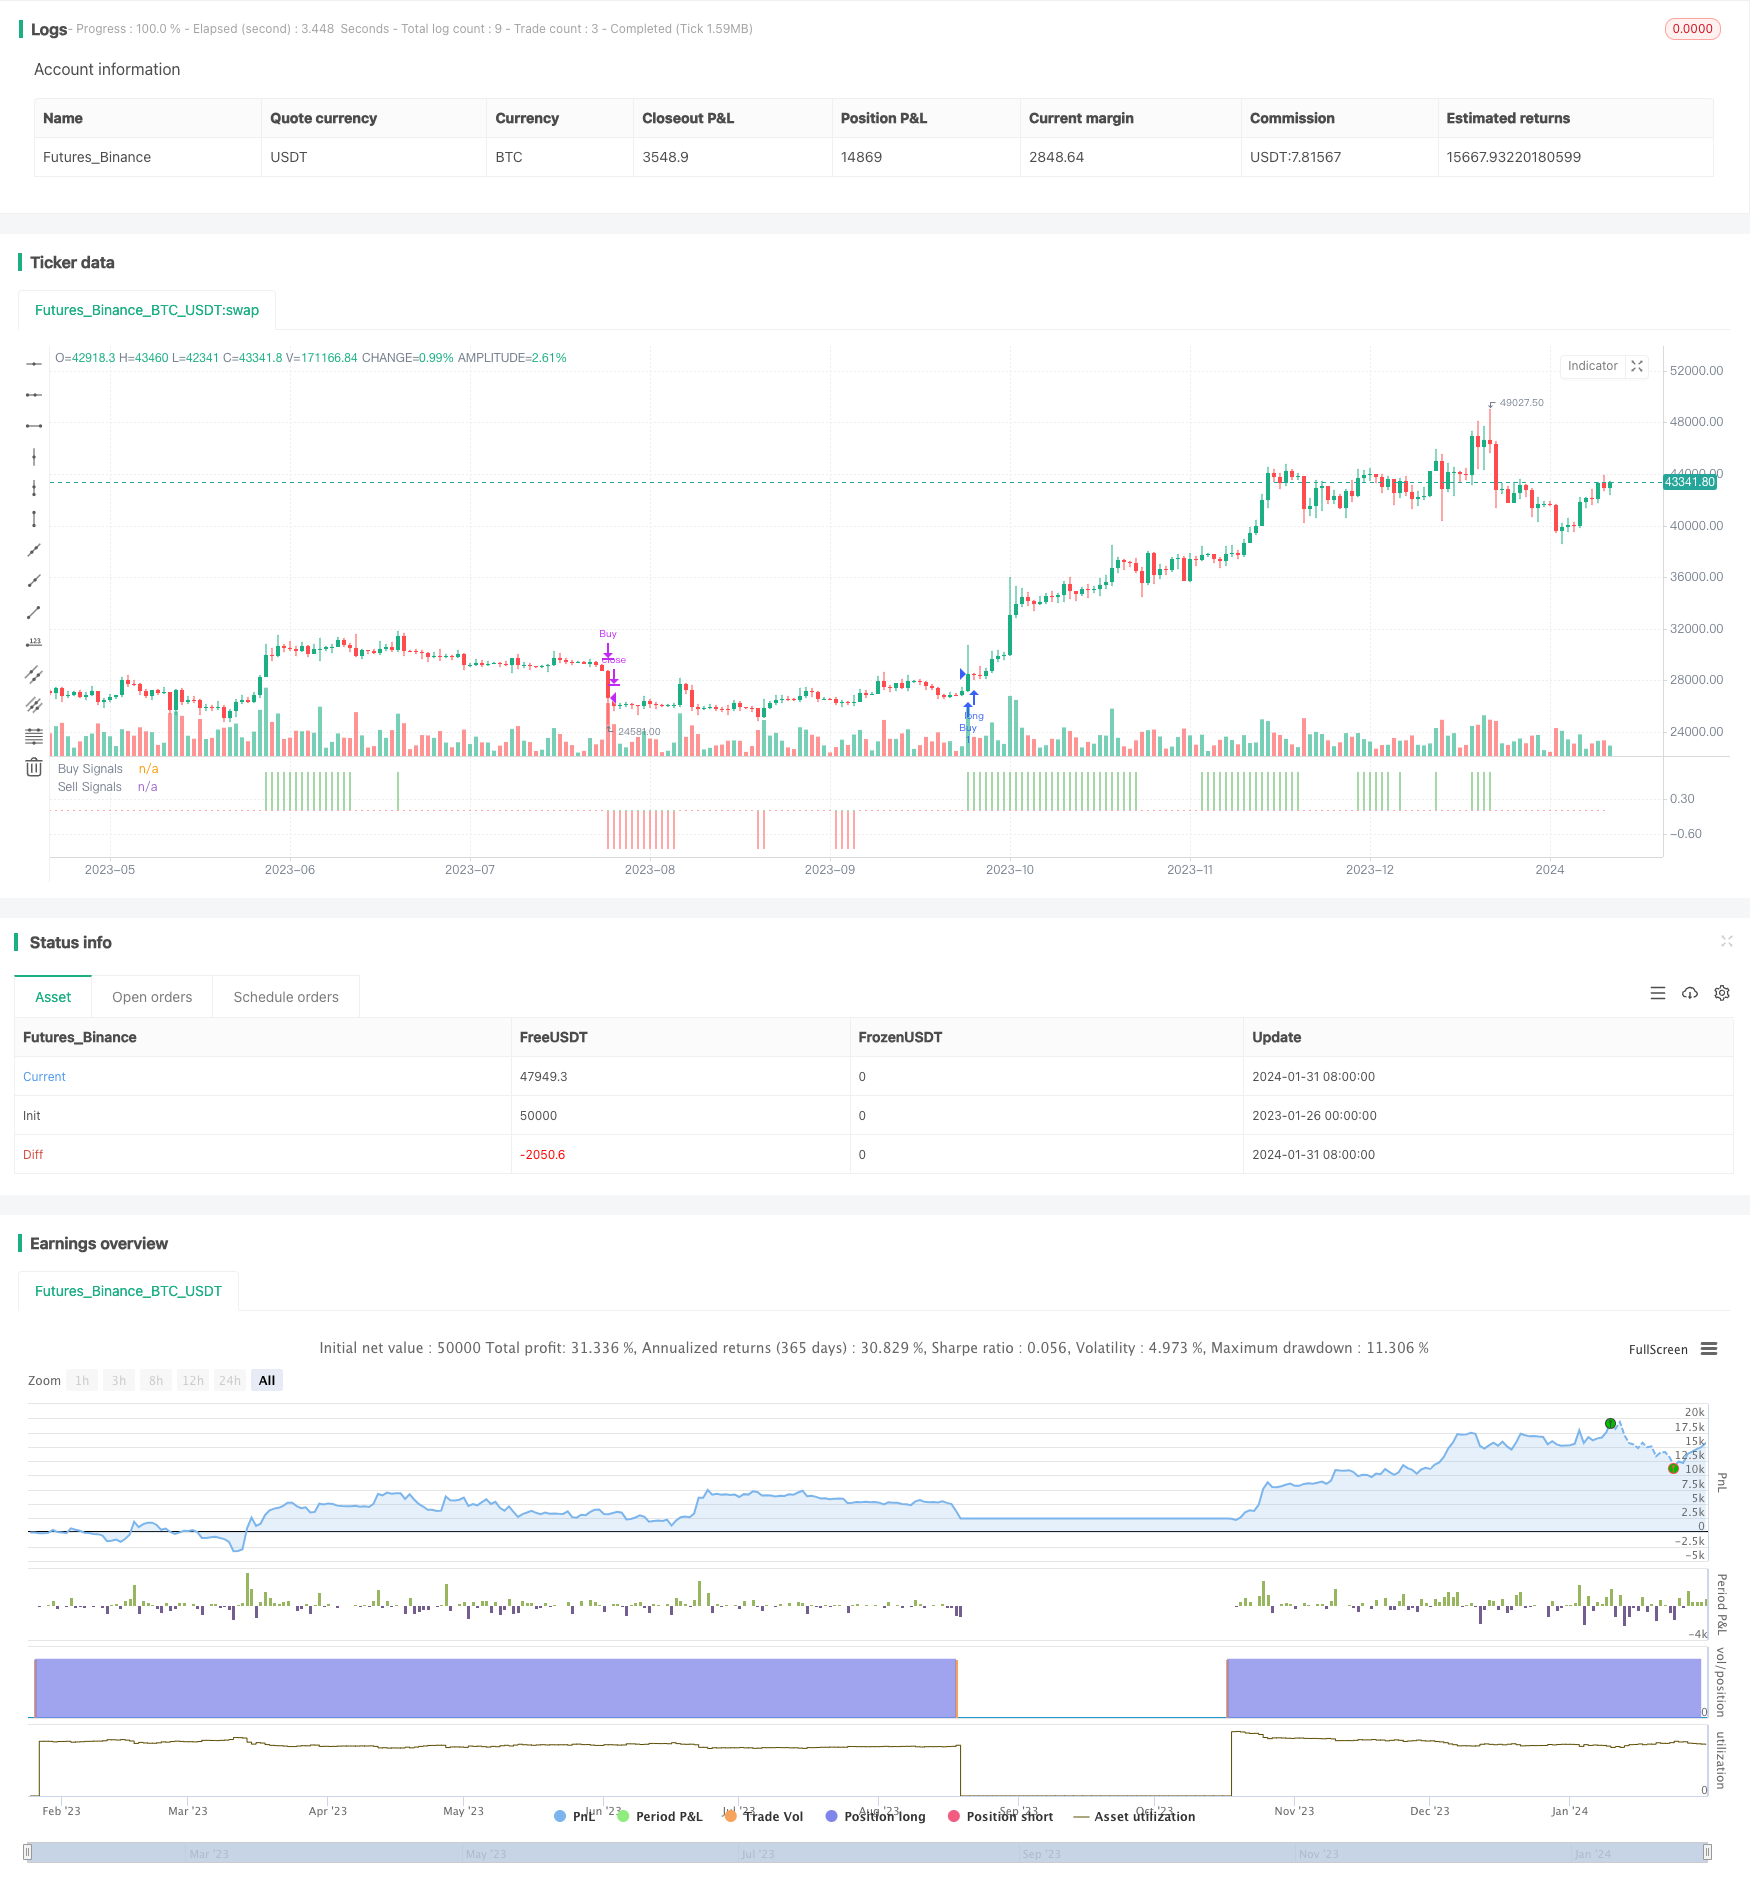
이중 돌파구 이동 평균 거래 전략
저자:차오장, 날짜: 2024-02-02 17:33:14태그:

전반적인 설명
이중 돌파구 이동 평균 거래 전략 (Dual Breakthrough Moving Average Trading Strategy) 은 여러 지표에 기반하여 구매 및 판매 신호를 생성하는 전략이다. 그것은 이동 평균, 지원/항상 지표, 트렌드 지표 및 과잉 구매/ 과잉 판매 지표를 통합하여 포괄적인 거래 시스템을 형성합니다.
전략 논리
신호 논리를 구매하세요
구매 신호는 다음 네 가지 조건이 동시에 유효해야 합니다.
- Parabolic SAR 지표 이상의 폐쇄 가격
- 롱 = 200의 간단한 이동 평균 이상의 폐쇄 가격
- MACD 지표의 MACD 라인 0 이상
- 길이가 50보다 7인 RSI 지표
네 가지 조건이 모두 충족되면 1의 구매 신호가 생성됩니다.
신호 논리를 팔자
판매 신호의 논리는 구매 신호의 정반대입니다. 다음 네 가지 조건이 필요합니다.
- Parabolic SAR 지표 이하의 폐쇄 가격
- 종점 가격은 길이가 200인 간단한 이동 평균보다 낮습니다.
- MACD 지표의 MACD 라인 0 이하
- 길이가 50 이하의 RSI 지표 = 7
네 가지 조건이 동시에 사실이라면 -1의 판매 신호가 생성됩니다.
출입 및 출입
진입 조건은 구매 및 판매 신호에 달려 있습니다. 긴 이동하기 위해 구매 신호가 1에 해당해야합니다. 짧은 이동하기 위해 판매 신호가 -1에 해당해야합니다.
두 가지 출구 조건이 있습니다. 하나는 신호가 변경되면 빠른 출구입니다. 다른 하나는 위치에서 빠져나가기 전에 반대 신호를 기다리는 것입니다. 예를 들어, 긴 후에 판매 신호를 기다리는 것입니다.
이점 분석
이중 돌파구 이동 평균 전략의 가장 큰 장점은 여러 지표의 조합으로 트렌드, 과잉 구매/ 과잉 판매 상태 등을 포괄적으로 판단 할 수 있습니다. 구체적으로 주요 장점은 다음과 같습니다.
- 파라볼리 SAR는 효과적인 돌파구를 지원/저항으로 판단합니다.
- 이동 평균은 전체 트렌드 방향을 결정하고, 역 트렌드 작전을 피합니다.
- MACD는 분명히 상승/하락 상태를 판단합니다.
- RSI는 과잉 구매/ 과잉 판매 위험을 피합니다.
- 여러 지표를 결합하면 안정성과 성공률이 크게 향상됩니다.
일반적으로 이 시스템은 초보자나 전문가의 자율 학습에 매우 적합합니다.
위험 분석
이 전략은 많은 장점을 가지고 있지만, 여전히 주의해야 할 몇 가지 위험이 있습니다.
- 매개 변수 최적화는 과도한 장착 및 열악한 실전 성능을 초래할 수 있습니다.
- 지표의 오차가 발생할 확률이 높고, 입력 전에 다시 확인해야 합니다.
- 스톱 로스 전략이 완벽하지 않아 포지션에 갇힐 가능성이 높습니다.
- 잠재적으로 과도한 거래 빈도, 증가하는 비용 및 미끄러짐.
이러한 위험을 해결하기 위해 다음과 같은 조치가 채택될 수 있습니다.
- 신호의 일관성을 보장하기 위해 필터를 추가합니다.
- 단일 거래 손실을 통제하기 위해 엄격한 스톱 로스
- 거래의 제어 번호 및 거래 빈도
- 과잉착착을 방지하기 위한 테스트 파라미터 조합
최적화 방향
이 전략을 더 이상 최적화 할 수있는 큰 잠재력이 있습니다.
- 신호 강도를 예측하기 위해 기계 학습 모델을 추가합니다.
- 중요한 뉴스 사건의 영향을 판단하기 위해 텍스트 분석을 포함합니다.
- 시장 구조 지표를 추가하고 기간별로 전략을 조정합니다.
- 트레일링 스톱 손실이나 쇼크 스톱 손실과 같은 스톱 손실 방법을 최적화합니다.
- 최적의 쌍을 찾기 위해 매개 변수 조정과 조합
위의 측면의 개선으로, 전략의 성능은 라이브 거래 애플리케이션에 더 향상될 수 있습니다.
결론
이중 돌파구 이동 평균 거래 전략은 여러 지표를 결합하는 다재다능한 전략이다. 진입과 출구를 결정하기 위해 트렌드, 지원/항상, 과잉 구매/ 과잉 판매 지표를 통합한다. 보완적인 효과와 포괄적인 판단으로, 전략은 심도 있는 연구와 응용 가치가 있는 양적 거래에 대한 탁월한 아이디어 모델을 제공한다.
/*backtest
start: 2023-01-26 00:00:00
end: 2024-02-01 00:00:00
period: 1d
basePeriod: 1h
exchanges: [{"eid":"Futures_Binance","currency":"BTC_USDT"}]
*/

//@version=4
//Original Indicator by @Shizaru - simply made into a strategy!

strategy("Simple Buy/Sell Strategy", overlay=false)
psar = sar(0.02,0.02,0.2)
c1a = close > psar
c1v = close < psar

malen = input(200, title="MA Length")
mm200 = sma(close, malen)
c2a = close > mm200
c2v = close < mm200

fast = input(12, title="Fast EMA Length")
slow = input(26, title="Slow EMA Length")
[macd,signal,hist] = macd(close, fast,slow, 9)
c3a = macd >= 0
c3v = macd <= 0

rsilen = input(7, title="RSI Length")
th = input(50, title="RSI Threshold")
rsi14 = rsi(close, rsilen)
c4a = rsi14 >= th
c4v = rsi14 <= th

buy = c1a and c2a and c3a and c4a ? 1 : 0
sell = c1v and c2v and c3v and c4v ? -1 : 0

longtrades = input(true, title="Long Trades")
shorttrades = input(false, title="Short Trades")
quickexit = input(false, title="Quick Exits")

strategy.entry("Buy", strategy.long, when=buy==1 and longtrades==true)
strategy.close("Buy", when=quickexit==true ? buy==0 : sell==-1)
strategy.entry("Sell", strategy.short, when=sell==-1 and shorttrades==true)
strategy.close("Sell", when=quickexit==true ? sell==0 : buy==1)

plot(buy, style=plot.style_histogram, color=color.green, linewidth=3, title="Buy Signals")
plot(sell, style=plot.style_histogram, color=color.red, linewidth=3, title="Sell Signals")
- 자기 적응형 양자 그리드 거래 전략
- 멀티 타임프레임 이치모쿠, MACD 및 DMI 결합 전략
- 가격차이에 기반한 트렌드 거래 전략
- 슈퍼트렌드 비트코인 장선 전략
- 이동 평균 및 촛불 패턴을 가진 트렌드를 따르는 전략
- 이치모쿠 클라우드 브레이크와 ADX 인덱스에 기반한 양적 거래 전략
- 볼링거 밴드와 이동 평균의 조합 전략
- 게으른 곰 압축 모멘텀 전략
- 트렌드 예측 이중 이동 평균 전략
- 이중 이동 평균 역전 전략
- 눈부신 볼트 트렌드 전략
- VRSI 및 MARSI 전략
- 도지 패턴에 기반한 손해를 멈추고 수익을 취하는 전략
- 이중 기하급수적 이동 평균 트렌드 전략
- DMI 잔액 구매/판매 전략
- 이동 평균 이동 봉투 전략
- 시장 잠재력 이치모쿠 상승 구름 전략
- 전략에 따른 EMA RSI 숨겨진 격차 추세
- 포용 패턴과 양적 지표에 기초한 고급 트렌드 추적 전략
- 알파트렌드 이중 추적 전략