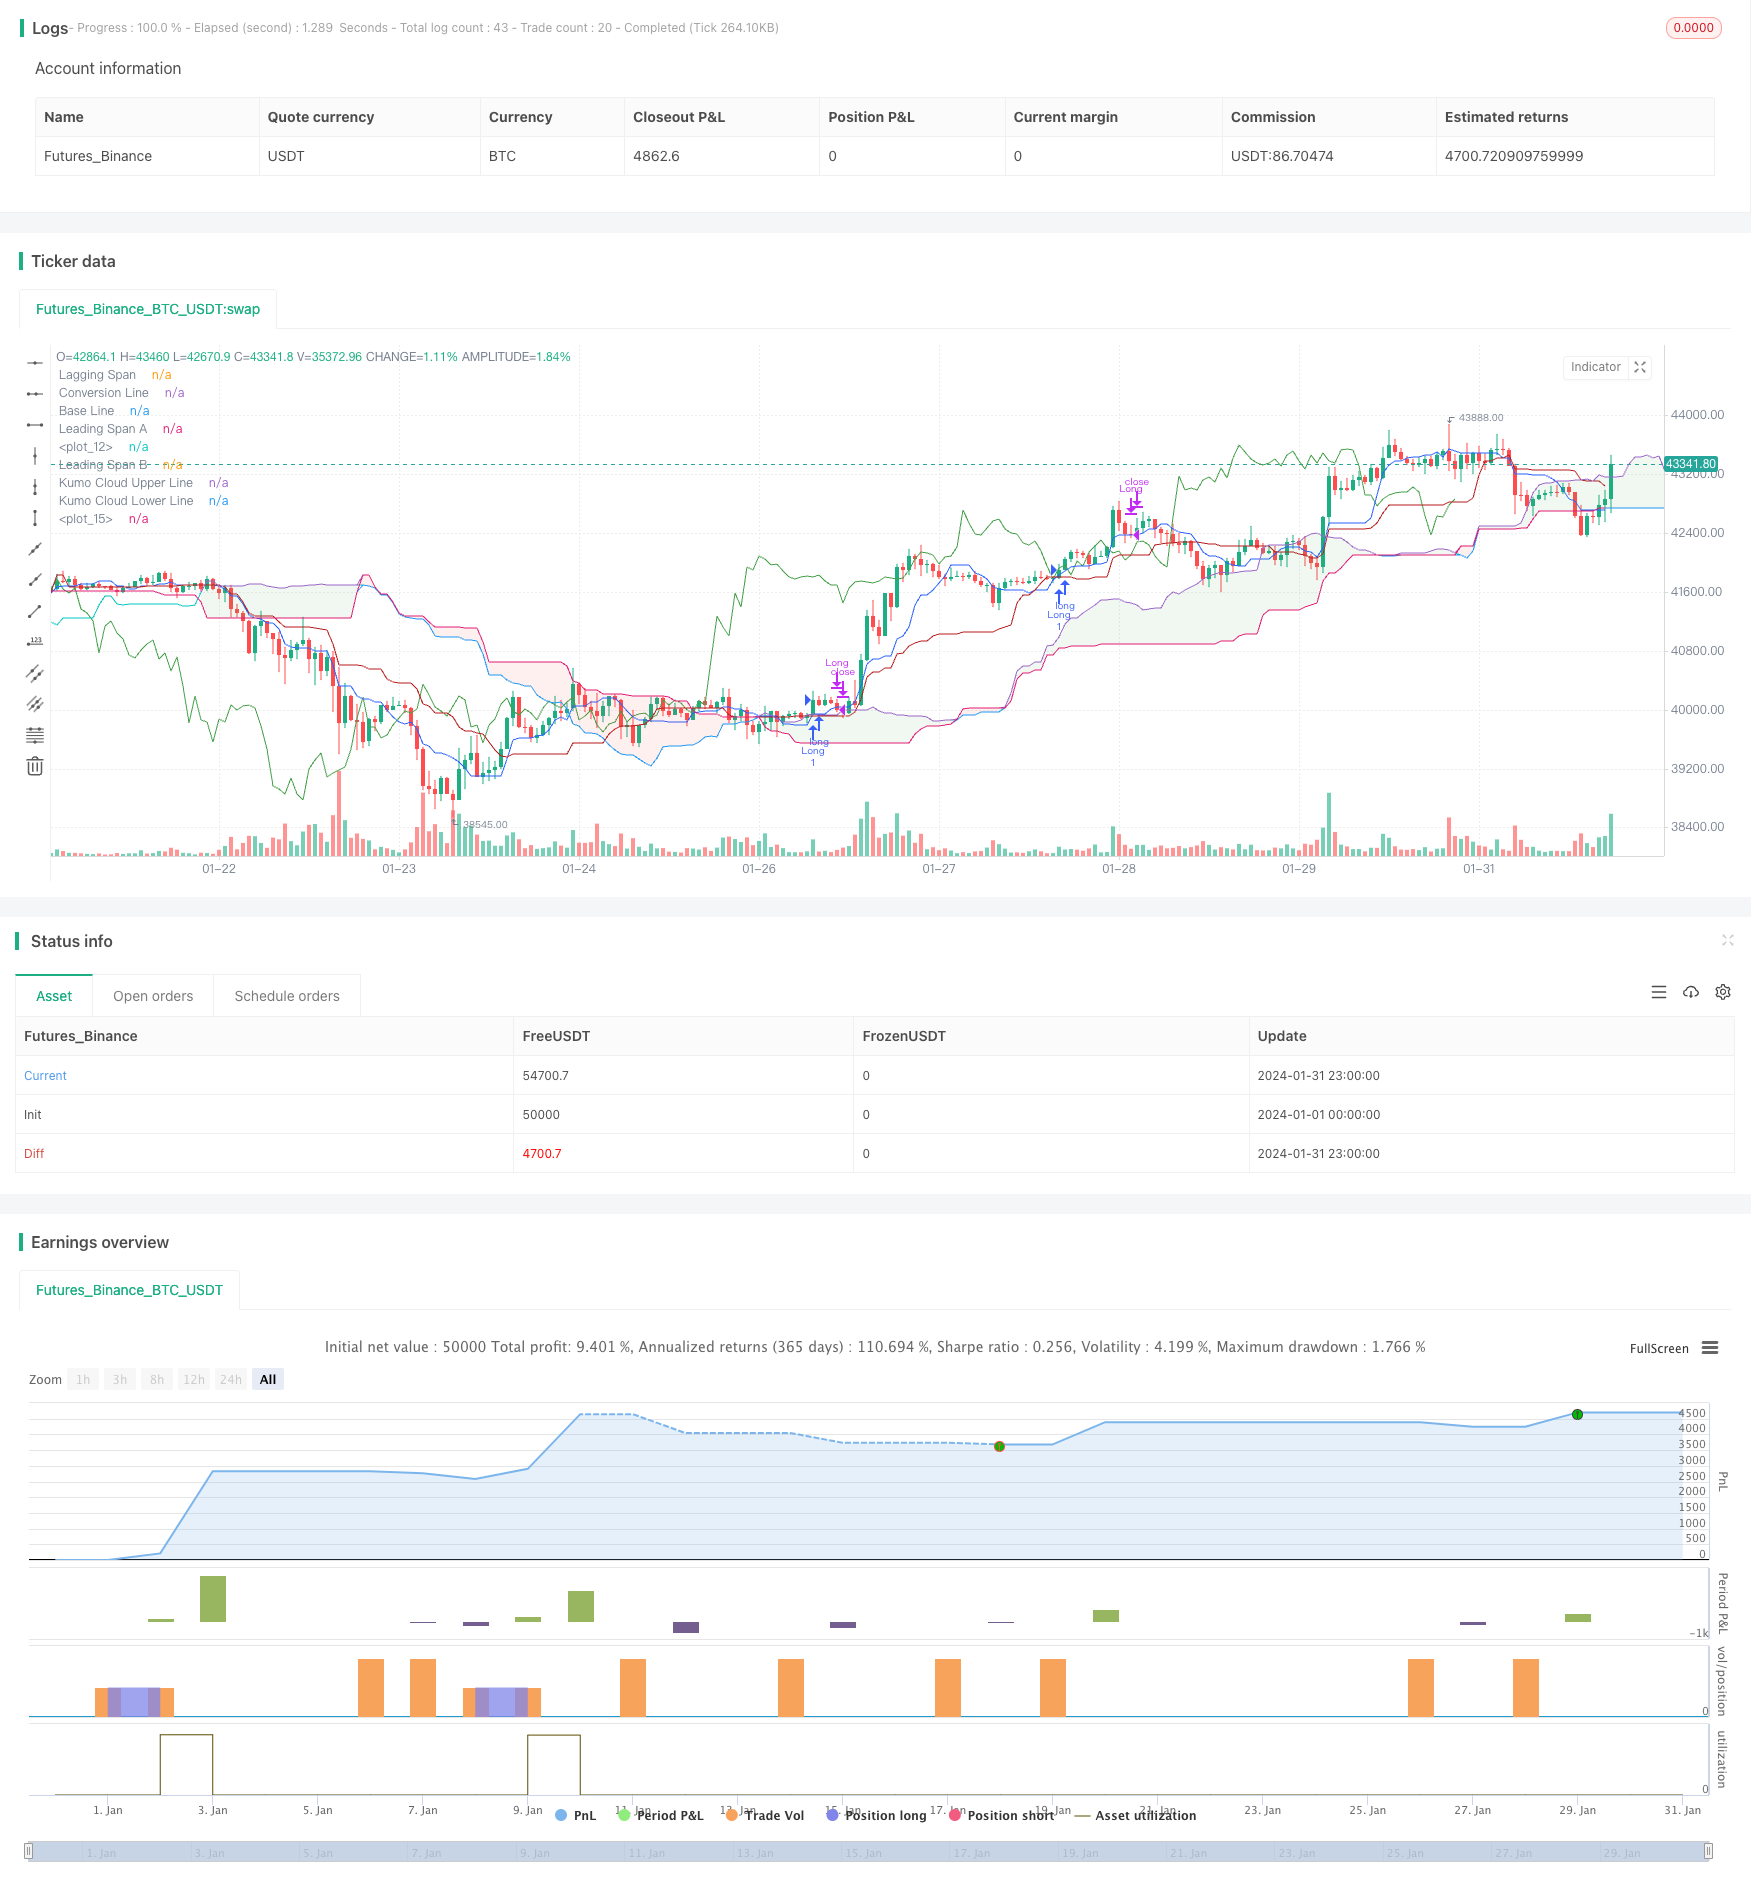
이치모쿠 클라우드 트렌드 전략
저자:차오장, 날짜: 2024-02-27 16:41:02태그:

전반적인 설명
이치모쿠 클라우드 트렌드 추후 전략은 기술 분석 전략이다. 이치모쿠 클라우드의 다섯 가지 지표 라인을 사용하여 시장 트렌드 방향, 지원/저항 수준 및 진입 시기를 결정한다.
원칙
핵심 지표 라인에는 다음이 포함됩니다.
- 전환선: 9일 평균 최상위와 최하위, 단기 트렌드를 반영합니다.
- 기본선: 중장기 트렌드를 반영한 최대 최대 및 최저 최저의 26일 평균.
- 리딩 스판 A: 중장기 지지율과 저항율을 판단하여 전환과 기본선 사이의 평균, 26일 앞으로 이동.
- 리딩 스판 B: 52일 평균 최상위와 최저 하위, 26일 앞으로 이동, 장기적 지지와 저항을 판단합니다.
- 뒤떨어진 기간: 가격은 트렌드 추진력을 반영하여 26 일 후로 이동했습니다.
전환선이 기본선을 넘을 때 구매 신호가 발동됩니다. 기본선을 넘을 때 판매 신호가 발동됩니다. 가격 이상의 지연 스펜과 녹색 구름 색은 황금 추세를 나타냅니다.
트렌드 방향은 전환과 기본 라인의 관계를 기반으로 판단합니다. 예를 들어 전환 라인이 기본 라인을 상향으로 돌파하면 황금 트렌드를 신호합니다. 지연 스펜이 가격보다 높으면 긴 진입이 발생합니다.
Stop loss 또는 Leading Span A 또는 Base Line에 기반하여 수익을 취하십시오. Stop loss를 위해 Base Line가 선택되면 가격이 Base Line 아래로 넘어갈 때 포지션을 닫습니다.
이점 분석
이점으로는 다음과 같습니다.
- 더 높은 정확성을 위해 여러 지표를 사용하십시오.
- 리딩 스판은 지지/저항 수준을 예측합니다.
- 뒤떨어진 스판은 거짓 탈출을 피하기 위해 추진력을 확인합니다.
- 중장기 지표로서의 기본선은 노이즈를 줄입니다.
위험 과 개선
주요 위험은 잘못된 신호입니다. 최적화 제안:
- 평균 기간을 조정해서 민감도를 정밀하게 조정하세요.
- MACD, 볼링거 밴드 같은 다른 필터를 추가합니다.
- 중장기 트렌드를 따라 거래 빈도가 낮습니다.
결론
이치모쿠 클라우드는 시장 트렌드를 판단하기 위해 지표를 결합합니다. 단기 동력과 중장기 트렌드를 모두 고려합니다. 변환 및 기본 라인은 거래 신호를 결정합니다. 기본 라인은 이익을 잠금하고 위험을 제어하기 위해 Stop Loss를 설정합니다. 이 전략은 중장기 트렌드를 따르는 데 적합합니다.
/*backtest
start: 2024-01-01 00:00:00
end: 2024-01-31 23:59:59
period: 1h
basePeriod: 15m
exchanges: [{"eid":"Futures_Binance","currency":"BTC_USDT"}]
*/

//@version=5
strategy(title="Ichimoku Cloud - BitBell", shorttitle="Ichimoku Cloud - BitBell", overlay=true)
conversionPeriods = input.int(9, minval=1, title="Conversion Line Length")
basePeriods = input.int(26, minval=1, title="Base Line Length")
laggingSpan2Periods = input.int(52, minval=1, title="Leading Span B Length")
displacement = input.int(26, minval=1, title="Lagging Span")
donchian(len) => math.avg(ta.lowest(len), ta.highest(len))
conversionLine = donchian(conversionPeriods)
baseLine = donchian(basePeriods)
leadLine1 = math.avg(conversionLine, baseLine)
leadLine1bbbbb = math.avg(conversionLine, baseLine)[displacement - 1]
plot(leadLine1bbbbb)
leadLine2 = donchian(laggingSpan2Periods)
leadLine2bbbbbb = donchian(laggingSpan2Periods)[displacement - 1]
plot(leadLine2bbbbbb)

support = leadLine1bbbbb > leadLine2bbbbbb
Resistance = leadLine1bbbbb < leadLine2bbbbbb


TrailStop = input.string(title='Choose Trail Line', options=["ConversionLine", "BaseLine"], defval="ConversionLine")


var stopLong = 0.0
var stopShort = 0.0
var TagetLong = 0.0
var TargetShort = 0.0


if close > leadLine1bbbbb and close > leadLine2bbbbbb and conversionLine[1] <= baseLine[1] and conversionLine > baseLine and close > conversionLine and support
	strategy.entry("Long",strategy.long)
	stopLong := conversionLine
// if close < stopLong and strategy.position_size > 0
// 	strategy.close("Long")
// 	stopLong := 0.0
if (close < conversionLine and strategy.position_size > 0) and (TrailStop == 'ConversionLine')
	strategy.close("Long")
	stopLong := 0.0
if (close < baseLine and strategy.position_size > 0) and (TrailStop == 'BaseLine')
	strategy.close("Long")
	stopLong := 0.0

if close < leadLine1bbbbb and close < leadLine2bbbbbb and conversionLine[1] >= baseLine[1] and conversionLine < baseLine and close < conversionLine and Resistance
	strategy.entry("Short",strategy.short)
	stopShort := conversionLine
// if close > stopShort and strategy.position_size < 0
// 	strategy.close("Short")
// 	stopShort := 0.0
if (close > conversionLine and strategy.position_size < 0) and (TrailStop == 'ConversionLine')
	strategy.close("Short")
	stopShort := 0.0
if (close > baseLine and strategy.position_size < 0) and (TrailStop == 'BaseLine')
	strategy.close("Short")
	stopShort := 0.0
// if close >= 1.0006 * strategy.position_avg_price and strategy.position_size > 0
// 	strategy.close("Long")
// 	stopLong := 0.0
plot(conversionLine, color=#2962FF, title="Conversion Line")
plot(baseLine, color=#B71C1C, title="Base Line")
plot(close, offset = -displacement + 1, color=#43A047, title="Lagging Span")
p1 = plot(leadLine1, offset = displacement - 1, color=#A5D6A7,
	 title="Leading Span A")
p2 = plot(leadLine2, offset = displacement - 1, color=#EF9A9A,
	 title="Leading Span B")
plot(leadLine1 > leadLine2 ? leadLine1 : leadLine2, offset = displacement - 1, title = "Kumo Cloud Upper Line", display = display.none)
plot(leadLine1 < leadLine2 ? leadLine1 : leadLine2, offset = displacement - 1, title = "Kumo Cloud Lower Line", display = display.none)
fill(p1, p2, color = leadLine1 > leadLine2 ? color.rgb(67, 160, 71, 90) : color.rgb(244, 67, 54, 90))
더 많은
- 시간 기반 ATR Stop Loss 구매 전략
- 이분법 모멘텀 브레이크업 역전 전략
- 격차 해소 전략
- 피보나치 리트레이싱 타겟과 함께 ATR 트레일링 스톱 전략
- 볼링거 밴드 브레이크 트렌드 거래 전략
- 이동 평균 회전 전략에 기초한
- 골든 크로스오버를 기반으로 한 단기적 돌파구 전략
- 압축된 지표에 기초한 다시간 프레임 트렌드 거래 전략
- 모멘텀 라인 크로스오버 EMA 9 주식 MACD 전략
- 양적 오스실레이션 지표 조합 전략
- 일내 두 개의 이동 평균 거래 전략
- 마야 의 보물 사냥 가이드
- 이동 평균에 기초한 트렌드 추적 전략
- 전략에 따른 EMA의 크로스 트렌드
- 이중 이동 평균 크로스오버 전략
- 볼링거 밴드 추적 전략
- 급속하고 느린 이동 평균의 크로스오버 전략
- 핫 주식에 대한 고급 듀얼 타임프레임 트렌드 추적 전략
- 컴보 양적 트렌드 추적 전략
- 멋진 오시레이터 이중 스토카스틱 필터드 디버전스 거래 전략