HODL LINE
Penulis:ChaoZhang, Tarikh: 2022-05-20 16:58:28Tag:HMA
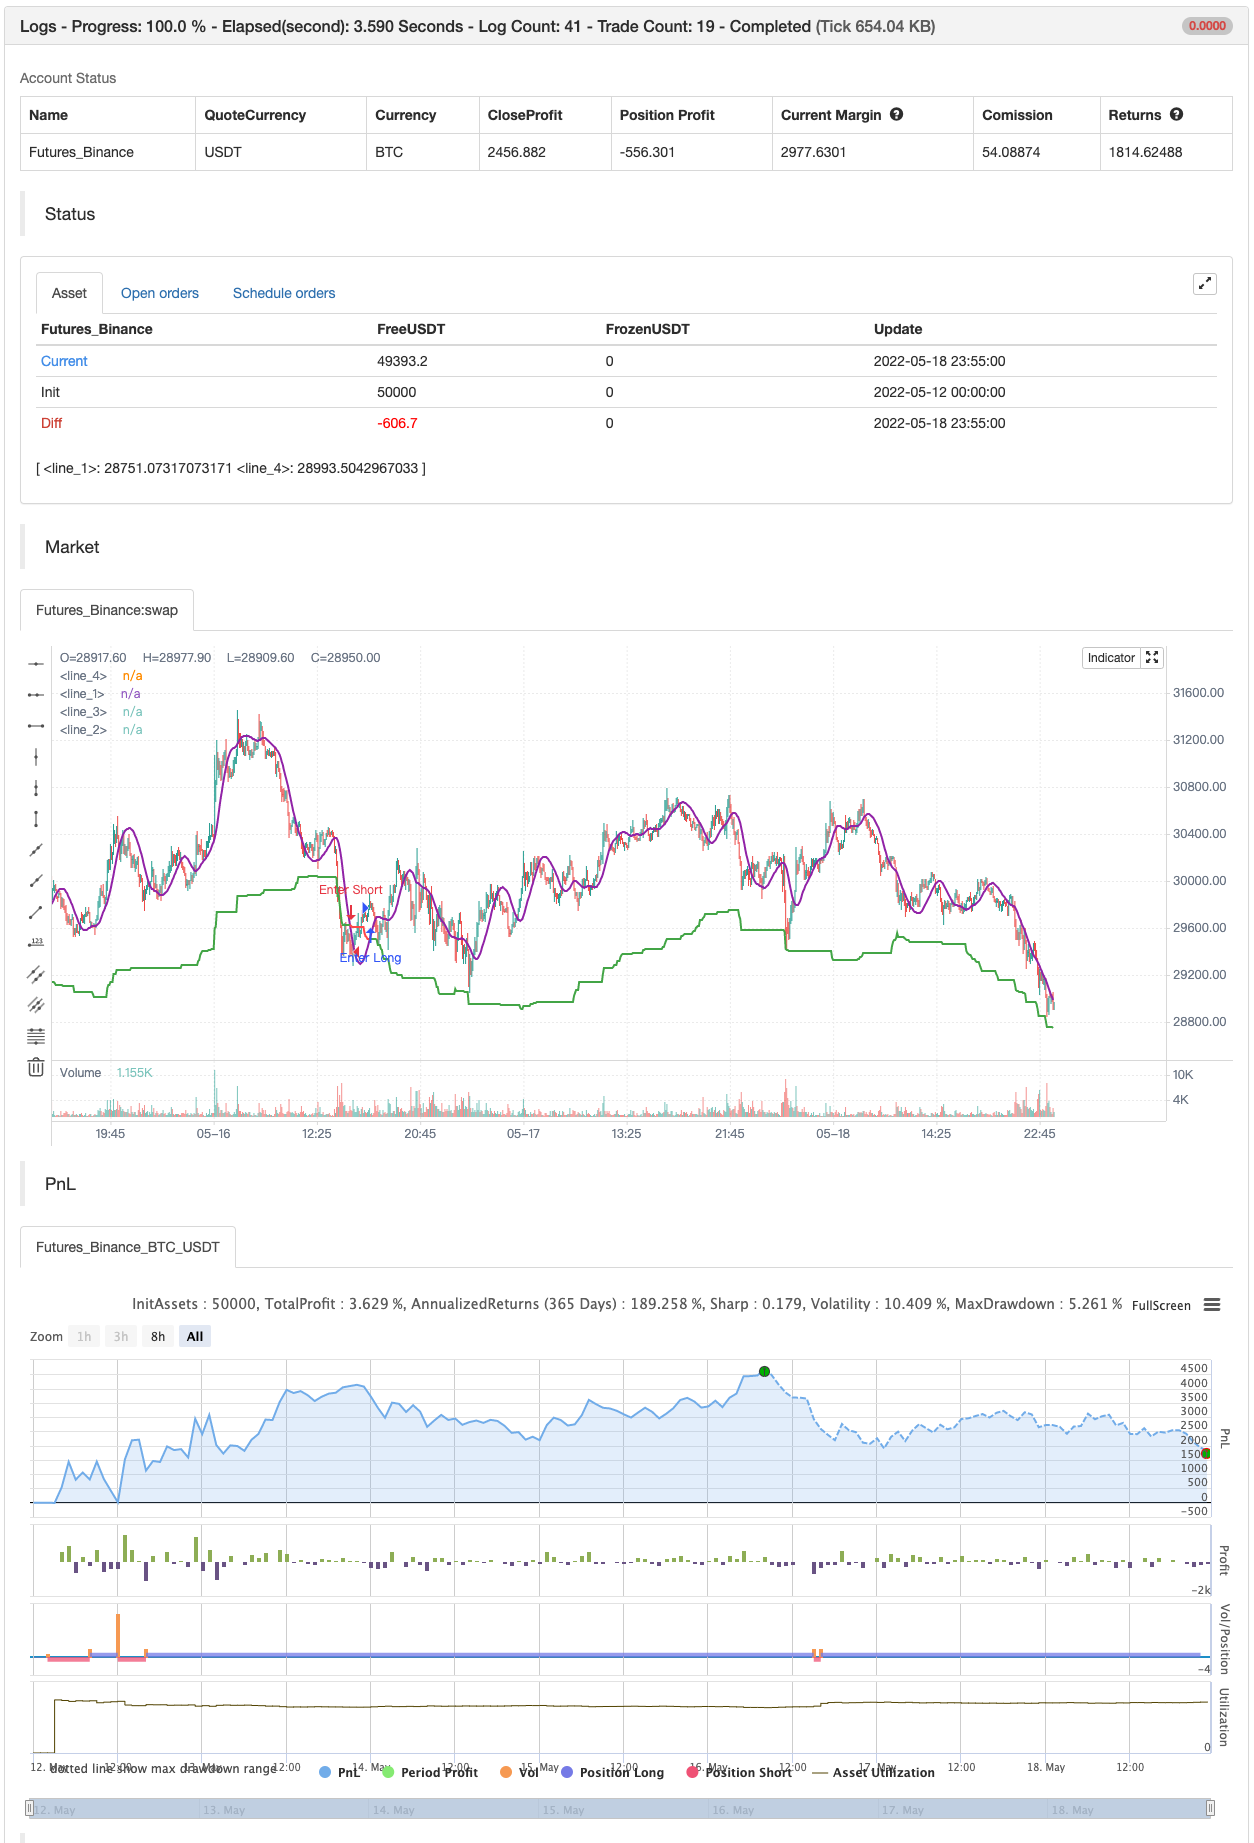
Indikator ini menentukan tempoh pasaran lembu apabila pelabur beli dan pegang boleh memegang aset, dan tempoh pasaran beruang apabila mereka harus mengelakkannya. Secara teknikal, penunjuk ini adalah penapis trend asimetrik yang bertujuan untuk memperhitungkan fakta bahawa penjualan pasaran cenderung lebih tajam daripada trend menaik.
Cara Menggunakan Garis seperti langkah adalah penapis trend utama. Ia berwarna hijau dalam trend menaik dan merah dalam trend menurun. Apabila penyelarasan diaktifkan, sebagai tambahan kepada penapis trend, penunjuk merangka garis ungu. Ini adalah Purata Bergerak Hull (HMA) harga. Dalam kes ini, penunjuk menggunakan garis ini dan bukannya harga untuk mencari persimpangan dengan penapis trend. Apabila harga atau garis halus melintasi penapis trend di atas, ia adalah isyarat trend menaik. Indikator menandakan persimpangan tersebut dengan bulatan hijau. Ia juga mewarnai latar belakang carta hijau dalam tren menaik. Harga atau garis ungu yang melintasi penapis trend di bawah bermaksud isyarat trend menurun. Isyarat trend menurun ditunjukkan sebagai bulatan merah. Latar belakang carta dalam trend menurun menjadi merah.
Tetapan
Sensitiviti
Ujian belakang

/*backtest
start: 2022-05-12 00:00:00
end: 2022-05-18 23:59:00
period: 5m
basePeriod: 1m
exchanges: [{"eid":"Futures_Binance","currency":"BTC_USDT"}]
*/

// This source code is subject to the terms of the Mozilla Public License 2.0 at https://mozilla.org/MPL/2.0/
// © AstrideUnicorn

// Asymmetrical Trend Filter aka HODL Line

//@version=5
indicator("HODL LINE", overlay=true)

// initialize indicator period parameter and the asymmetry paramter
length = 300
asymmetry =  0.05 //input.float(defval=0.05,step=0.01, minval=0.01, maxval=0.3)

// script inputs
sensitivity = input.string(defval="Hold Short Term", title="Sensitivity", options=['Super Sensitive','Hold Short Term', 'Hold Medium Term', 'Hold Long Term'])
use_smoothing = input.bool(defval=true, title="Use Smoothing")


// Set the indicator period based on the choosen sensitivity
if sensitivity == 'Super Sensitive'
    length:=50

if sensitivity == 'Hold Short Term'
    length:=100

if sensitivity == 'Hold Medium Term'
    length:=300

if sensitivity == 'Hold Long Term'
    length:=500

// Calculate HODL Line - an assymetric trend filter
HODL_line = (ta.highest(close,length) + ta.lowest(close,length))/(2.0 + asymmetry)

// Calculate smoothed price time series
smoothed_price = ta.hma(close,50)

// Use closing price or smoothed price based on the choosen option for smoothing
price_model = use_smoothing ? smoothed_price : close

// Define conditional color for the HODL Line
hodl_line_color = price_model >= HODL_line ? color.green : color.red

// define the HODL Line crossing conditions
crossing_condition_bull = ta.crossover(price_model, HODL_line)
crossing_condition_bear = ta.crossunder(price_model, HODL_line)

// plotting
plot(HODL_line, color = hodl_line_color, linewidth = 2)

plot(crossing_condition_bull?HODL_line:na, color = color.new(color.green,40), style= plot.style_circles, linewidth = 20)
plot(crossing_condition_bear?HODL_line:na, color = color.new(color.red,40), style= plot.style_circles, linewidth = 20)

bgcolor(color.new(hodl_line_color,80))

plot(use_smoothing?price_model:na, color=color.purple, linewidth=2)

if crossing_condition_bull
    strategy.entry("Enter Long", strategy.long)
else if crossing_condition_bear
    strategy.entry("Enter Short", strategy.short)
- Strategi pengukuran silang purata bergerak dinamik yang menggabungkan pelbagai penunjuk
- Strategi Bollinger Movement Penembusan Berbilang Masa digabungkan dengan Strategi Hull
- Strategi pengukuran purata bergerak Hull yang disambungkan dengan dua garis rata
- Strategi untuk menentukan trend EMA yang dipengaruhi oleh Hull Moving Average
- Fleksibel pelbagai kitaran strategi persimpangan linear canggih
- Strategi perdagangan merentasi garis rata untuk menyesuaikan harga
- Strategi pengesanan trend stop loss dinamik dengan pelbagai indikator
- HMA mengoptimumkan strategi dagangan kuantitatif berbilang kitaran dengan gabungan stop loss dinamik
- Strategi capaian trend rata-rata komposit tinggi dan momentum pasaran
- Strategi persimpangan purata bergerak Hull pelbagai kitaran
- Strategi gabungan RSI dan MA
- Shannon Entropy V2
- SUPERTREND ATR Dengan Pengangkutan Hentikan Hilang
- Aliran Volume v3
- Crypto niaga hadapan scalping jam dengan ma & rsi - ogcheckers
- ATR dihaluskan
- Pencari Blok Perintah
- TrendScalp-FractalBox-3EMA
- Isyarat QQE
- U-bit grid amplitude penyaringan
- CM MACD Indikator Sesuai - Kerangka Masa Berbilang - V2
- 2 Pengesanan Arah Rata-rata Bergerak Warna
- Scalping PullBack Tool R1
- Strategi Beli&Jual bergantung kepada AO+Stoch+RSI+ATR
- EMA TREND CLOUD
- Rasio Tenaga Arah RedK Volume-Pengcepat
- Donchian Breakout tiada cat semula
- Bar Momentum RedK
- SuperJump Turn Back Bollinger Band
- Trend Fukuiz
- BOT Johny