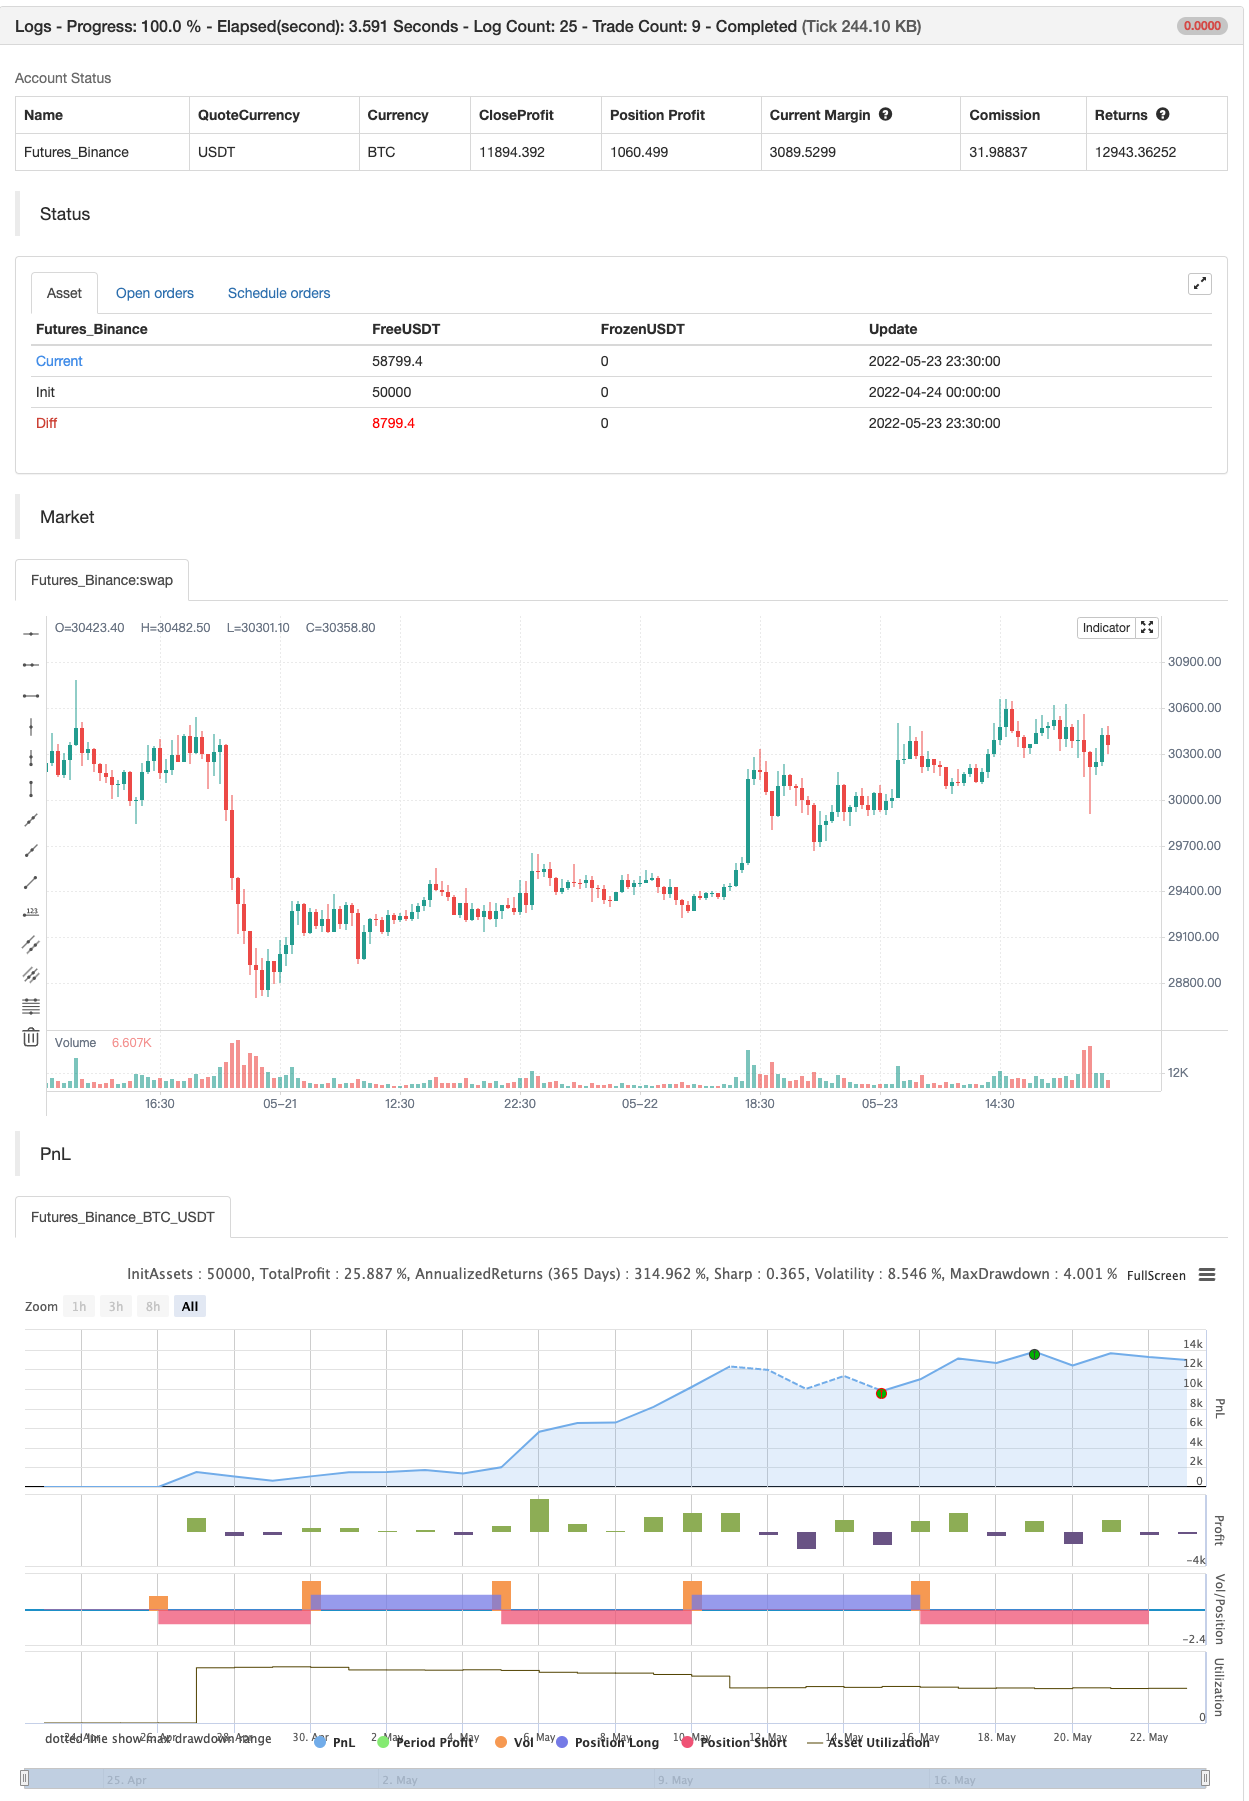
Stochastic + RSI, Strategi Ganda
Penulis:ChaoZhang, Tarikh: 2022-05-25 16:12:14Tag:STOCHRSI
Strategi ini menggabungkan strategi RSI klasik untuk menjual apabila RSI meningkat melebihi 70 (atau membeli apabila ia jatuh di bawah 30), dengan strategi Stochastic Slow klasik untuk menjual apabila osilator Stochastic melebihi nilai 80 (dan membeli apabila nilai ini di bawah 20).
Strategi mudah ini hanya diaktifkan apabila kedua-dua RSI dan Stochastic berada bersama dalam keadaan overbought atau oversold. carta satu jam S & P 500 bekerja dengan baik baru-baru ini dengan strategi ganda ini.
Dengan cara ini strategi ini tidak boleh dikelirukan dengan
Semua perdagangan melibatkan risiko yang tinggi; prestasi masa lalu tidak semestinya menunjukkan hasil masa depan.
Ujian belakang

/*backtest
start: 2022-04-24 00:00:00
end: 2022-05-23 23:59:00
period: 30m
basePeriod: 15m
exchanges: [{"eid":"Futures_Binance","currency":"BTC_USDT"}]
*/

//@version=2
strategy("Stochastic + RSI, Double Strategy (by ChartArt)", shorttitle="CA_-_RSI_Stoch_Strat", overlay=true)

// ChartArt's Stochastic Slow + Relative Strength Index, Double Strategy
//
// Version 1.0
// Idea by ChartArt on October 23, 2015.
//
// This strategy combines the classic RSI
// strategy to sell when the RSI increases
// over 70 (or to buy when it falls below 30),
// with the classic Stochastic Slow strategy
// to sell when the Stochastic oscillator
// exceeds the value of 80 (and to buy when
// this value is below 20).
//
// This simple strategy only triggers when
// both the RSI and the Stochastic are together
// in overbought or oversold conditions.
//
// List of my work:
// https://www.tradingview.com/u/ChartArt/


///////////// Stochastic Slow
Stochlength = input(14, minval=1, title="lookback length of Stochastic")
StochOverBought = input(80, title="Stochastic overbought condition")
StochOverSold = input(20, title="Stochastic oversold condition")
smoothK = input(3, title="smoothing of Stochastic %K ")
smoothD = input(3, title="moving average of Stochastic %K")
k = sma(stoch(close, high, low, Stochlength), smoothK)
d = sma(k, smoothD)


///////////// RSI
RSIlength = input( 14, minval=1 , title="lookback length of RSI")
RSIOverBought = input( 70  , title="RSI overbought condition")
RSIOverSold = input( 30  , title="RSI oversold condition")
RSIprice = close
vrsi = rsi(RSIprice, RSIlength)


///////////// Double strategy: RSI strategy + Stochastic strategy

if (not na(k) and not na(d))
    if (crossover(k,d) and k < StochOverSold)
        if (not na(vrsi)) and (crossover(vrsi, RSIOverSold))
            strategy.entry("LONG", strategy.long, comment="StochLE + RsiLE")


if (crossunder(k,d) and k > StochOverBought)
    if (crossunder(vrsi, RSIOverBought))
        strategy.entry("SHORT", strategy.short, comment="StochSE + RsiSE")


//plot(strategy.equity, title="equity", color=red, linewidth=2, style=areabr)
Kandungan berkaitan
- Strategi Piramid Pintar Berbilang Indikator
- Strategi pelacakan perdagangan trend silang pelbagai penunjuk: analisis kuantitatif berdasarkan sistem yang lemah dan rata-rata secara rawak
- Strategi isyarat RSI Random Blink
- Strategi Beli&Jual bergantung kepada AO+Stoch+RSI+ATR
- Strategi Pengesanan Tren Daerah Dinamik Ganda
- Strategi dagangan dinamika tren multilineal yang digabungkan dengan sistem pengurusan risiko
- Bollinger Bands RSI Stochastic Extreme Strategi
- Strategi penggabungan pelbagai faktor
- EMA/SMA strategi pengesanan trend komprehensif pelbagai penunjuk
- Rusuhan momentum yang dipertingkatkan dan strategi perdagangan kuantitatif yang menyimpang secara rawak
Lebih lanjut
- Saluran SSL
- Strategi Suite Hull
- SAR Parabolik Beli dan Jual
- Pivot Berasaskan Trailing Maxima & Minima
- Nick Rypock Berbalik belakang (NRTR)
- ZigZag PA Strategi V4.1
- Beli/Jual dalam hari
- Broken Fractal: impian seseorang yang rosak adalah keuntungan anda!
- Maximizer Keuntungan PMax
- Strategi Kemenangan yang Sempurna
- Strategi Swing Hull/rsi/EMA
- Alat Perdagangan Swing Scalping R1-4
- BEST Engulfing + Breakout Strategi
- Bollinger Awesome Alert R1
- Plugin yang disambungkan ke pelbagai bursa
- Ganjaran segitiga (menghasilkan mata wang kecil dengan harga yang berbeza)
- bybit reverse contract dynamic grid (grid khas)
- Peringatan TradingView untuk MT4 MT5 + pembolehubah dinamik
- Siri Matriks
- Super Scalper - 5 minit 15 minit