Triple Exponential Moving Average Profit Taking dan Stop Loss Strategi
Penulis:ChaoZhang, Tarikh: 2024-02-04 10:38:42Tag:

Ringkasan
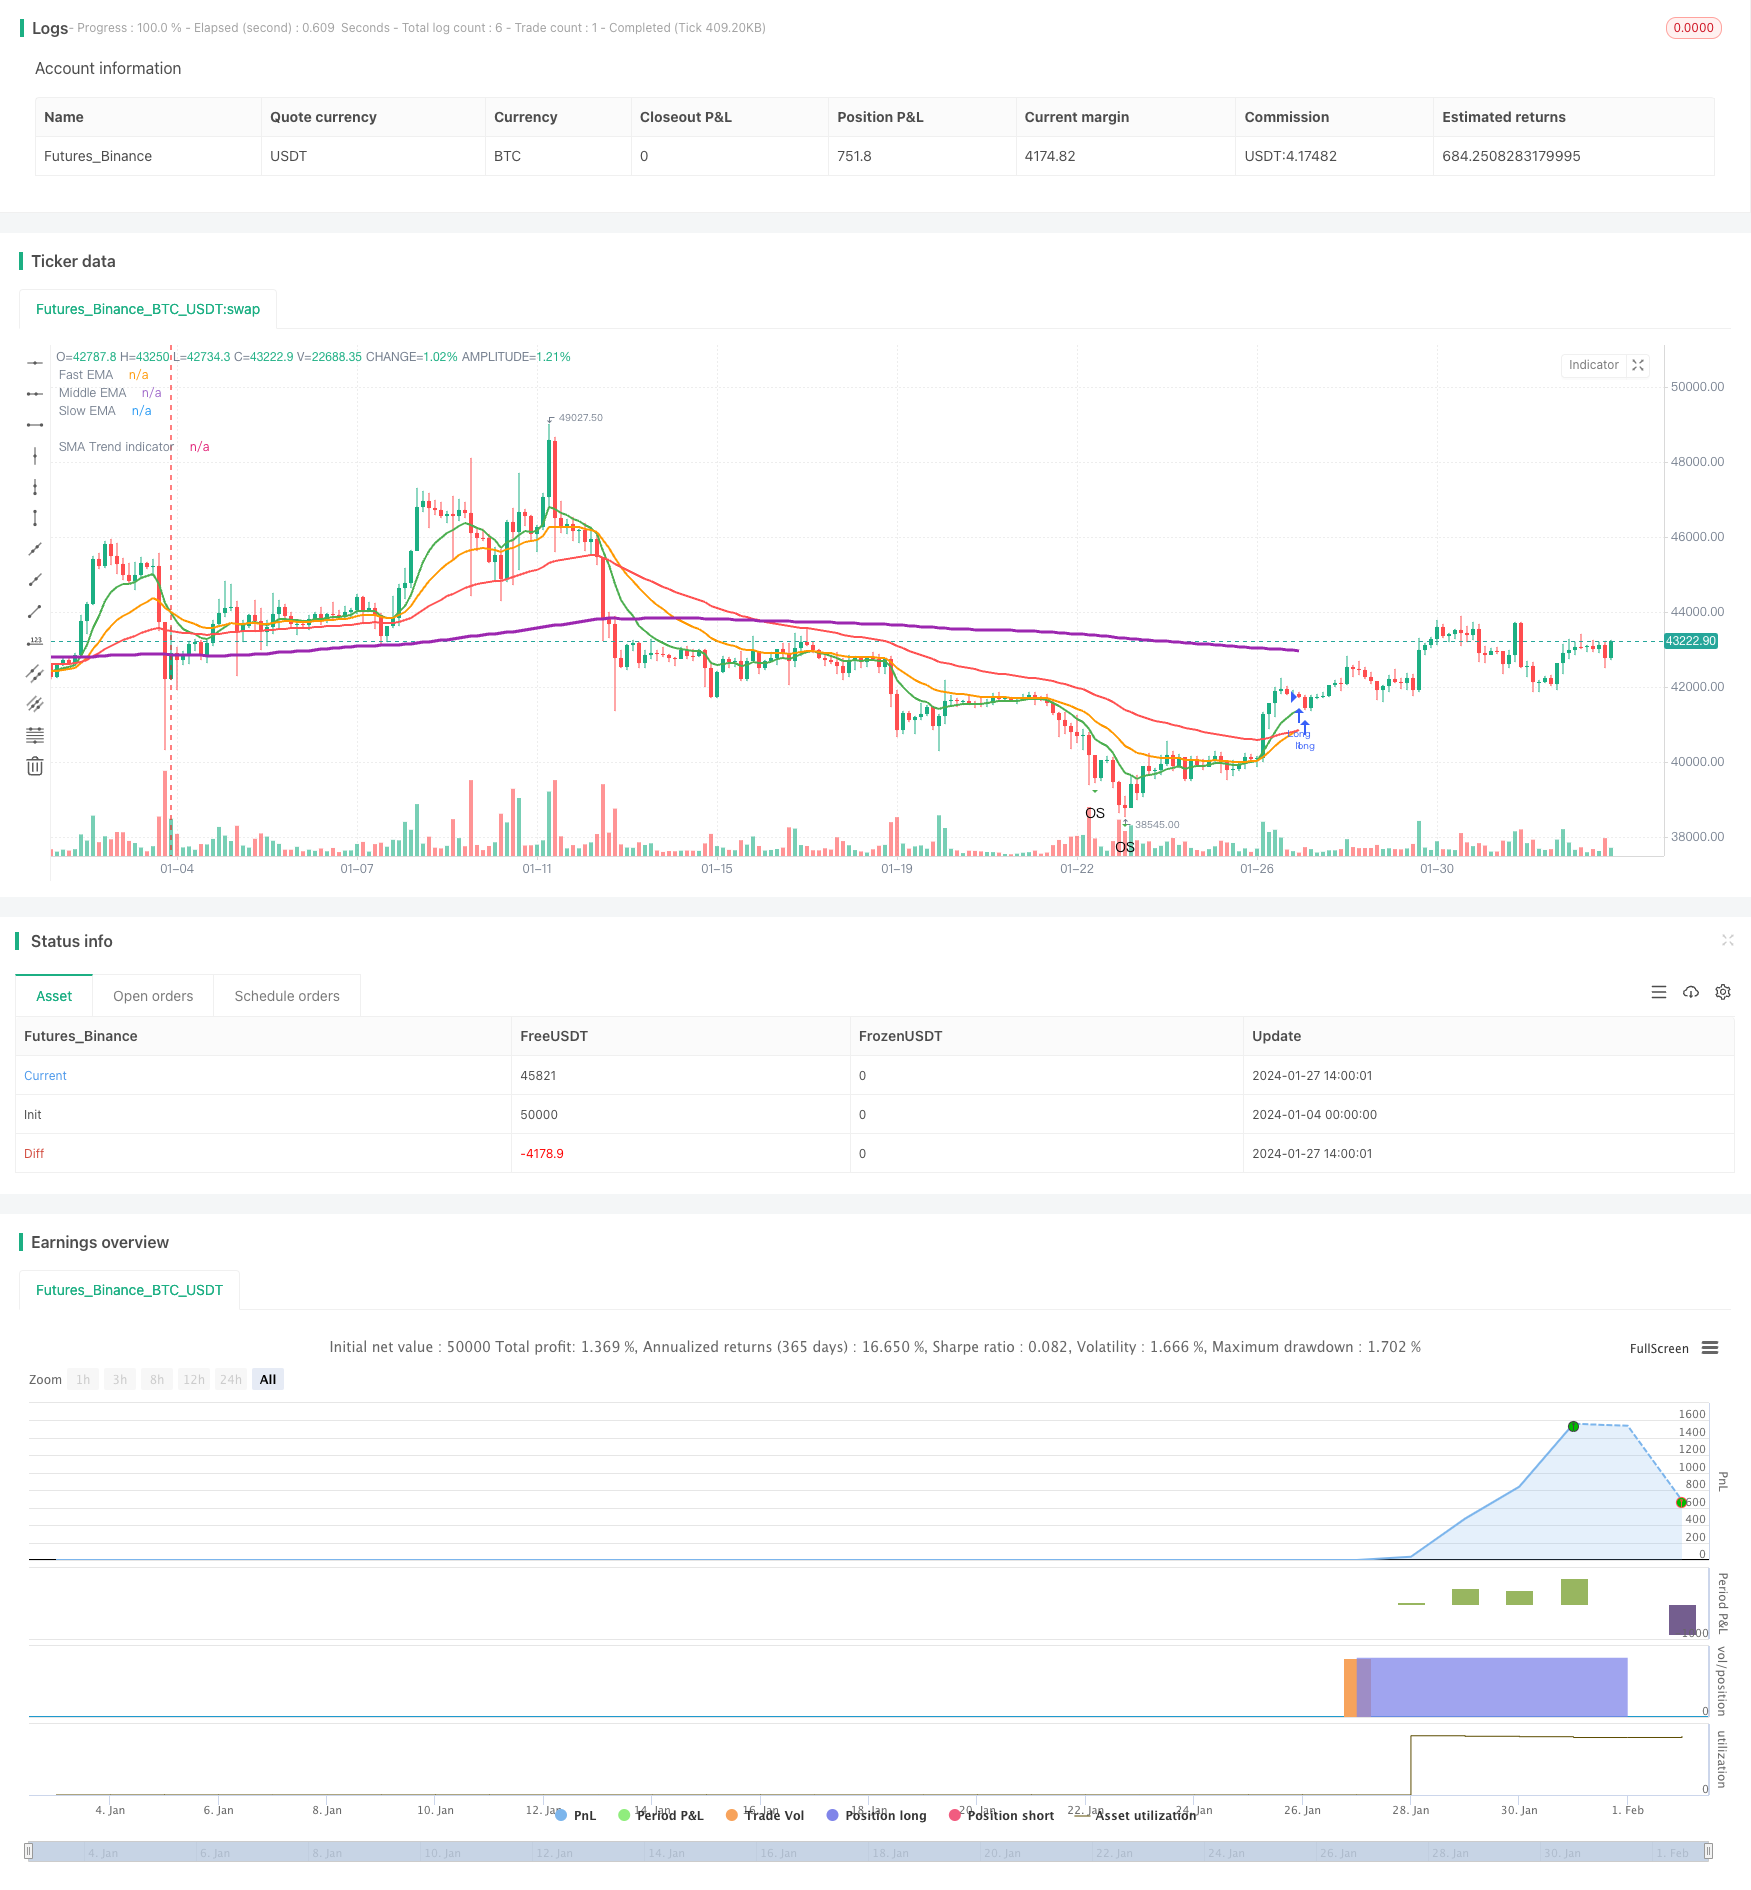
Triple Exponential Moving Average Profit Taking and Stop Loss Strategy adalah strategi mengikut trend berdasarkan tiga purata bergerak eksponensial dengan tempoh yang berbeza untuk masuk dan keluar pasaran.
Logika Strategi
Strategi ini menggunakan tiga purata bergerak eksponensial: garisan pantas, garisan tengah, dan garis perlahan. Ia pergi lama apabila garisan tengah melintasi di atas garisan perlahan, dan menutup kedudukan apabila garisan pantas melintasi di bawah garisan tengah. Ini adalah strategi trend berikut yang menentukan arah trend melalui persimpangan tiga purata bergerak.
Pada masa yang sama, strategi ini memanfaatkan penunjuk Julat Benar Purata untuk mengira tahap mengambil keuntungan dan stop-loss. Khususnya, mengambil keuntungan untuk kedudukan panjang adalah harga kemasukan + Julat Benar Purata * faktor keuntungan, dan untuk kedudukan pendek adalah harga kemasukan - Julat Benar Purata * faktor keuntungan. Logik kehilangan berhenti adalah sama. Ini dengan berkesan mengehadkan risiko kerugian besar.
Analisis Kelebihan
- Penunjuk keputusan adalah intuitif dan mudah difahami.
- Sistematik dan mudah untuk automatik.
- Mengimbangi trend-mengikuti dan kawalan risiko.
Analisis Risiko
- Terdapat beberapa kelewatan dan ketidakupayaan untuk menangkap pembalikan tepat pada masanya.
- Cenderung untuk menghentikan kerugian di pasaran pelbagai.
- Penyesuaian parameter memerlukan pengoptimuman, jika tidak, hasilnya mungkin buruk.
Langkah-langkah pengurangan risiko termasuk: memendekkan tempoh purata bergerak, mengoptimumkan faktor keuntungan / berhenti, dan menambah penunjuk tambahan.
Arahan pengoptimuman
- Uji gabungan purata bergerak untuk mencari parameter optimum.
- Tambah penunjuk teknikal lain seperti MACD, RSI dll.
- Gunakan pembelajaran mesin untuk mengoptimumkan parameter.
- Sesuaikan tahap keuntungan / henti secara dinamik berdasarkan julat sebenar.
- Masukkan perasaan untuk mengelakkan terlalu ramai.
Kesimpulan
Secara keseluruhan, ini adalah strategi trend yang berkesan dengan prestasi yang stabil dan pelaksanaan yang mudah melalui parameter yang mudah. mengambil keuntungan dinamik dan menghentikan kerugian berdasarkan Julat Benar Purata mengehadkan risiko setiap sisi. tetapi pengoptimuman parameter dan kombinasi penunjuk perlu dilakukan dengan berhati-hati untuk mengelakkan overfit atau kelewatan keputusan. pada keseimbangan, strategi ini mempunyai profil risiko-balasan yang baik dan patut dipertimbangkan.
/*backtest
start: 2024-01-04 00:00:00
end: 2024-02-03 00:00:00
period: 3h
basePeriod: 15m
exchanges: [{"eid":"Futures_Binance","currency":"BTC_USDT"}]
*/

//@version=4
//© Densz
strategy("3EMA with TP & SL (ATR)", overlay=true )

// INPUTS
startTime           =       input(title="Start Time", type = input.time, defval = timestamp("01 Jan 2017 00:00 +0000"))
endTime             =       input(title="End Time", type = input.time, defval = timestamp("01 Jan 2022 00:00 +0000"))

slowEMALength       =       input(title="Slow EMA Length", type = input.integer, defval = 55)
middleEMALength     =       input(title="Middle EMA Length", type = input.integer, defval = 21)
fastEMALength       =       input(title="Fast EMA Length", type = input.integer, defval = 9)

trendMALength       =       input(title="Trend indicator MA Length", type = input.integer, defval = 200)

atrLength           =       input(title="ATR Length", type = input.integer, defval = 14)
tpATRMult           =       input(title="Take profit ATR multiplier", type = input.integer, defval = 3)
slATRMult           =       input(title="Stop loss ATR multiplier", type = input.integer, defval = 2)

rsiLength           =       input(title="RSI Length", type = input.integer, defval = 14)

// Indicators
slowEMA             =       ema(close, slowEMALength)
middEMA             =       ema(close, middleEMALength)
fastEMA             =       ema(close, fastEMALength)
atr                 =       atr(atrLength)

rsiValue            =       rsi(close, rsiLength)
isRsiOB             =       rsiValue >= 80
isRsiOS             =       rsiValue <= 20

sma200              =       sma(close, trendMALength)

inDateRange         =       true

// Plotting
plot(slowEMA, title="Slow EMA", color=color.red, linewidth=2, transp=50)
plot(middEMA, title="Middle EMA", color=color.orange, linewidth=2, transp=50)
plot(fastEMA, title="Fast EMA", color=color.green, linewidth=2, transp=50)

plot(sma200, title="SMA Trend indicator", color=color.purple, linewidth=3, transp=10)
plotshape(isRsiOB, title="Overbought", location=location.abovebar, color=color.red, transp=0, style=shape.triangledown, text="OB")
plotshape(isRsiOS, title="Oversold", location=location.belowbar, color=color.green, transp=0, style=shape.triangledown, text="OS")

float takeprofit    =       na
float stoploss      =       na

var line tpline     =       na
var line slline     =       na

if strategy.position_size != 0
    takeprofit := takeprofit[1]
    stoploss := stoploss[1]
    line.set_x2(tpline, bar_index)
    line.set_x2(slline, bar_index)
    line.set_extend(tpline, extend.none)
    line.set_extend(slline, extend.none)

// STRATEGY
goLong  = crossover(middEMA, slowEMA) and inDateRange
closeLong = crossunder(fastEMA, middEMA) and inDateRange


if goLong
    takeprofit := close + atr * tpATRMult
    stoploss := close - atr * slATRMult
    // tpline := line.new(bar_index, takeprofit, bar_index, takeprofit, color=color.green, width=2, extend=extend.right, style=line.style_dotted)
    // slline := line.new(bar_index, stoploss, bar_index, stoploss, color=color.red, width=2, extend=extend.right, style=line.style_dotted)
    // label.new(bar_index, takeprofit, "TP", style=label.style_labeldown)
    // label.new(bar_index, stoploss, "SL", style=label.style_labelup)
    strategy.entry("Long", strategy.long, when = goLong)
    strategy.exit("TP/SL", "Long", stop=stoploss, limit=takeprofit)
if closeLong
    takeprofit := na
    stoploss := na
    strategy.close(id = "Long", when = closeLong)

if (not inDateRange)
    strategy.close_all()
- SMA Crossover Trend Bullish Mengikut Strategi
- Bollinger Bands Breakout Strategi Dagangan Kuantitatif
- Trend Mengikut Strategi Berdasarkan SMA Berbilang Tempoh
- Strategi Pecah Ichimoku Berasaskan Sentimen Pasaran
- Strategi Dagangan Kuantitatif Multi-penunjuk Dinamis
- Coral Trend Pullback Strategi
- Strategi Perdagangan Swing Berdasarkan Momentum
- Strategi Perdagangan Percutian Momentum
- Trend Riding RSI Swing Capture Strategi
- Strategi Bollinger Bands SAR Parabolik Berdua Kereta
- Strategi Perdagangan Lebar Saluran Donchian
- Strategi silang purata bergerak yang dioptimumkan
- Strategi Pengesanan Osilasi Band Pengasingan
- Strategi Penembusan Saluran Double Donchian
- Strategi purata bergerak CRSI
- Strategi Perdagangan Grid Kuantum yang Sesuai Sendiri
- Strategi Gabungan Ichimoku, MACD dan DMI Berbilang Jangka Masa
- Strategi Dagangan Trend Berasaskan Perbezaan Harga
- Strategi Garis Panjang Supertrend Bitcoin
- Trend Mengikuti Strategi dengan Purata Bergerak dan corak candlestick