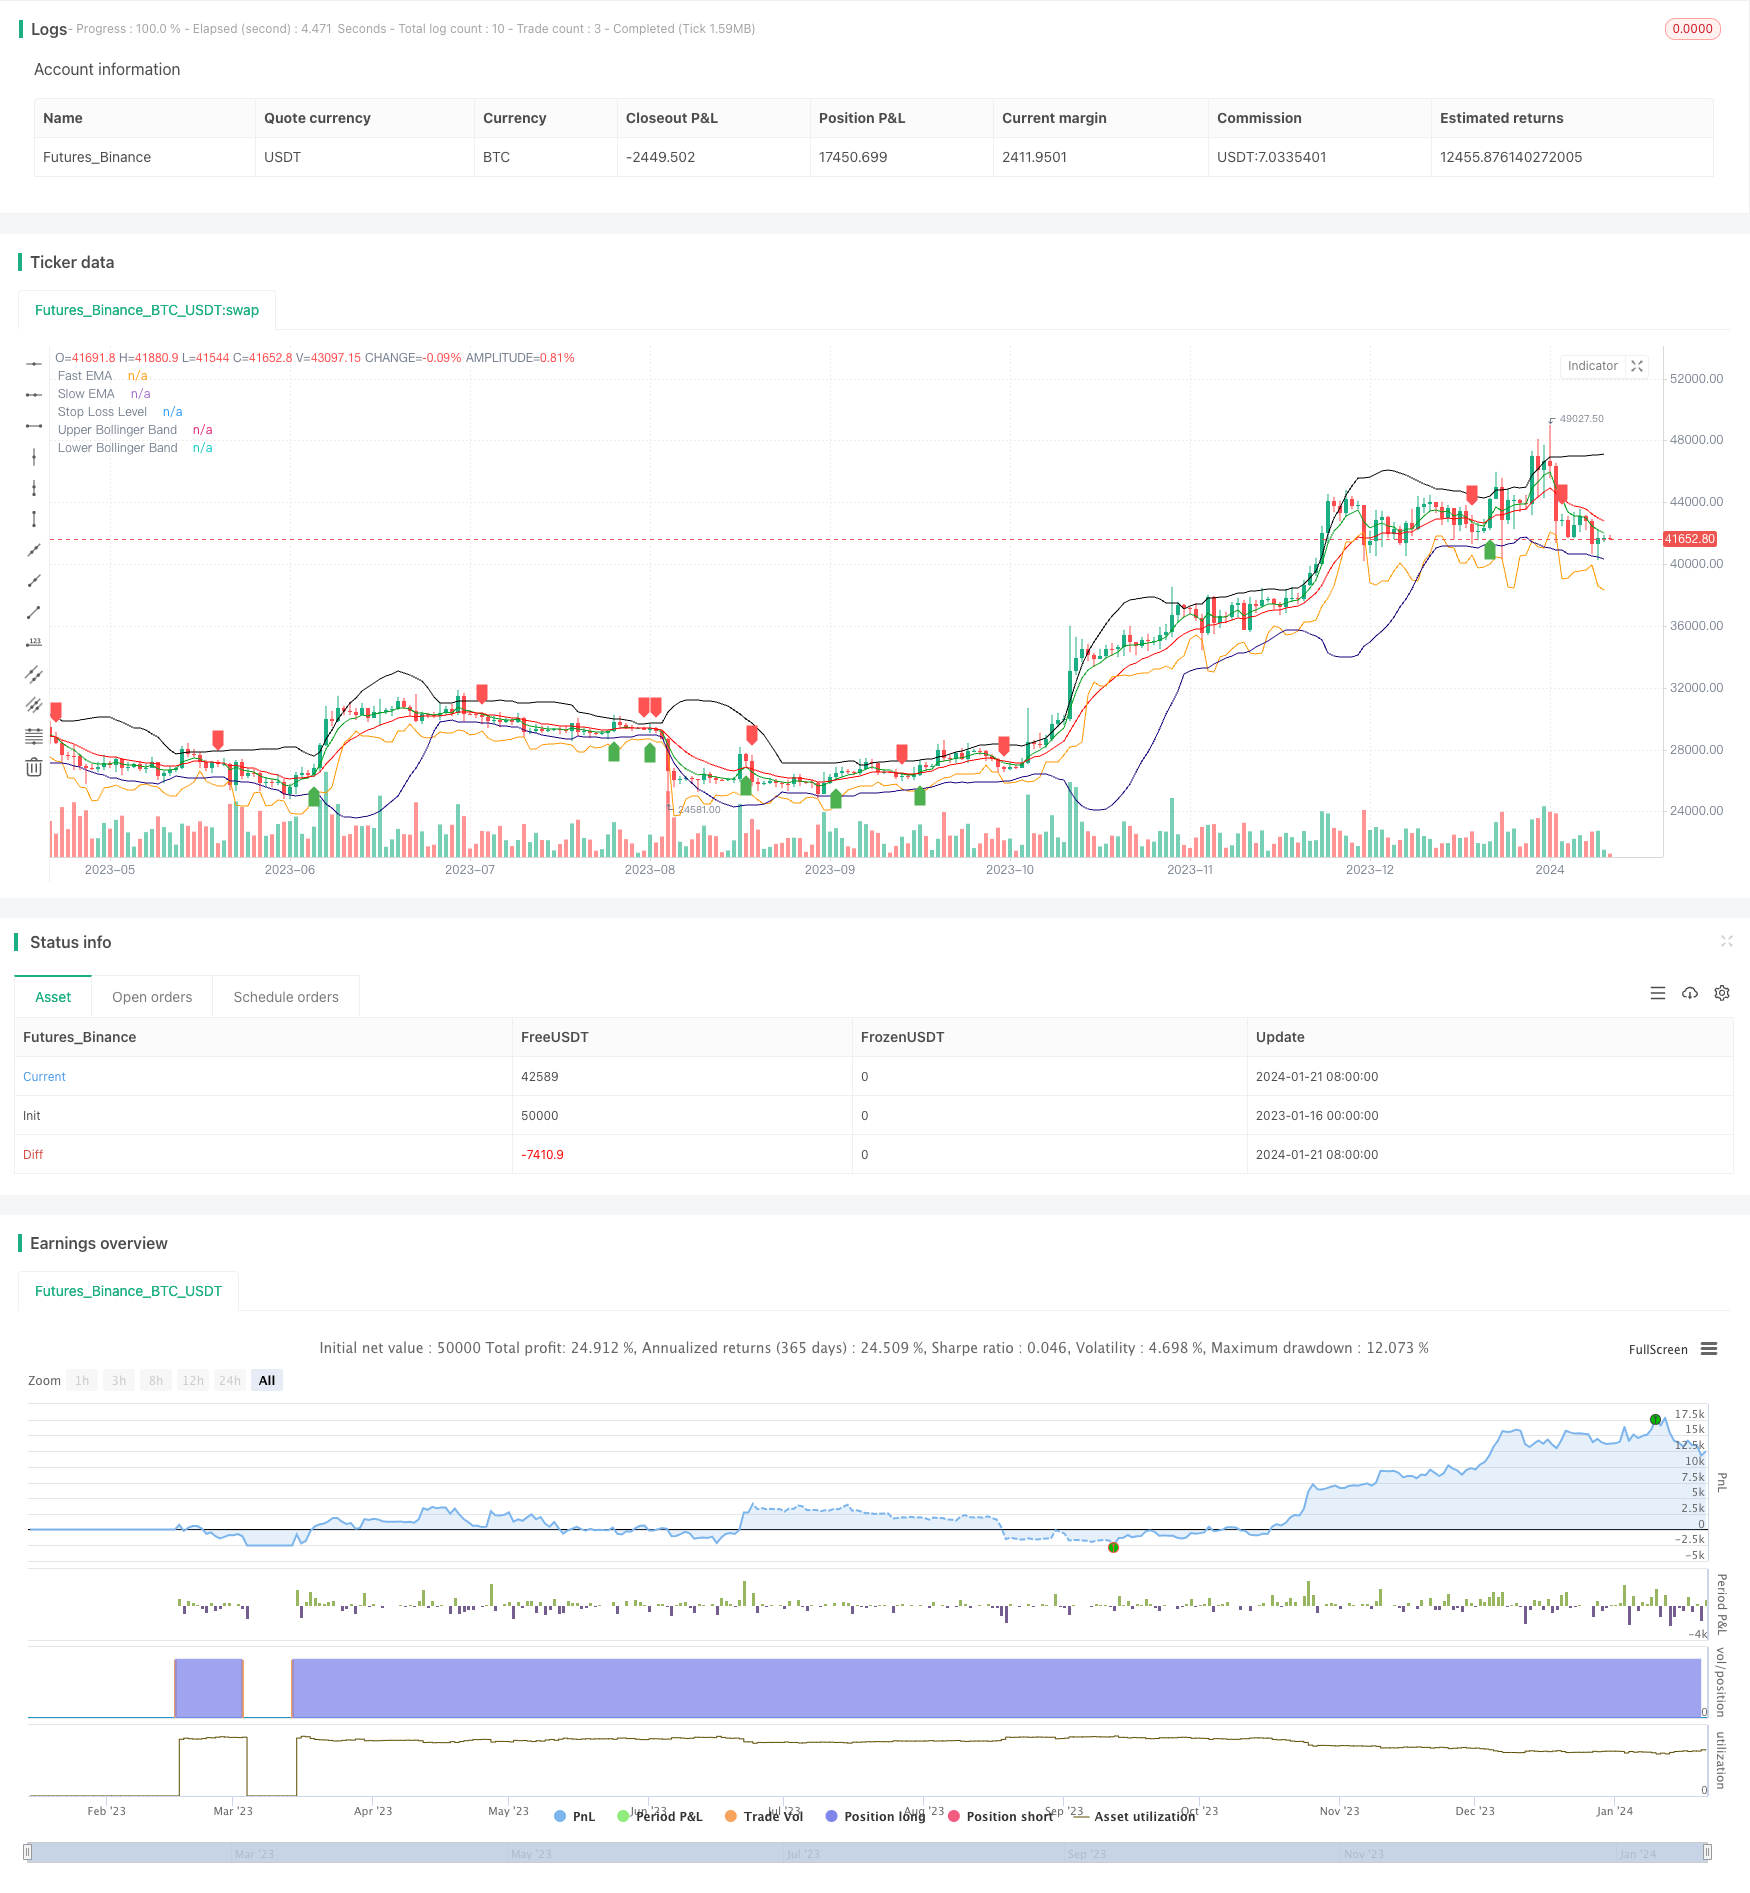
Estratégia de dupla diferença entre Bitcoin e Ouro
Autora:ChaoZhang, Data: 2024-01-23 15:28:56Tags:

Resumo
A estratégia Double Gap é uma estratégia quantitativa usada para negociação de curto prazo de Bitcoin e ouro.
Estratégia lógica
A estratégia Double Gap usa EMA rápida e crossovers EMA lenta para determinar a direção da tendência. Um sinal de compra é gerado quando a EMA rápida cruza acima da EMA lenta, e um sinal de venda é gerado quando a EMA rápida cruza abaixo da EMA lenta.
Especificamente, para determinar um sinal de compra, ambas as seguintes condições precisam ser atendidas: 1) A EMA rápida cruza acima da EMA lenta; 2) O preço de fechamento está perto ou abaixo das Bandas de Bollinger superiores ou médias.
Além disso, a estratégia Double Gap usa o indicador ATR para calcular um stop loss dinâmico para controlar o risco de cada negociação.
Vantagens
- Identifica breakouts de alta probabilidade usando filtros duplos
- O cruzamento rápido da EMA julga a principal tendência, as Bandas de Bollinger filtram falhas
- A parada ATR dinâmica controla eficazmente os riscos comerciais únicos
- Adequado para negociação a curto prazo de produtos de alta volatilidade como o BTC
Riscos
- Parâmetros EMA rápidos e lentos inadequados podem produzir sinais falsos excessivos
- Os parâmetros inadequados das bandas de Bollinger também reduzirão muito a eficácia da filtragem
- O limite de perdas estabelecido demasiado apertado aumenta a probabilidade de ser desencadeado
- Frequência de negociação elevada necessária, não adequada para pequenas contas
Optimização
A estratégia de dupla lacuna pode ser otimizada a partir dos seguintes aspectos:
- Otimizar os parâmetros da média móvel para encontrar as melhores combinações de EMA rápida e lenta
- Otimizar os parâmetros das bandas de Bollinger para reduzir as taxas de falha de ruptura
- Ajustar o multiplicador de parada ATR de acordo com diferentes produtos e regimes de mercado
- Adicionar sinal de reentrada depois de parar
- Combinar com outros indicadores como RSI, KD etc. como confirmação
Conclusão
A estratégia Double Gap identifica efetivamente oportunidades de curto prazo usando tanto o seguimento de tendências quanto a filtragem de rupturas. Com gerenciamento dinâmico de stop loss, é bem adequado para negociação de curto prazo de moedas digitais de alta volatilidade e metais preciosos.
/*backtest
start: 2023-01-16 00:00:00
end: 2024-01-22 00:00:00
period: 1d
basePeriod: 1h
exchanges: [{"eid":"Futures_Binance","currency":"BTC_USDT"}]
*/

// This source code is subject to the terms of the Mozilla Public License 2.0 at https://mozilla.org/MPL/2.0/
// © singhak8757

//@version=5
strategy("Bitcoin and Gold 5min Scalping Strategy2.0", overlay=true)


// Input parameters
fastLength = input(5, title="Fast EMA Length")
slowLength = input(13, title="Slow EMA Length")
bollingerLength = input(20, title="Bollinger Band Length")
bollingerMultiplier = input(2, title="Bollinger Band Multiplier")
stopLossMultiplier = input(1, title="Stop Loss Multiplier")

// Calculate EMAs
fastEMA = ta.ema(close, fastLength)
slowEMA = ta.ema(close, slowLength)

// Calculate Bollinger Bands
basis = ta.sma(close, bollingerLength)
upperBand = basis + bollingerMultiplier * ta.stdev(close, bollingerLength)
lowerBand = basis - bollingerMultiplier * ta.stdev(close, bollingerLength)

// Buy condition
buyCondition = ta.crossover(fastEMA, slowEMA) and (close <= upperBand or close <= basis)

// Sell condition
sellCondition = ta.crossunder(fastEMA, slowEMA) and (close >= lowerBand or close >= basis)

// Calculate stop loss level
stopLossLevel = ta.lowest(low, 2)[1] - stopLossMultiplier * ta.atr(14)

// Plot EMAs
plot(fastEMA, color=color.rgb(0, 156, 21), title="Fast EMA")
plot(slowEMA, color=color.rgb(255, 0, 0), title="Slow EMA")

// Plot Bollinger Bands
plot(upperBand, color=color.new(#000000, 0), title="Upper Bollinger Band")
plot(lowerBand, color=color.new(#1b007e, 0), title="Lower Bollinger Band")

// Plot Buy and Sell signals
plotshape(series=buyCondition, title="Buy Signal", color=color.green, style=shape.labelup, location=location.belowbar)
plotshape(series=sellCondition, title="Sell Signal", color=color.red, style=shape.labeldown, location=location.abovebar)

// Plot Stop Loss level
plot(stopLossLevel, color=color.orange, title="Stop Loss Level")

// Strategy logic
strategy.entry("Buy", strategy.long, when = buyCondition)
strategy.exit("Stop Loss/Close", from_entry="Buy", loss=stopLossLevel)
strategy.close("Sell", when = sellCondition)
- RSI CCI Williams%R Estratégia de negociação quantitativa
- Estratégia de negociação dinâmica ajustada para o risco e para o momento
- Estratégia de negociação cruzada de média móvel de impulso
- Estratégia de criador de mercado de limite de banda de Bollinger
- Estratégia Renko de cruzamento da média móvel a longo prazo
- A nova transação do Binance é monitorada online
- Estratégia de negociação da Renko de rastreamento de tendências bidirecionais
- Estratégia combinada de linha de resposta de média móvel e de impulso infinito
- Estratégia de acompanhamento de super-tendências
- Estratégia de negociação de inversão de tendência de múltiplos indicadores
- Estratégia de cruzamento do MACD e do RSI
- Estratégia de recuperação de impulso
- Estratégia de cruzamento da média móvel
- Estratégia de grelha de lucros com oscilação
- Estratégia de avanço da oscilação baseada na média móvel
- Segmentação do valor de mercado
- Estratégia de rastreamento da volatilidade e da tendência através de prazos baseada no Williams VIX e no DEMA
- Estratégia de ruptura de momento baseada no julgamento do ciclo com médias móveis
- Índice de Fluxo de Dinheiro Estratégia de 5 minutos através do tempo e do espaço
- Estratégia de negociação de dupla EMA de tendência cruzada