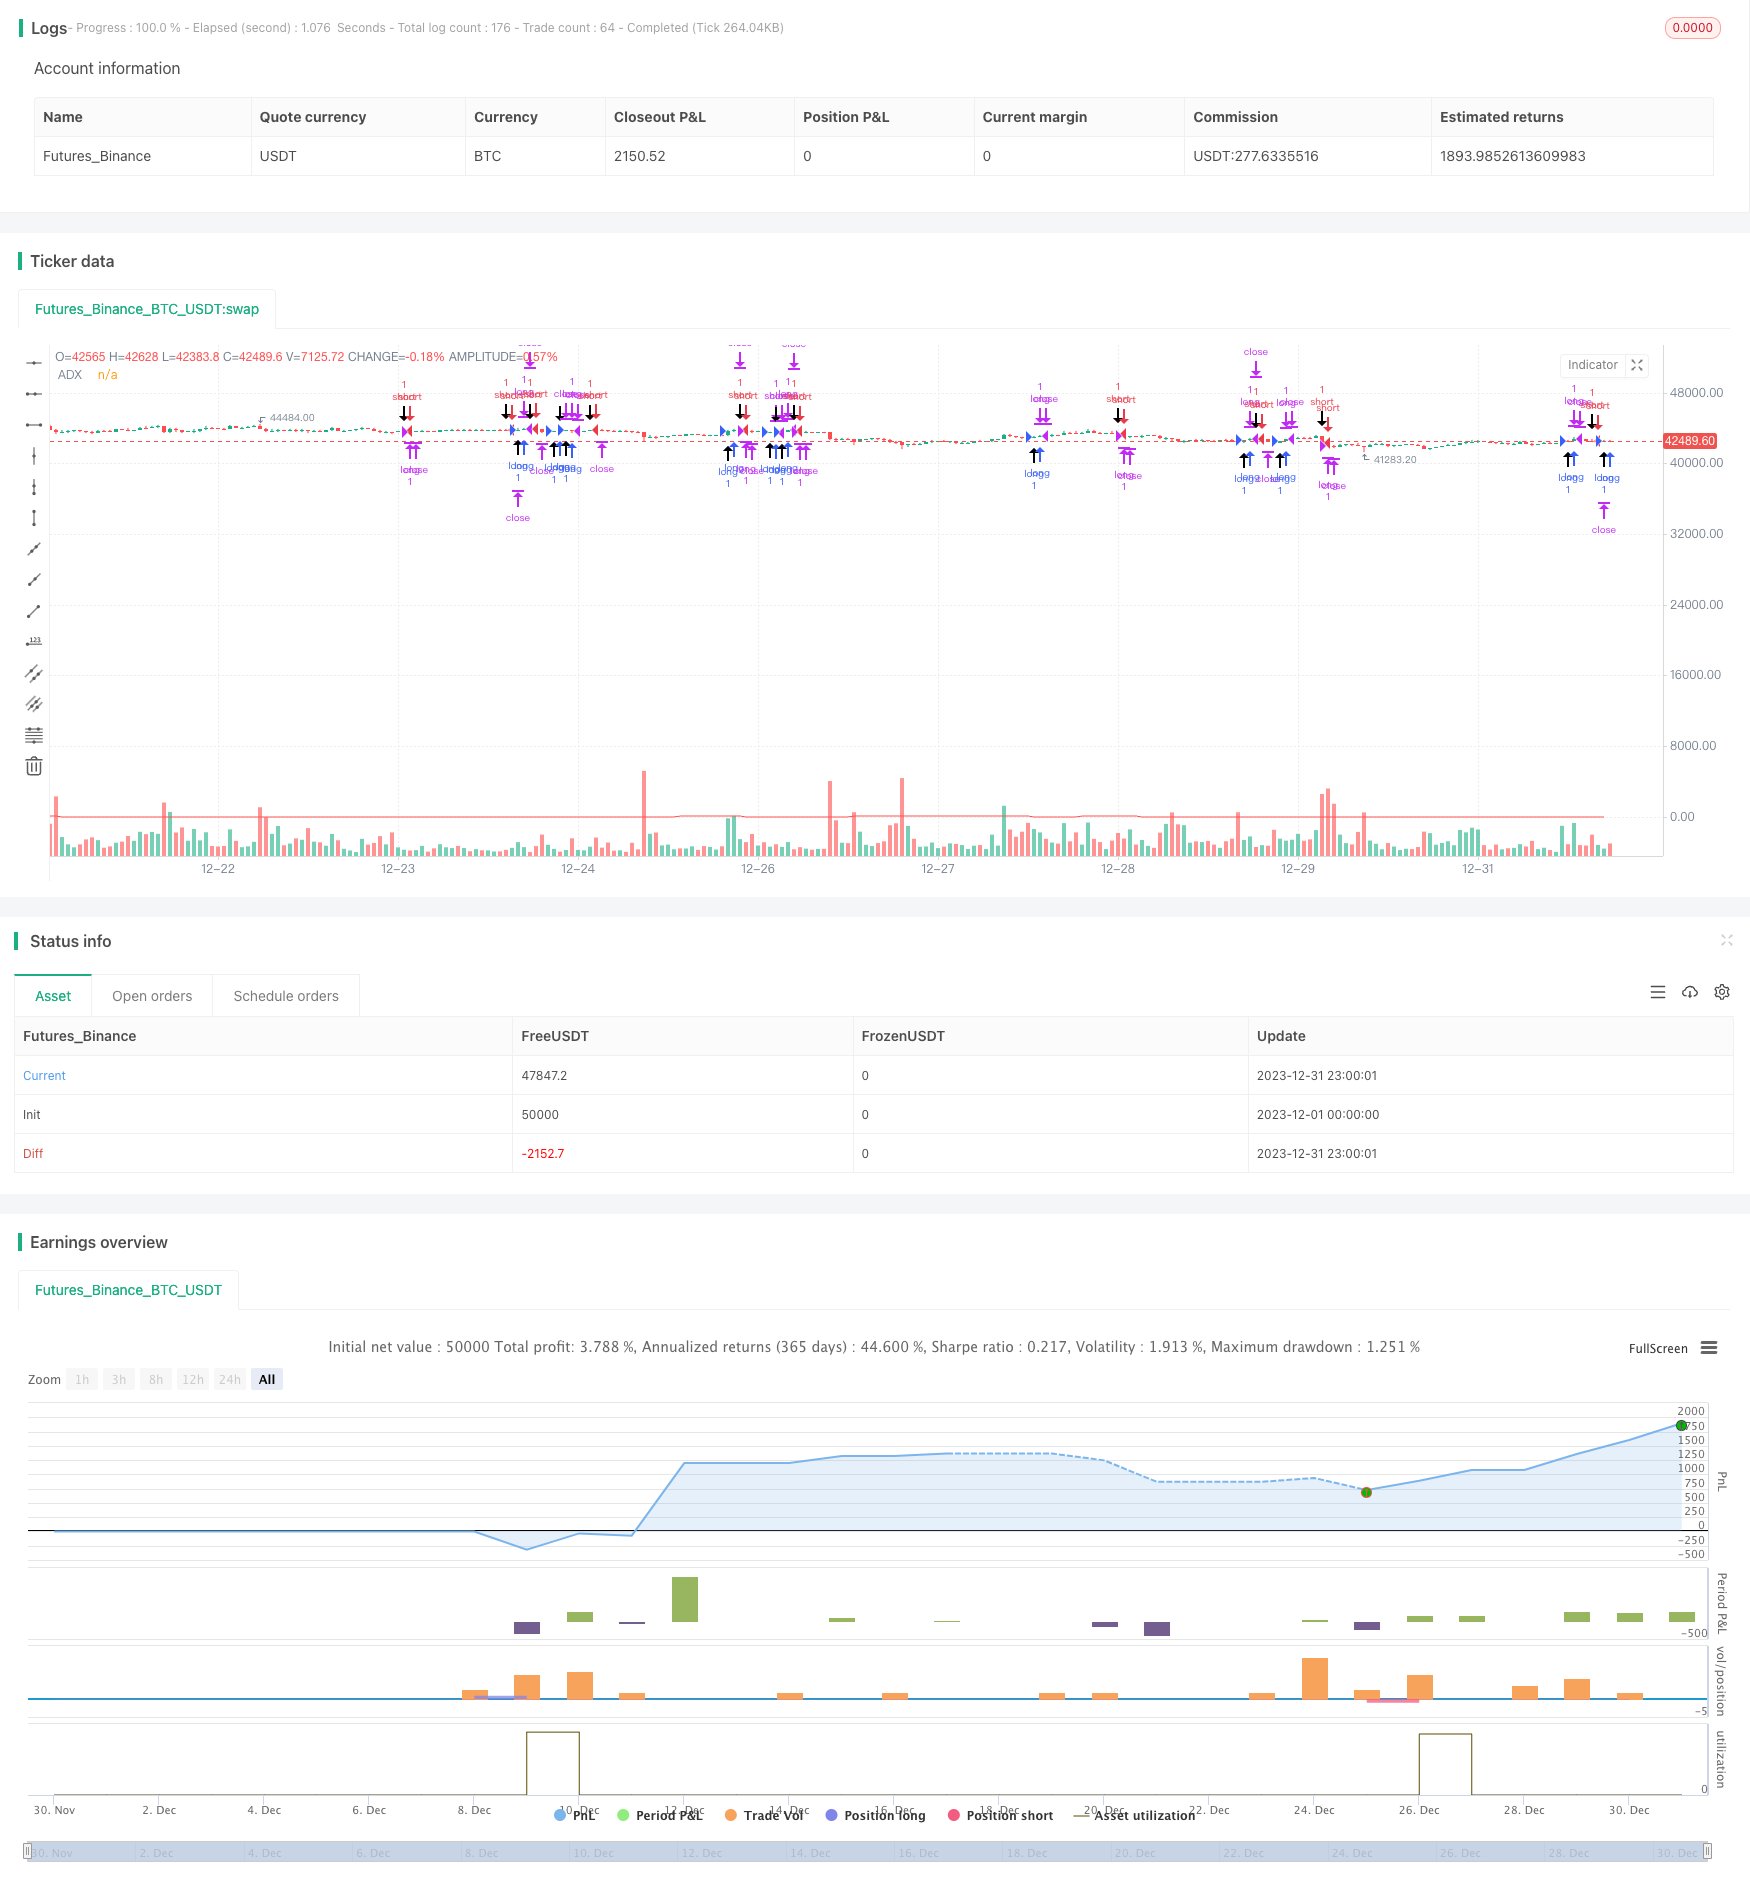
Estratégia de acompanhamento de tendência do petróleo bruto com base no indicador ADX

Visão geral
Esta estratégia é baseada na estratégia de negociação de futuros de petróleo gratuito de Kevin Davey. A estratégia usa o indicador ADX para determinar a tendência do mercado de petróleo, combinando o princípio da ruptura de preços, para realizar uma estratégia de negociação automática de petróleo simples e prática.
Princípio da estratégia
- Calculando o indicador ADX de 14 ciclos
- Quando o ADX é > 10, a tendência é
- Se o preço de fechamento for superior ao preço de fechamento antes da linha K de 65, isso indica que o preço se rompeu e é um sinal de posição longa
- Se o preço de fechamento estiver abaixo do preço de fechamento antes da linha K de 65, isso indica que o preço se rompeu e é um sinal de posição curta
- Parar e parar após a entrada
A estratégia baseia-se principalmente na tendência do indicador ADX e, em caso de tendência, gera sinais de negociação com base em rupturas de preços em períodos fixos. A lógica da estratégia é muito simples e clara.
Análise de vantagens estratégicas
- Usando o ADX para avaliar tendências, evite perder oportunidades de tendências
- Preços de ciclo fixo geram sinais de ruptura, melhor efeito de retrospecção
- Código intuitivo, simples de entender e modificar
- Kevin Davey, anos de teste em laboratório, não-conformidade de curva
Análise de risco estratégico
- ADX como principal indicador, sensível à seleção de parâmetros e seleção de ciclo de ruptura
- A ruptura do ciclo fixo pode ter perdido algumas oportunidades
- A configuração inadequada do Stop Loss Barrier pode aumentar os prejuízos
- Possibilidade de diferença entre os resultados reais e os de retrospecção
Direção de otimização da estratégia
- Optimizar os parâmetros ADX e o ciclo de ruptura
- Aumento do ajustamento dinâmico de posições
- Revisão e aperfeiçoamento da estratégia com base em resultados de feedback e verificação em campo
- Introdução de aprendizagem de máquina e aprendizagem profunda para otimização de estratégias
Resumir
Em geral, esta estratégia é uma estratégia de negociação de petróleo muito prática. Usando o indicador ADX para determinar a tendência é muito razoável, o princípio de ruptura de preço é simples e eficaz, o retrospectivo é bom.
/*backtest
start: 2023-12-01 00:00:00
end: 2023-12-31 23:59:59
period: 1h
basePeriod: 15m
exchanges: [{"eid":"Futures_Binance","currency":"BTC_USDT"}]
*/

// Strategy idea coded from EasyLanguage to Pinescript
//@version=5
strategy("Kevin Davey Crude free crude oil strategy", shorttitle="CO Fut", format=format.price, precision=2, overlay = true, calc_on_every_tick = true)
adxlen = input(14, title="ADX Smoothing")
dilen = input(14, title="DI Length")
dirmov(len) =>
	up = ta.change(high)
	down = -ta.change(low)
	plusDM = na(up) ? na : (up > down and up > 0 ? up : 0)
	minusDM = na(down) ? na : (down > up and down > 0 ? down : 0)
	truerange = ta.rma(ta.tr, len)
	plus = fixnan(100 * ta.rma(plusDM, len) / truerange)
	minus = fixnan(100 * ta.rma(minusDM, len) / truerange)
	[plus, minus]
adx(dilen, adxlen) =>
	[plus, minus] = dirmov(dilen)
	sum = plus + minus
	adx = 100 * ta.rma(math.abs(plus - minus) / (sum == 0 ? 1 : sum), adxlen)
sig = adx(dilen, adxlen)
plot(sig, color=color.red, title="ADX")

buy = sig > 10 and (close - close[65]) > 0 and (close - close[65])[1] < 0
sell = sig > 10 and (close - close[65]) < 0 and (close - close[65])[1] > 0

plotshape(buy, style = shape.arrowup, location = location.belowbar,size = size.huge)
plotshape(sell, style = shape.arrowdown, location = location.abovebar,size = size.huge)

if buy
	strategy.entry("long", strategy.long)
if sell
	strategy.entry("short", strategy.short)

if strategy.position_size != 0
	strategy.exit("long", profit = 450, loss = 300)
	strategy.exit("short", profit = 450, loss = 300)


// GetTickValue() returns the currency value of the instrument's
// smallest possible price movement.
GetTickValue() =>
    syminfo.mintick * syminfo.pointvalue

// On the last historical bar, make a label to display the
// instrument's tick value
if barstate.islastconfirmedhistory
    label.new(x=bar_index + 1, y=close, style=label.style_label_left,
         color=color.black, textcolor=color.white, size=size.large,
         text=syminfo.ticker + " has a tick value of:\n" +
             syminfo.currency + " " + str.tostring(GetTickValue()))