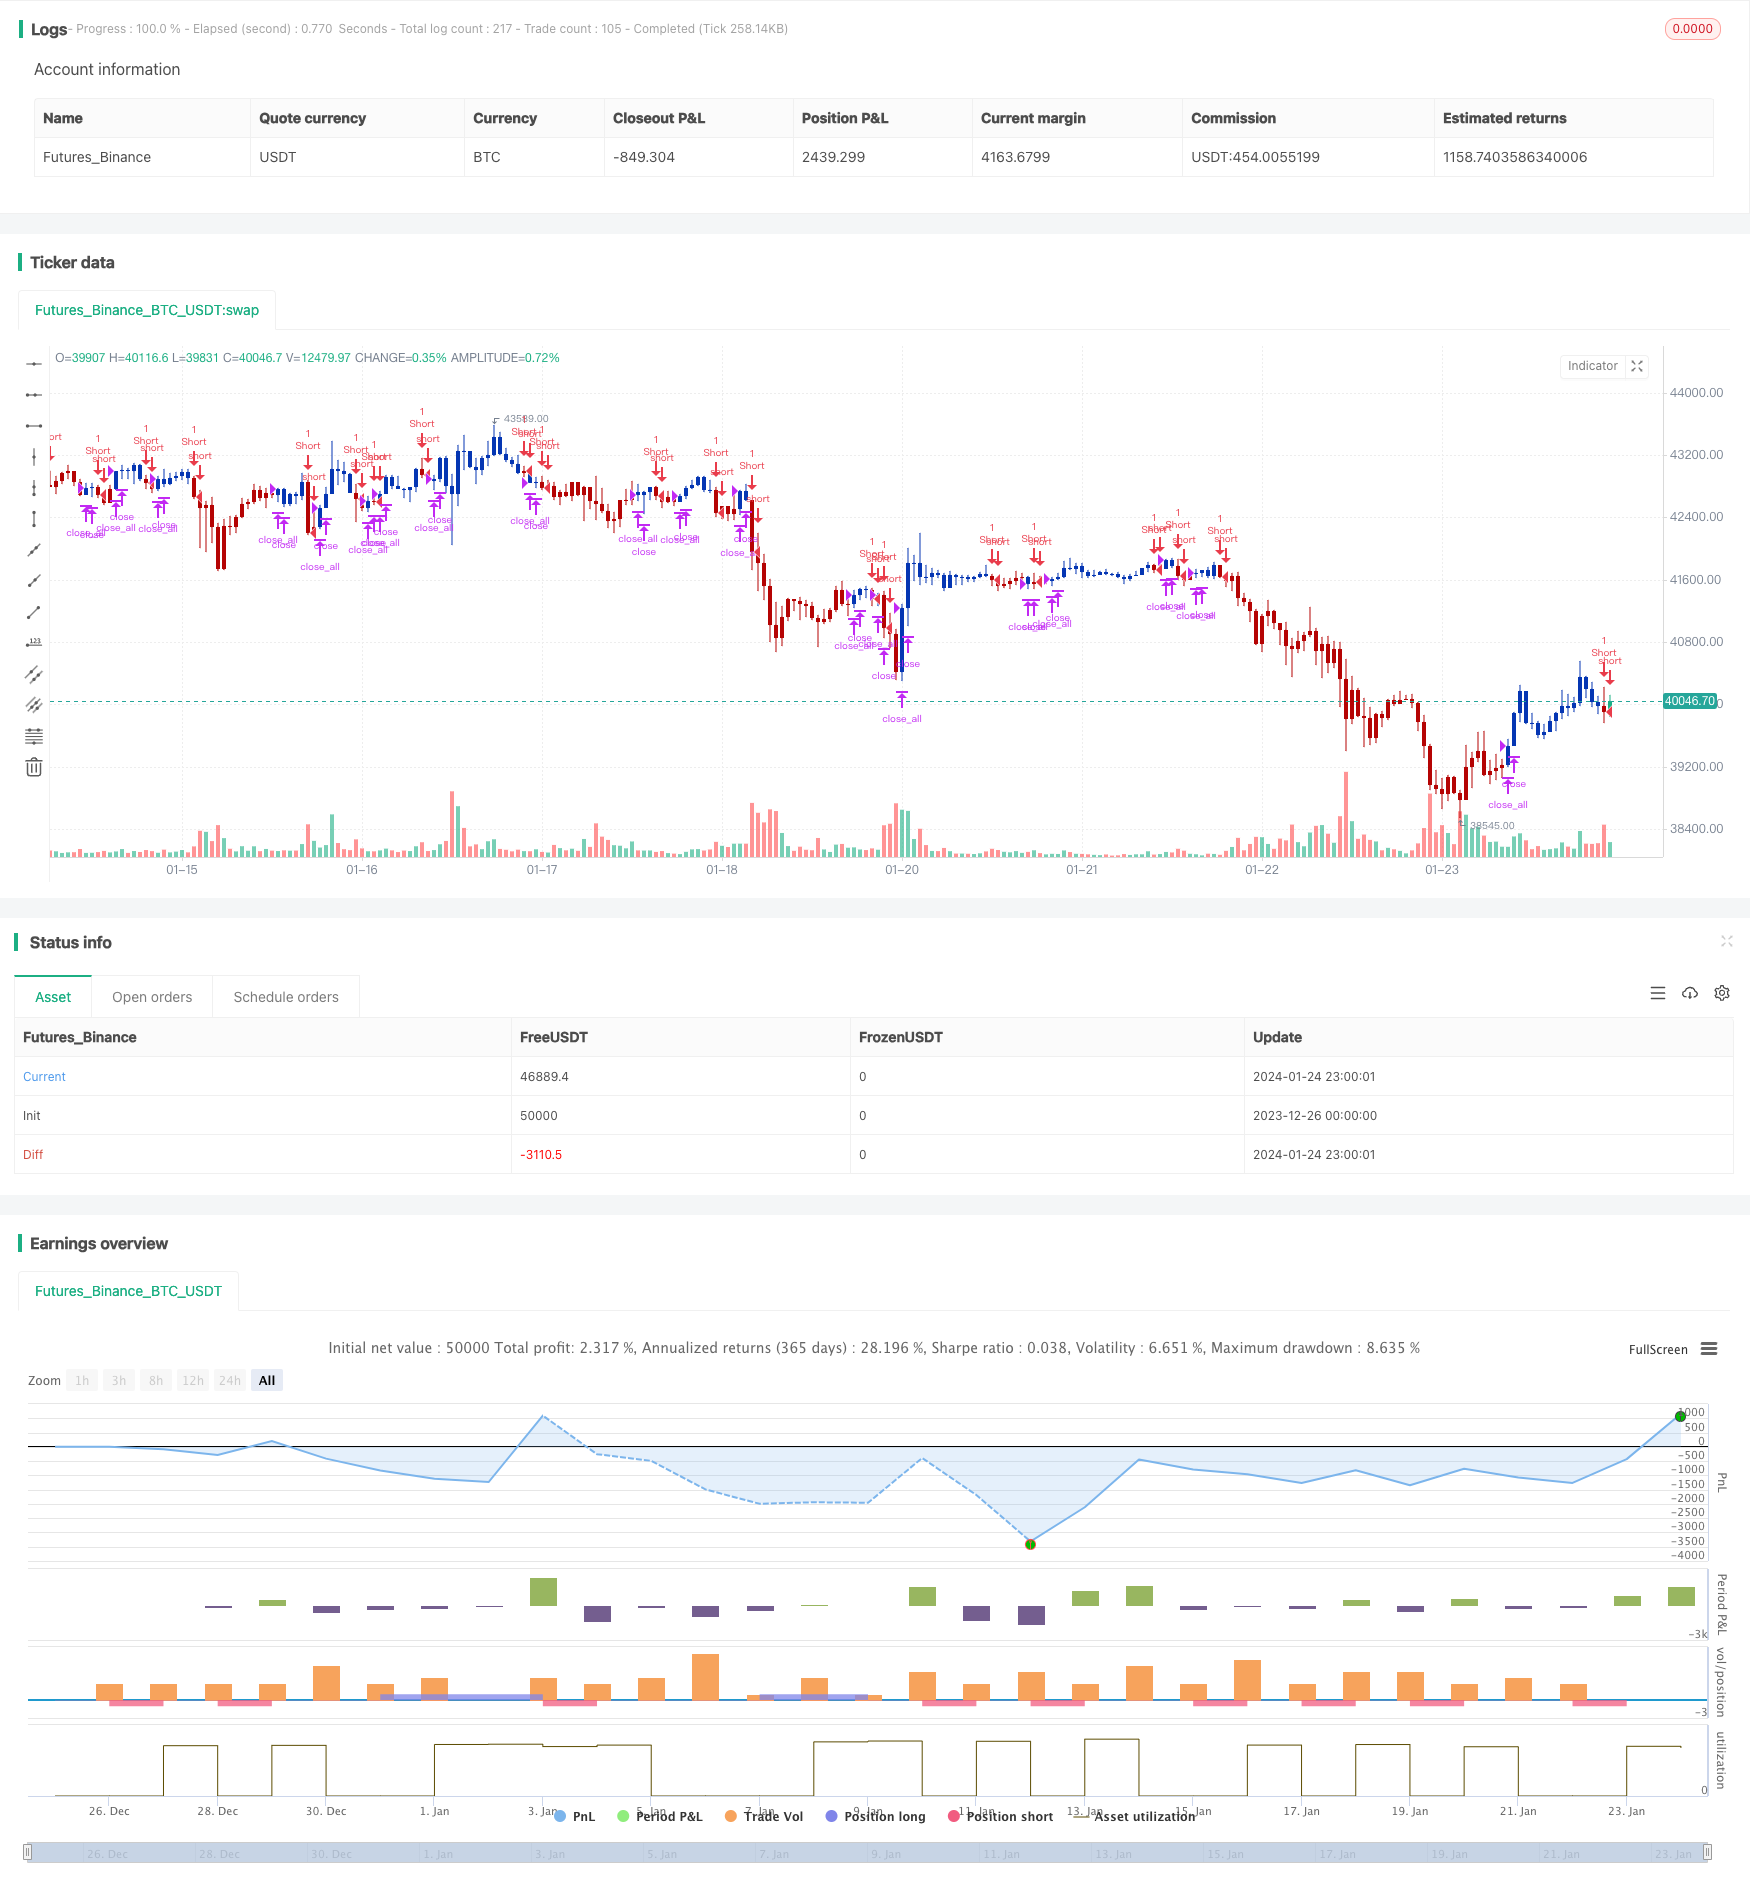
Indicadores múltiplos seguem a estratégia
Autora:ChaoZhangTags:

Resumo
Estratégia lógica
A estratégia consiste em duas partes:
- 123 Indicador de reversão
Análise das vantagens
Riscos e soluções
- A diferença de tempo na geração de sinal entre os indicadores não pode corresponder perfeitamente
- Diferença anormal entre indicadores que causam excesso de negociação
Pode definir um período mínimo de retenção para evitar cancelamentos e criação de encomendas frequentes.
Orientações de otimização
-
Adicionar estratégia de stop loss
Conclusão
/*backtest
start: 2023-12-26 00:00:00
end: 2024-01-25 00:00:00
period: 1h
basePeriod: 15m
exchanges: [{"eid":"Futures_Binance","currency":"BTC_USDT"}]
*/

//@version=4
////////////////////////////////////////////////////////////
//  Copyright by HPotter v1.0 24/05/2021
// This is combo strategies for get a cumulative signal.
//
// First strategy
// This System was created from the Book "How I Tripled My Money In The
// Futures Market" by Ulf Jensen, Page 183. This is reverse type of strategies.
// The strategy buys at market, if close price is higher than the previous close
// during 2 days and the meaning of 9-days Stochastic Slow Oscillator is lower than 50.
// The strategy sells at market, if close price is lower than the previous close price
// during 2 days and the meaning of 9-days Stochastic Fast Oscillator is higher than 50.
//
// Second strategy
// A technical indicator developed by Tushar Chande to numerically identify
// trends in candlestick charting. It is calculated by taking an 'n' period
// moving average of the difference between the open and closing prices. A
// Qstick value greater than zero means that the majority of the last 'n' days
// have been up, indicating that buying pressure has been increasing.
// Transaction signals come from when the Qstick indicator crosses through the
// zero line. Crossing above zero is used as the entry signal because it is indicating
// that buying pressure is increasing, while sell signals come from the indicator
// crossing down through zero. In addition, an 'n' period moving average of the Qstick
// values can be drawn to act as a signal line. Transaction signals are then generated
// when the Qstick value crosses through the trigger line.
//
// WARNING:
// - For purpose educate only
// - This script to change bars colors.
////////////////////////////////////////////////////////////
Reversal123(Length, KSmoothing, DLength, Level) =>
    vFast = sma(stoch(close, high, low, Length), KSmoothing)
    vSlow = sma(vFast, DLength)
    pos = 0.0
    pos := iff(close[2] < close[1] and close > close[1] and vFast < vSlow and vFast > Level, 1,
	         iff(close[2] > close[1] and close < close[1] and vFast > vSlow and vFast < Level, -1, nz(pos[1], 0)))
	pos


Qstick(Length) =>
    pos = 0.0
    xR = close - open
    xQstick = sma(xR, Length)
    pos:= iff(xQstick > 0, 1,
           iff(xQstick < 0, -1, nz(pos[1], 0)))
    pos

strategy(title="Combo Backtest 123 Reversal & Qstick Indicator", shorttitle="Combo", overlay = true)
line1 = input(true, "---- 123 Reversal ----")
Length = input(14, minval=1)
KSmoothing = input(1, minval=1)
DLength = input(3, minval=1)
Level = input(50, minval=1)
//-------------------------
line2 = input(true, "---- Qstick Indicator ----")
LengthQ = input(14, minval=1)
reverse = input(false, title="Trade reverse")
posReversal123 = Reversal123(Length, KSmoothing, DLength, Level)
posQstick = Qstick(LengthQ)
pos = iff(posReversal123 == 1 and posQstick == 1 , 1,
	   iff(posReversal123 == -1 and posQstick == -1, -1, 0))
possig = iff(reverse and pos == 1, -1,
          iff(reverse and pos == -1 , 1, pos))
if (possig == 1 )
    strategy.entry("Long", strategy.long)
if (possig == -1 )
    strategy.entry("Short", strategy.short)
if (possig == 0)
    strategy.close_all()
barcolor(possig == -1 ? #b50404: possig == 1 ? #079605 : #0536b3 )
Mais.
- Estratégia chave de reversão do backtest
- Estratégia de negociação de reversão de impulso
- Estratégia de canal de regressão linear adaptativa
- Estratégia cruzada de diferença média móvel zero
- Tendência sólida na sequência da estratégia
- Cruzamento da tendência da média móvel de preços seguindo a estratégia
- Estratégia de ruptura de dupla EMA Golden Cross
- Estratégia de tendência gradual do BB KC
- Estratégia de rastreamento automático de SMA tripla
- Estratégia de negociação de posições de futuros de Bitcoin
- EMA de preços com otimização estocástica baseada em aprendizagem de máquina
- Estratégia dinâmica de ruptura de Bollinger
- Estratégia de média móvel de retracement de dois anos
- Estratégia de negociação de média móvel dupla