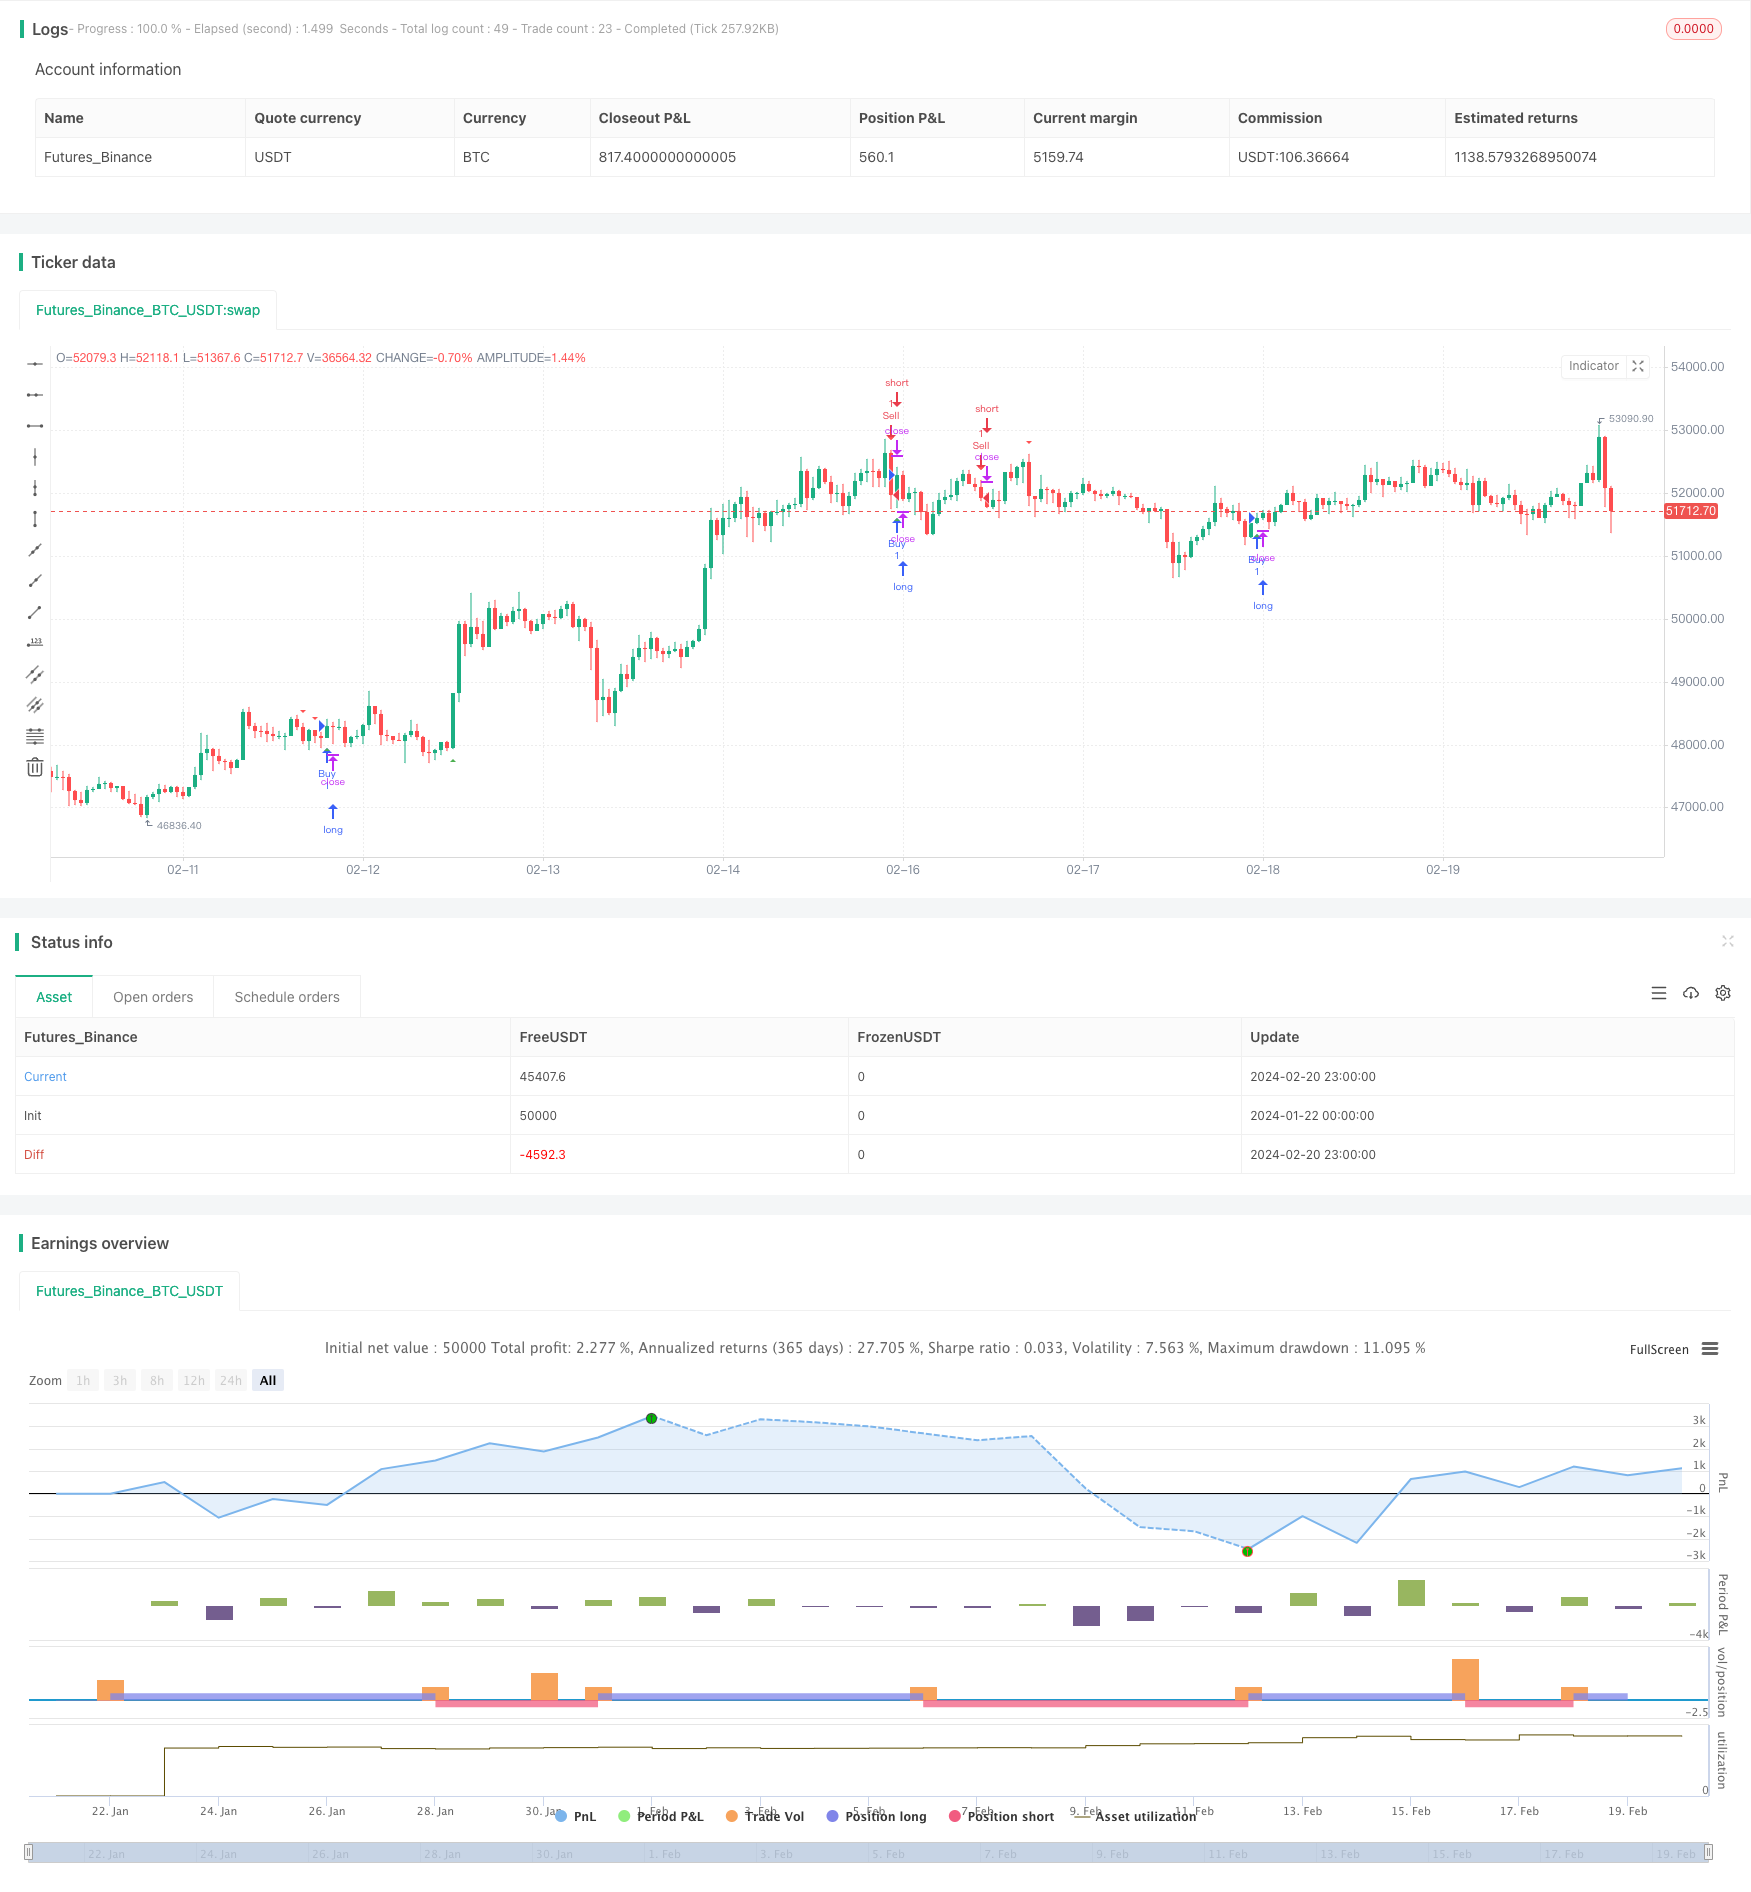
Dual Trendlines Breakout Cruz Dourada Cruz da Morte Tendência Seguindo Estratégia
Autora:ChaoZhang, Data: 2024-02-22 16:01:12Tags:

Resumo
A Estratégia de Segurança da Transação é uma estratégia quantitativa de negociação que utiliza linhas de tendência de suporte/resistência e médias móveis como sinais alternativos para seguir a tendência.
Princípio da estratégia
Esta estratégia consiste em quatro componentes principais:
- Linha de suporte representada pelo gráfico com os mínimos mais baixos dos últimos 30 dias
- Linha de resistência traçada com os máximos mais altos nas últimas 30 semanas
- Média móvel simples de 10 períodos, utilizada para confirmar a tendência de filtragem dos sinais comerciais
- Modulo de identificação de ruptura para detectar oportunidades de negociação quando o preço ultrapassa níveis críticos de suporte/resistência
Especificamente, a estratégia usa primeiro as funções de solicitação de segurança para obter os máximos e mínimos mais altos nos últimos 30 dias e 30 semanas, respectivamente, traçando linhas de suporte e resistência dinâmicas.
Esta estratégia considera os níveis de suporte/resistência de médio e longo prazo, permitindo-lhe capturar oportunidades de tendência maiores.
Análise das vantagens
As principais vantagens desta estratégia incluem:
- Utiliza suporte/resistência de médio e longo prazo para capturar breakouts maiores.
- O filtro MA controla as perdas evitando sinais falsos durante os mercados variáveis.
- As atualizações dinâmicas dos níveis de suporte/resistência permitem a captura oportuna de novas direcções de tendência.
- Os mecanismos de gestão de risco de stop loss e take profit ajudam a garantir lucros.
Análise de riscos
Há também alguns riscos a considerar para esta estratégia:
- As estratégias de fuga exigem um tempo preciso, com problemas de ultrapassagem ou atraso.
- As rupturas inválidas podem ocorrer quando os níveis de suporte/resistência falham, causando perdas enormes.
- A natureza atrasada das médias móveis pode causar sinais tardios para inversões de tendência.
- Os riscos elevados de utilização tornam-no inadequado para pequenas contas.
Soluções:
- Melhora a lógica de identificação e adiciona mais filtros.
- Usar períodos MA mais longos para garantir que os sinais só ocorrem após a estabilização das tendências.
- Defina os níveis de stop loss adequados para limitar a queda nos negócios individuais.
Orientações de otimização
Há ainda espaço para melhorias:
- Incorporar medidas de volatilidade como ATR para um stop loss mais inteligente e aumentar o lucro.
- Adicionar modelos de aprendizagem de máquina para detectar falhas de suporte/resistência.
- Utilize médias móveis adaptativas para capturas mais rápidas de reversões.
- Parâmetros de ajuste fino para diferentes produtos.
Conclusão
A estratégia de seguimento de tendências de dupla linha de tendência combina efetivamente indicadores de suporte/resistência de médio a longo prazo e média móvel para filtrar sinais lucrativos durante as principais tendências, tornando-a uma estratégia de negociação quantitativa relativamente madura.
/*backtest
start: 2024-01-22 00:00:00
end: 2024-02-21 00:00:00
period: 1h
basePeriod: 15m
exchanges: [{"eid":"Futures_Binance","currency":"BTC_USDT"}]
*/

// This Pine Script™ code is subject to the terms of the Mozilla Public License 2.0 at https://mozilla.org/MPL/2.0/
// © neosaid

//@version=5
strategy("Support and resistant Strategy", overlay=true)

// Function to check for breakout
f_breakoutCondition(closingPrice, highestHigh, lowestLow) =>
    closingPrice > highestHigh or closingPrice < lowestLow

// Step 1: 30 Days Trend Line (Lower Lows)
low30Days = request.security(syminfo.tickerid, "D", low)

// Step 2: 30 Weeks Upper Trend Line (Higher Highs)
high30Weeks = request.security(syminfo.tickerid, "W", high)

// Step 3: Trend Line for Lowest Low within the Last Month
var float lowestLowLastMonth = na
for i = 0 to 29
    lowestLowLastMonth := na(lowestLowLastMonth) ? low[i] : math.min(lowestLowLastMonth, low[i])

lowestLowLastMonthValue = lowestLowLastMonth[1]

// Breakout Strategy
highestHighLast3Candles = request.security(syminfo.tickerid, "D", ta.highest(close, 3))
lowestLowLast3Candles = request.security(syminfo.tickerid, "D", ta.lowest(close, 3))

// Additional conditions to filter signals
buyCondition = f_breakoutCondition(close, highestHighLast3Candles, lowestLowLast3Candles) and close > low30Days

sellCondition = f_breakoutCondition(close, highestHighLast3Candles, lowestLowLast3Candles) and close < high30Weeks

// Additional filters to reduce the number of orders
buyFilter = ta.crossover(close, ta.sma(close, 10)) // Buy only when price crosses above a 10-period SMA
sellFilter = ta.crossunder(close, ta.sma(close, 10)) // Sell only when price crosses below a 10-period SMA

buyCondition := buyCondition and buyFilter
sellCondition := sellCondition and sellFilter

// Plot Buy and Sell signals on the chart
plotshape(series=buyCondition, title="Buy Signal", color=color.green, style=shape.triangleup, location=location.belowbar)
plotshape(series=sellCondition, title="Sell Signal", color=color.red, style=shape.triangledown, location=location.abovebar)

// Strategy entries
strategy.entry("Buy", strategy.long, when = buyCondition)
strategy.entry("Sell", strategy.short, when = sellCondition)
- A estratégia de negociação cruzada da média móvel
- Estratégia de negociação de ouro cruzada de média móvel
- A EMA e o MACD seguem a estratégia da tendência
- Estratégia de negociação MACD de cruzamento de média móvel
- Estratégia de reversão diária da Super Tendência
- Estratégia dupla de cruzamento da EMA
- Estratégia de acompanhamento de tendências baseada em indicadores RSI e ZigZag
- Estratégia de ruptura da média móvel cruzada
- Momentum Breakout Backtesting Apoio Resistência Estratégia
- Estratégia do identificador de tendências MyQuant
- Nifty 50 Estratégia de negociação quantitativa baseada no ajustamento dinâmico da posição com níveis de suporte e resistência
- Estratégia de acompanhamento da tendência da média móvel do canal dinâmico
- Estratégia do Sistema Harmônico Dual
- Breach Callback Estratégia longa
- Estratégia de negociação cruzada de MA baseada em cruzações de médias móveis de curto e longo prazo
- Estratégia quantitativa MACD de cruzamento de média móvel dupla
- Estratégia de rebote de pressão média móvel dupla
- Quatro estratégias de rastreamento de tendências da WMA
- Tendência Seguindo a Estratégia Baseada na Regressão Nadaraya-Watson e no Canal ATR
- Estratégia de acompanhamento da tendência baseada no cruzamento da média móvel