ЛИНА КОГА
Автор:Чао Чжан, Дата: 2022-05-20 16:58:28Тэги:HMA
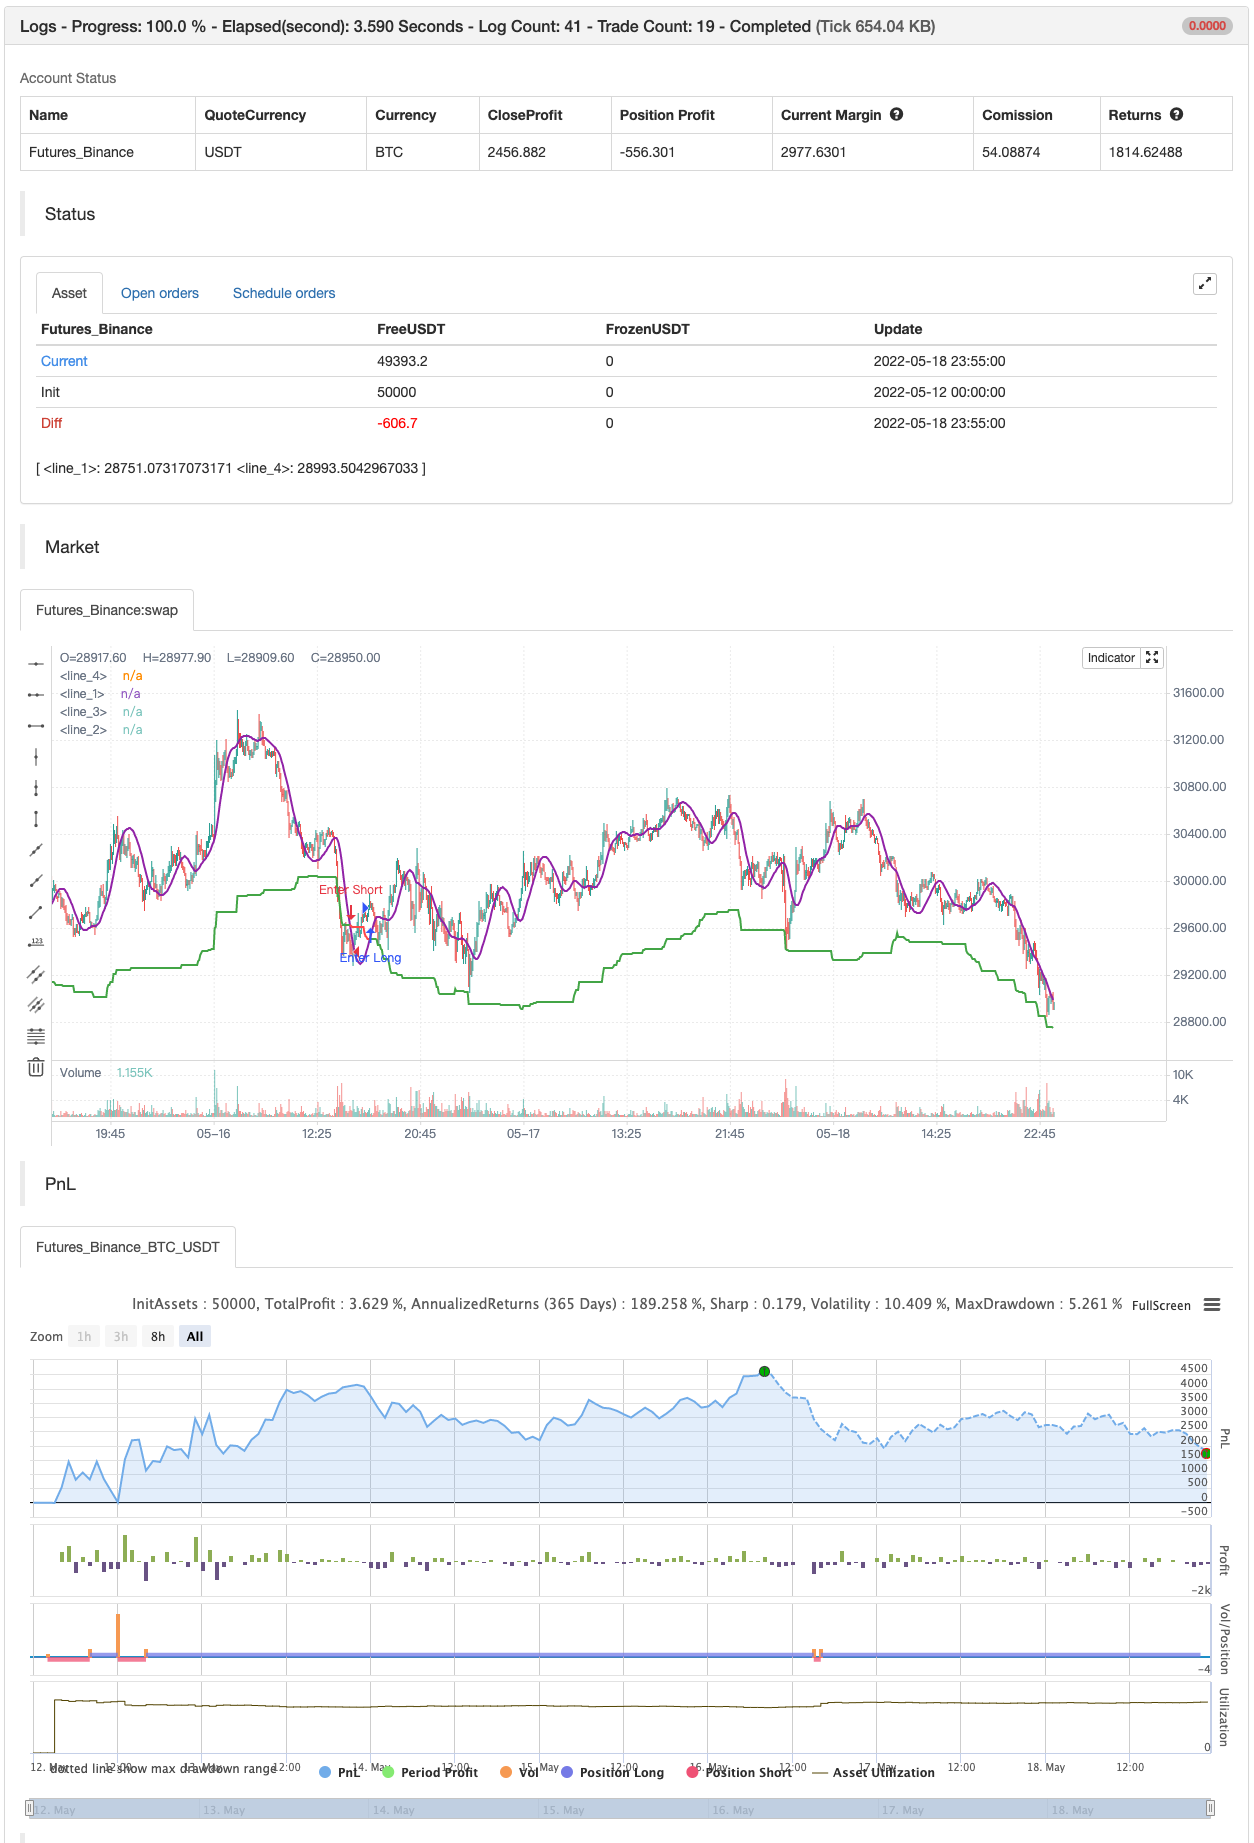
Этот показатель определяет периоды бычьего рынка, когда инвестор может держать актив, и периоды медвежьего рынка, когда они должны избегать его. Технически индикатор представляет собой асимметричный трендовый фильтр, предназначенный для учета того факта, что рыночные распродажи, как правило, более резки, чем восходящие тенденции.
Как использовать Этапообразная линия является основным трендовым фильтром. Она окрашена в зеленый цвет в восходящем тренде и красный в нисходящем тренде. Когда сглаживание включено, в дополнение к трендовому фильтру, индикатор наносит фиолетовую линию. Это скобко движущаяся средняя (HMA) цены. В этом случае индикатор использует эту линию вместо цены для поиска перекрестков с трендовым фильтром. Когда цена или сглаженная линия пересекает трендовый фильтр выше, это сигнал восходящего тренда. Индикатор отмечает такие пересечения зелеными кругами. Он также окрашивает график в зеленый цвет в восходящем тренде. Цена или фиолетовая линия, пересекающая трендовый фильтр ниже, означает сигнал нисходящего тренда. Сигналы нисходящего тренда отображаются в виде красных кругов.
Настройки
Чувствительность
обратная проверка

/*backtest
start: 2022-05-12 00:00:00
end: 2022-05-18 23:59:00
period: 5m
basePeriod: 1m
exchanges: [{"eid":"Futures_Binance","currency":"BTC_USDT"}]
*/

// This source code is subject to the terms of the Mozilla Public License 2.0 at https://mozilla.org/MPL/2.0/
// © AstrideUnicorn

// Asymmetrical Trend Filter aka HODL Line

//@version=5
indicator("HODL LINE", overlay=true)

// initialize indicator period parameter and the asymmetry paramter
length = 300
asymmetry =  0.05 //input.float(defval=0.05,step=0.01, minval=0.01, maxval=0.3)

// script inputs
sensitivity = input.string(defval="Hold Short Term", title="Sensitivity", options=['Super Sensitive','Hold Short Term', 'Hold Medium Term', 'Hold Long Term'])
use_smoothing = input.bool(defval=true, title="Use Smoothing")


// Set the indicator period based on the choosen sensitivity
if sensitivity == 'Super Sensitive'
    length:=50

if sensitivity == 'Hold Short Term'
    length:=100

if sensitivity == 'Hold Medium Term'
    length:=300

if sensitivity == 'Hold Long Term'
    length:=500

// Calculate HODL Line - an assymetric trend filter
HODL_line = (ta.highest(close,length) + ta.lowest(close,length))/(2.0 + asymmetry)

// Calculate smoothed price time series
smoothed_price = ta.hma(close,50)

// Use closing price or smoothed price based on the choosen option for smoothing
price_model = use_smoothing ? smoothed_price : close

// Define conditional color for the HODL Line
hodl_line_color = price_model >= HODL_line ? color.green : color.red

// define the HODL Line crossing conditions
crossing_condition_bull = ta.crossover(price_model, HODL_line)
crossing_condition_bear = ta.crossunder(price_model, HODL_line)

// plotting
plot(HODL_line, color = hodl_line_color, linewidth = 2)

plot(crossing_condition_bull?HODL_line:na, color = color.new(color.green,40), style= plot.style_circles, linewidth = 20)
plot(crossing_condition_bear?HODL_line:na, color = color.new(color.red,40), style= plot.style_circles, linewidth = 20)

bgcolor(color.new(hodl_line_color,80))

plot(use_smoothing?price_model:na, color=color.purple, linewidth=2)

if crossing_condition_bull
    strategy.entry("Enter Long", strategy.long)
else if crossing_condition_bear
    strategy.entry("Enter Short", strategy.short)
- Многопоказательная конвергенция динамических движущихся средних с пересекающейся количественной стратегией
- Многочасовая стратегия прорыва движения Боллинджера в сочетании со стратегией Hull.
- Стратегия количественного измерения двойных среднелинейных скрещиваний Хелла
- Стратегия определения тенденции EMA, основанная на движущейся средней Hull
- Гибкая многоцикличная версия стратегии однолинейного перекрестка
- Стратегия транзакций по пересеченной середине
- Стратегия динамического отслеживания тенденций с использованием множества индикаторов
- HMA оптимизирует многоциклическую стратегию количественной торговли в сочетании с динамическими остановками
- Стратегия высококомплексной уравнительной и рыночной динамики
- Полициклическая стратегия пересечения движущейся средней Hull
- Стратегия сочетания RSI и MA
- Энтропия Шеннона V2
- Супер-трейдер с задержкой остановки
- Поток объема v3
- Часовой скальпинг крипто-фьючерсов с ma & rsi - ogcheckers
- АТР сглаженный
- Поисковик блоков заказов
- TrendScalp-FractalBox-3EMA (включение)
- Сигналы QQE
- U-битная сетка фильтрации амплитуды
- CM MACD Custom Indicator - Многократные временные рамки - V2
- 2 Определение направления движущегося среднего цвета
- Инструмент Scalping PullBack R1
- Стратегия покупки и продажи зависит от AO+Stoch+RSI+ATR
- EMA ТРЕНД НОКУД
- RedK соотношение объемно-ускоренной направленной энергии
- Дончианский прорыв без переокраски
- Красные импульсные полоски
- SuperJump Turn Back Болинджерская полоса
- Фукуицкая тенденция
- Джонни БОТ