Двойная прибыль Двойная остановка потери Следующая остановка потери Биткоин Количественная стратегия
Автор:Чао Чжан, Дата: 2024-01-19 15:07:04Тэги:

Обзор
Логика стратегии
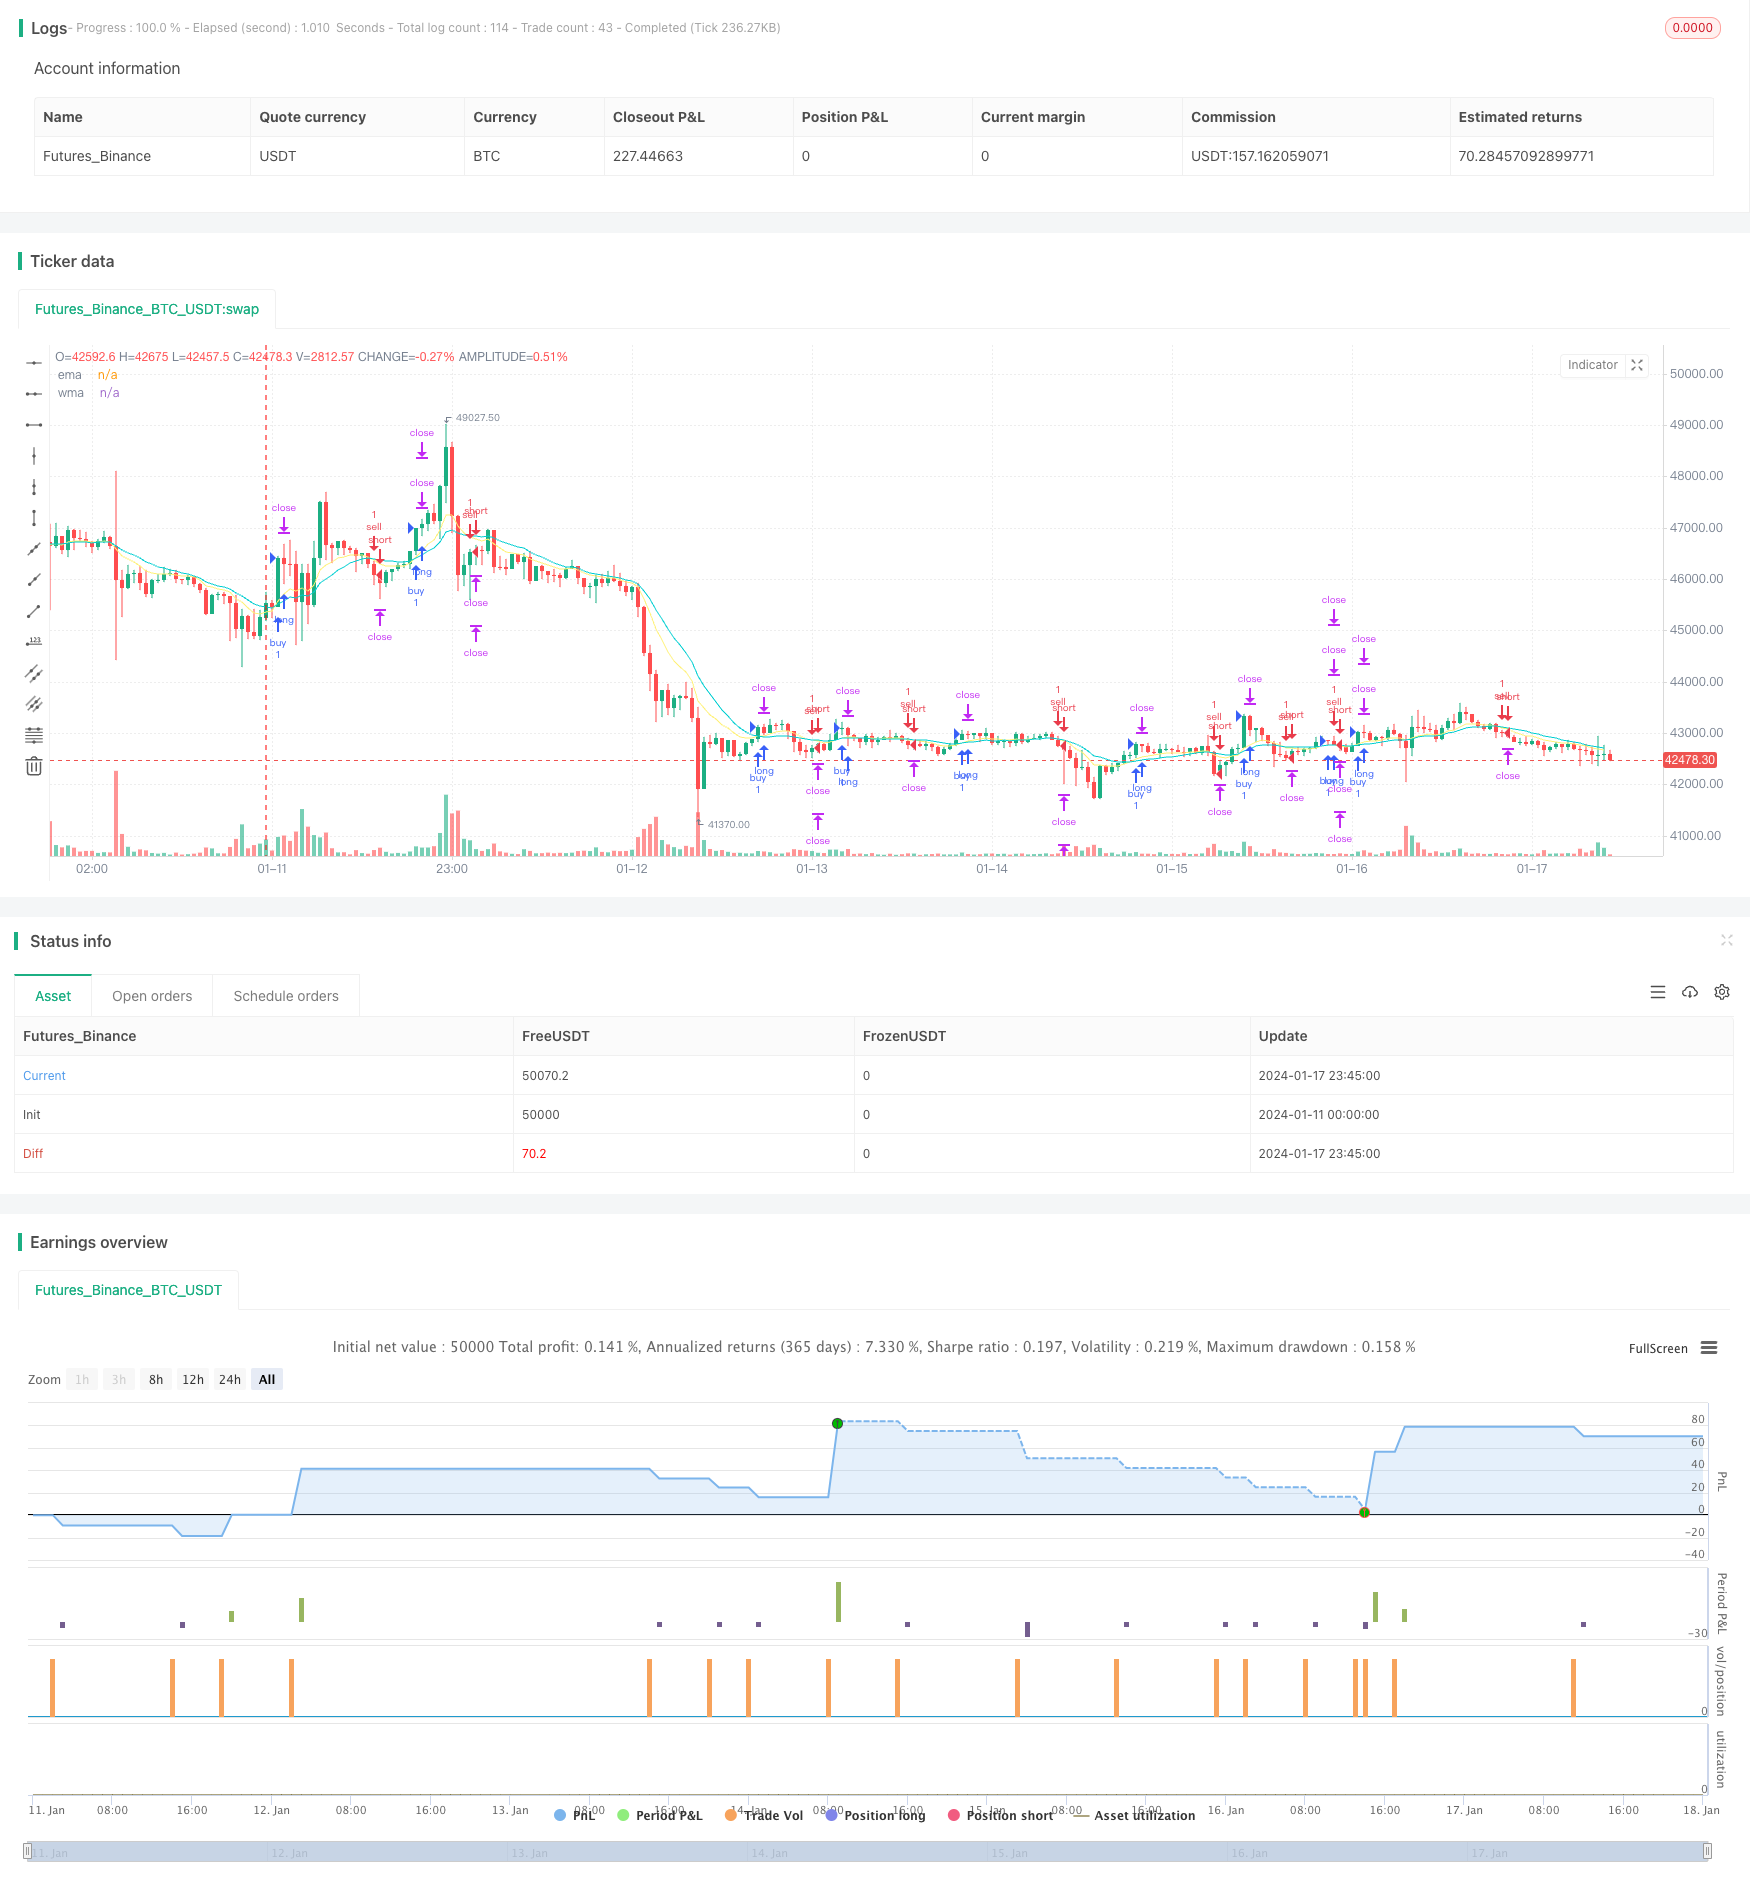
Длинный вход, когда EMA пересекает WMA снизу, и короткий вход, когда EMA пересекает WMA сверху.
На стороне прибыли есть две цели получения прибыли. Первая цель получения прибыли устанавливается на 20 пунктов выше входной цены, а вторая цель получения прибыли устанавливается на 40 пунктов выше входной цены.
На стороне стоп-лосса также есть два стоп-лосса. Первый стоп-лосс устанавливается на 20 пунктов ниже цены входа, а второй стоп-лосс устанавливается на самой цене входа.
Таким образом, для каждой сделки могут быть три возможных результата:
- Сначала цена достигает 1% прибыли, затем второй стоп-потеря, в итоге прибыль 1%.
Анализ преимуществ
Еще одно преимущество заключается в том, что разделение одной сделки на три возможных результата снижает вероятность максимальной потери, что делает общую прибыль более последовательной.
Анализ рисков
Руководство по оптимизации
Следующие области могут быть оптимизированы для стратегии:
-
Испытывайте различные комбинации параметров для поиска оптимальных параметров, например, тестируйте 15 пипсов, 25 пипсов возьмите расстояния прибыли/стоп-лосса.
-
Попробуйте использовать другие комбинации технических индикаторов для входных сигналов, такие как KDJ, MACD crossover.
-
Оптимизировать процент позиции, закрытой при первом получении прибыли, например, 50% может быть не оптимальным, 30% или 70% могут потенциально работать лучше.
-
Испытайте различные настройки для отслеживания скорости остановки потери, чтобы сбалансировать блокировку прибыли и дать ценам достаточно места для колебаний.
Заключение
/*backtest
start: 2024-01-11 00:00:00
end: 2024-01-18 00:00:00
period: 45m
basePeriod: 5m
exchanges: [{"eid":"Futures_Binance","currency":"BTC_USDT"}]
*/

//@version=4
strategy("SL1 Pips after TP1 (MA)", commission_type=strategy.commission.cash_per_order, overlay=true)

// Strategy
Buy  = input(true)
Sell = input(true)

// Date Range
start_year    = input(title='Start year'   ,defval=2020)
start_month   = input(title='Start month'  ,defval=1)
start_day     = input(title='Start day'    ,defval=1)
start_hour    = input(title='Start hour'   ,defval=0)
start_minute  = input(title='Start minute' ,defval=0)
end_time      = input(title='set end time?',defval=false)
end_year      = input(title='end year'     ,defval=2019)
end_month     = input(title='end month'    ,defval=12)
end_day       = input(title='end day'      ,defval=31)
end_hour      = input(title='end hour'     ,defval=23)
end_minute    = input(title='end minute'   ,defval=59)

// MA
ema_period = input(title='EMA period',defval=10)
wma_period = input(title='WMA period',defval=20)
ema        = ema(close,ema_period)
wma        = wma(close,wma_period)

// Entry Condition
buy =
 crossover(ema,wma) and
 nz(strategy.position_size) == 0 and Buy

sell =
 crossunder(ema,wma) and
 nz(strategy.position_size) == 0 and Sell

// Pips
pip = input(20)*10*syminfo.mintick

// Trading parameters //
var bool  LS  = na
var bool  SS  = na
var float EP  = na
var float TVL = na
var float TVS = na
var float TSL = na
var float TSS = na
var float TP1 = na
var float TP2 = na
var float SL1 = na
var float SL2 = na

if buy or sell and strategy.position_size == 0
    EP  := close
    SL1 := EP - pip     * (sell?-1:1)
    SL2 := EP - pip     * (sell?-1:1)
    TP1 := EP + pip     * (sell?-1:1)
    TP2 := EP + pip * 2 * (sell?-1:1)

// current trade direction
LS := buy  or strategy.position_size > 0
SS := sell or strategy.position_size < 0

// adjust trade parameters and trailing stop calculations
TVL := max(TP1,open) - pip[1]
TVS := min(TP1,open) + pip[1]
TSL := open[1] > TSL[1] ? max(TVL,TSL[1]):TVL
TSS := open[1] < TSS[1] ? min(TVS,TSS[1]):TVS

if LS and high > TP1
    if open <= TP1
        SL2:=min(EP,TSL)

if SS and low < TP1
    if open >= TP1
        SL2:=max(EP,TSS)

// Closing conditions
close_long  = LS and open < SL2
close_short = SS and open > SL2

// Buy
strategy.entry("buy"  , strategy.long, when=buy and not SS)
strategy.exit ("exit1", from_entry="buy", stop=SL1, limit=TP1, qty_percent=1)
strategy.exit ("exit2", from_entry="buy", stop=SL2, limit=TP2)

// Sell
strategy.entry("sell" , strategy.short, when=sell and not LS)
strategy.exit ("exit3", from_entry="sell", stop=SL1, limit=TP1, qty_percent=1)
strategy.exit ("exit4", from_entry="sell", stop=SL2, limit=TP2)

// Plots
a=plot(strategy.position_size >  0 ? SL1 : na, color=#dc143c, style=plot.style_linebr)
b=plot(strategy.position_size <  0 ? SL1 : na, color=#dc143c, style=plot.style_linebr)
c=plot(strategy.position_size >  0 ? TP1 : na, color=#00ced1, style=plot.style_linebr)
d=plot(strategy.position_size <  0 ? TP1 : na, color=#00ced1, style=plot.style_linebr)
e=plot(strategy.position_size >  0 ? TP2 : na, color=#00ced1, style=plot.style_linebr)
f=plot(strategy.position_size <  0 ? TP2 : na, color=#00ced1, style=plot.style_linebr)
g=plot(strategy.position_size >= 0 ? na  : EP, color=#ffffff, style=plot.style_linebr)
h=plot(strategy.position_size <= 0 ? na  : EP, color=#ffffff, style=plot.style_linebr)

plot(ema,title="ema",color=#fff176)
plot(wma,title="wma",color=#00ced1)
- Масштабированная нормализованная векторная стратегия с функциями активации, вер.4
- Тенденция после стратегии на основе исторического максимума
- Криптовалютный тренд после стратегии на основе Хайкена Аши
- Количественная стратегия отслеживания тенденции силы МО
- Стратегия торговли двойной скользящей средней ценой
- Биткоин и золото 5-минутная стратегия скальпинга 2.0
- Heiken Ashi Момент Quant Стратегия
- Aroon + Williams + MA + BB + ADX Мощная многопоказательная стратегия
- Кроссовер экспоненциальной скользящей средней и скользящей средней с тесной стратегией
- Оптимизация стратегии тренда на основе диаграммы облаков Ичимоку
- Перекрестное изменение тренда в сочетании с тремя десятиколесными двойными стратегиями
- Средняя свеча Фибоначчи со скользящей средней стратегией для количественной торговли
- Простая стратегия остановки и покупки на основе процента
- Анализ количественной торговой стратегии на основе функции ошибки Гаусса
- Стратегия реверсии ИСО
- Краткосрочная стратегия RSI-VWAP
- Приспосабливаемая криптовалютная сетевая стратегия торговли на основе арбитража